

Imaging of Cell-Cell Communication in a Vertical Orientation Reveals High-Resolution Structure of Immunological Synapse and Novel PD-1 Dynamics
- PMID: 26123352
- PMCID: PMC4506859
- DOI: 10.4049/jimmunol.1403143
Imaging of Cell-Cell Communication in a Vertical Orientation Reveals High-Resolution Structure of Immunological Synapse and Novel PD-1 Dynamics
Abstract
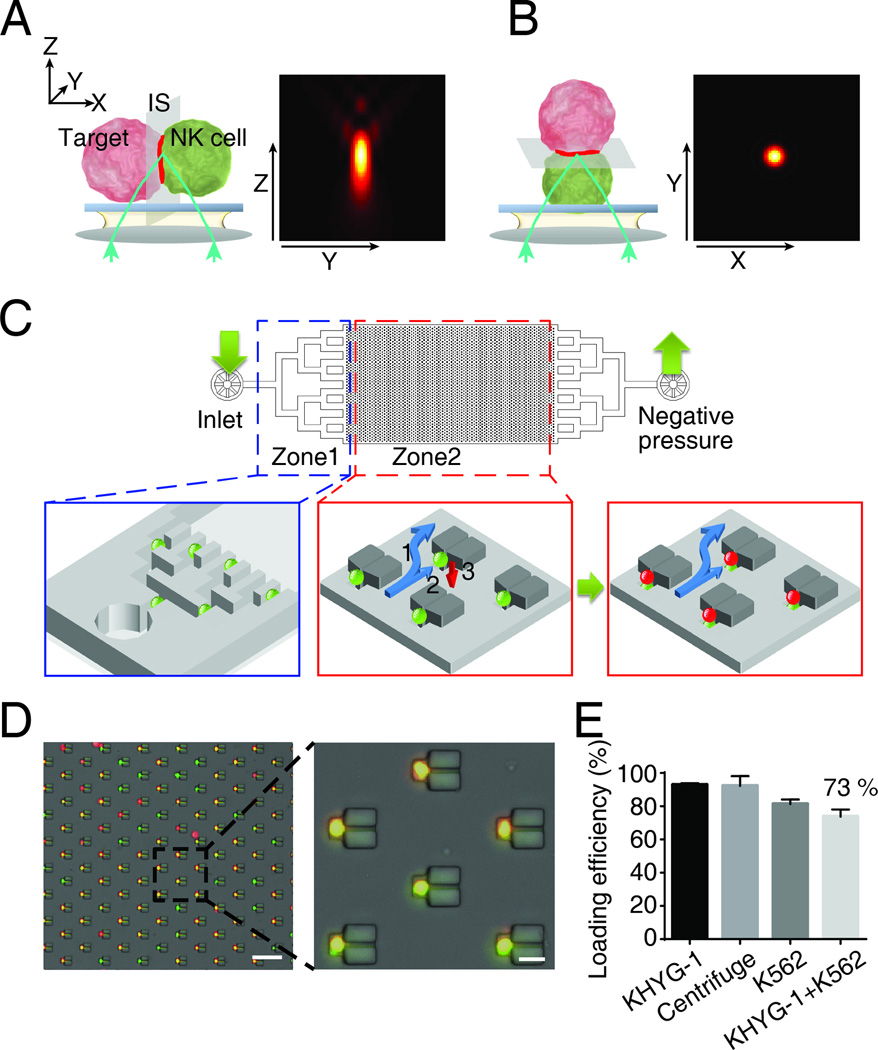
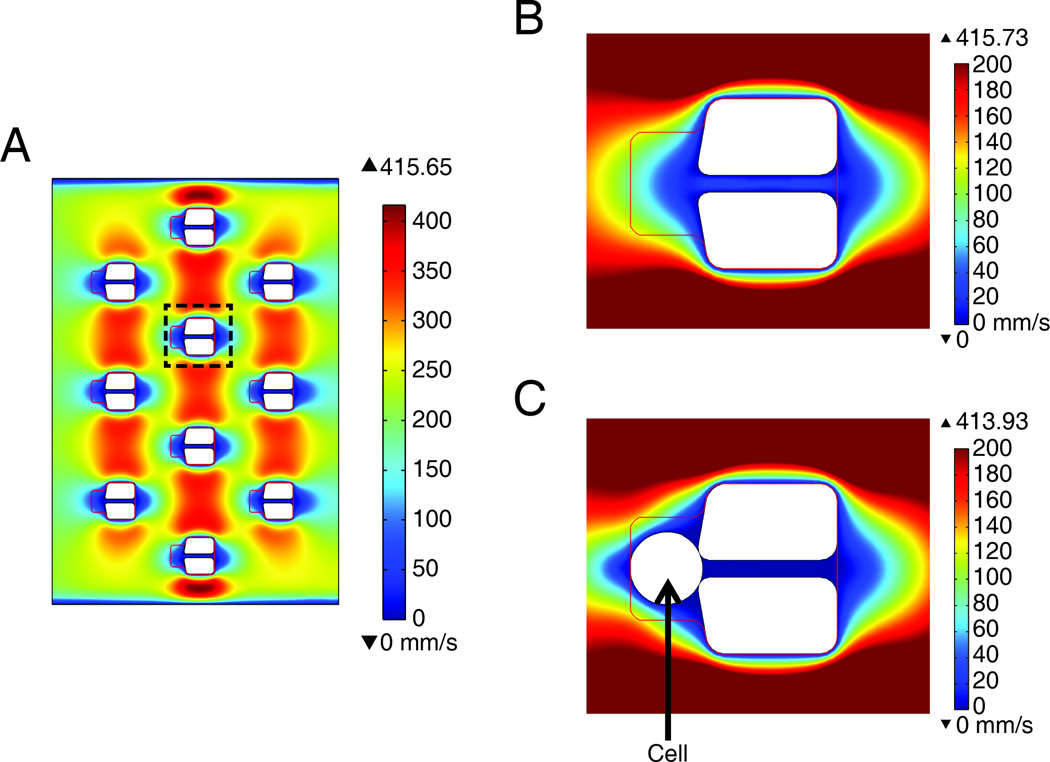
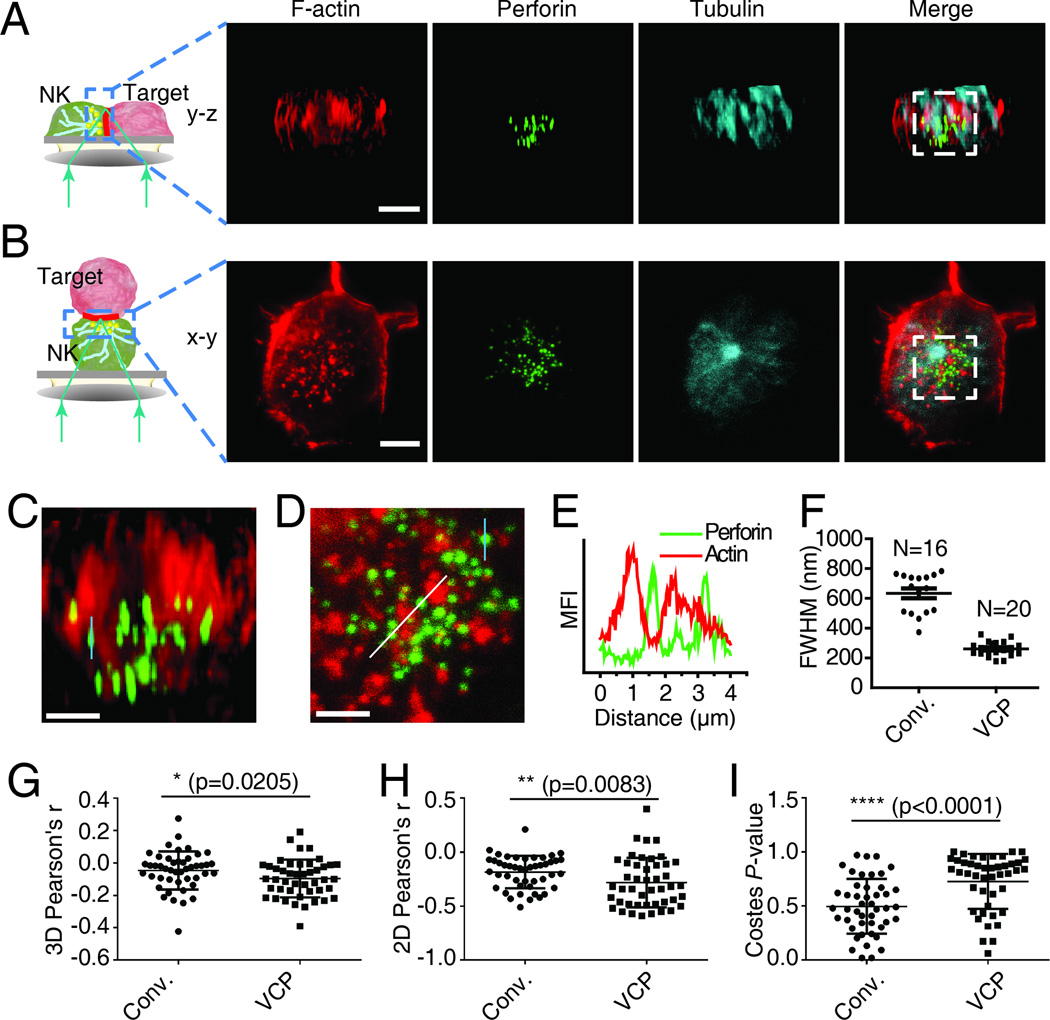
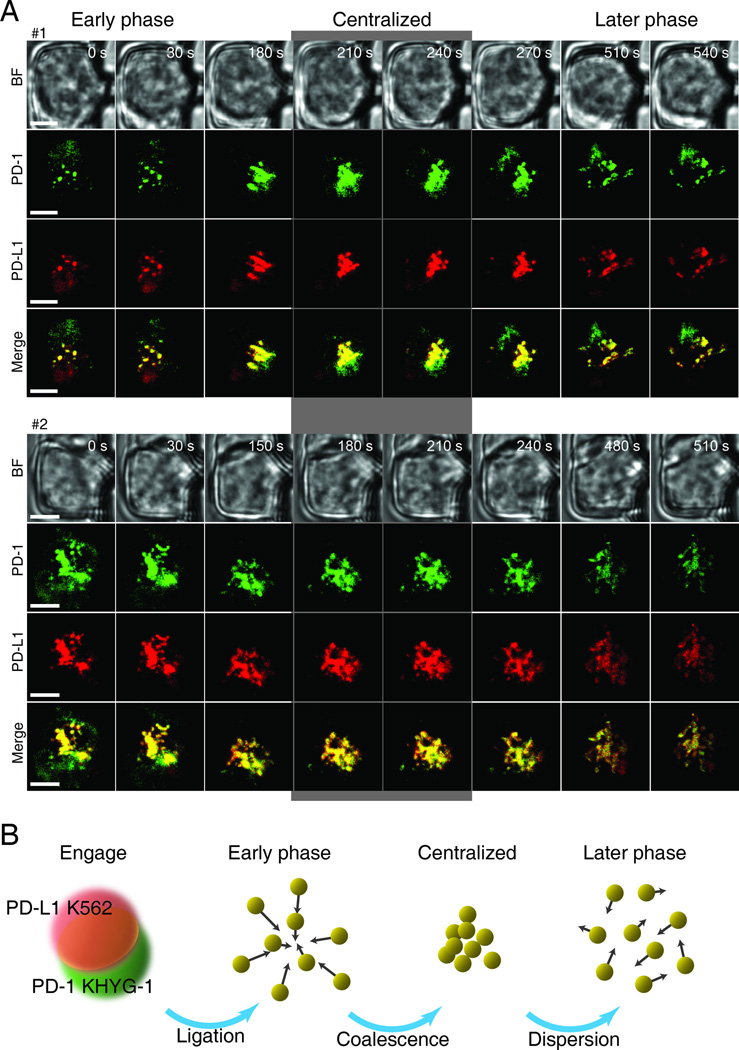
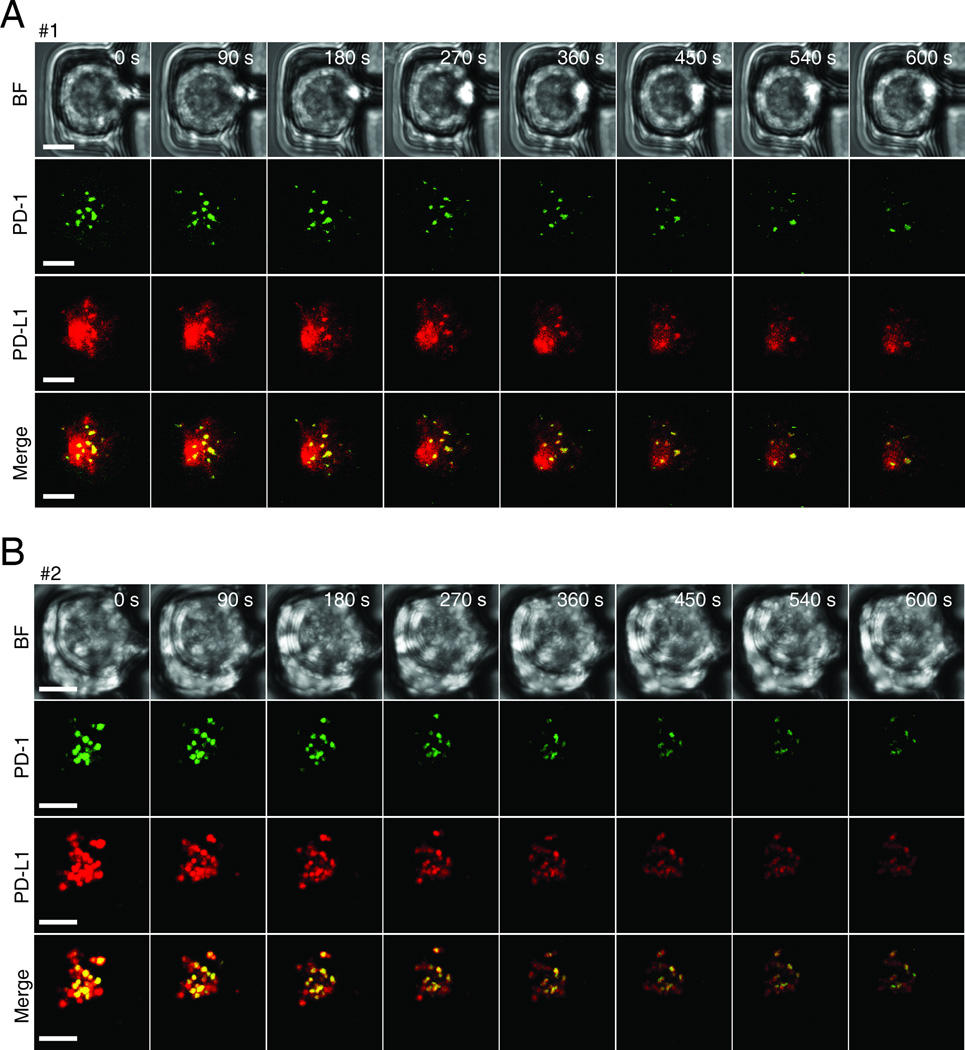
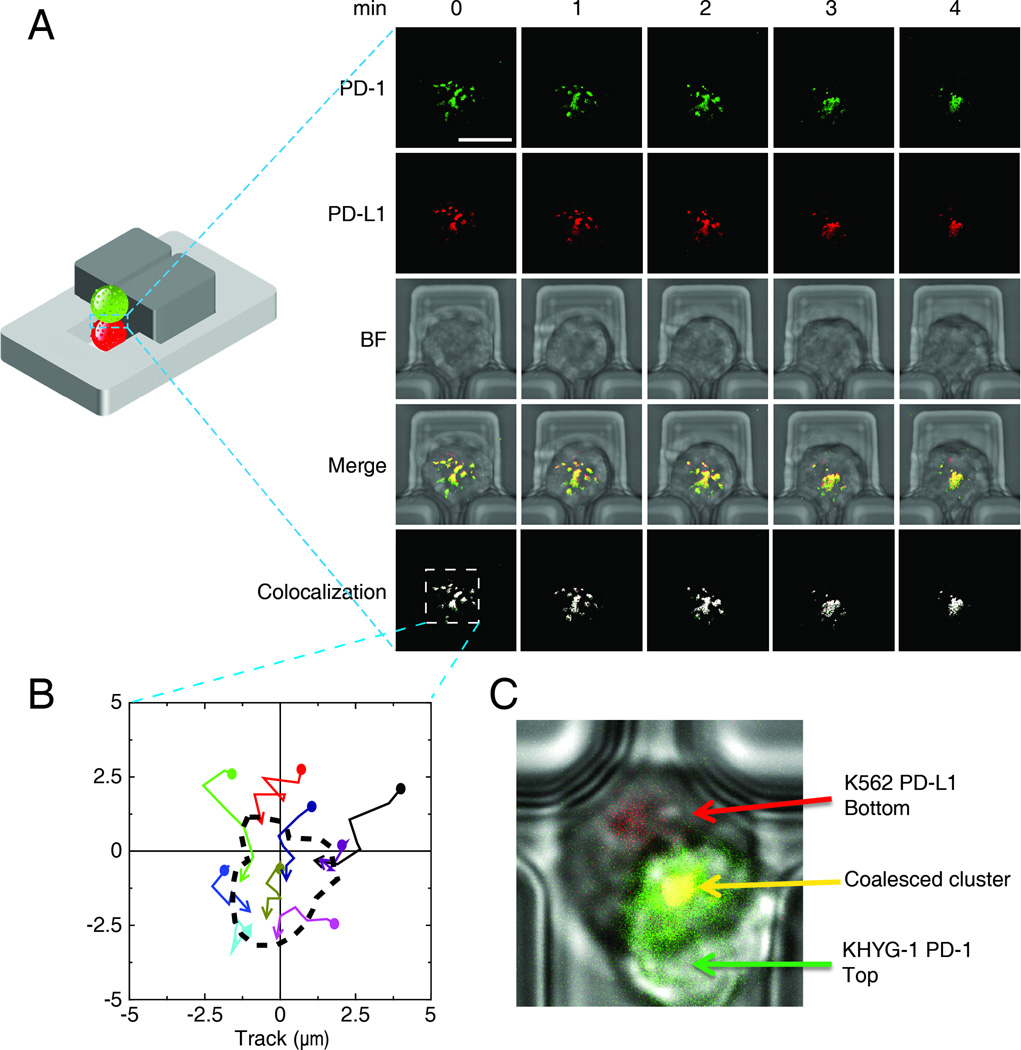
The immunological synapse (IS) is one of the most pivotal communication strategies in immune cells. Understanding the molecular basis of the IS provides critical information regarding how immune cells mount an effective immune response. Fluorescence microscopy provides a fundamental tool to study the IS. However, current imaging techniques for studying the IS cannot sufficiently achieve high resolution in real cell-cell conjugates. In this study, we present a new device that allows for high-resolution imaging of the IS with conventional confocal microscopy in a high-throughput manner. Combining micropits and single-cell trap arrays, we have developed a new microfluidic platform that allows visualization of the IS in vertically "stacked" cells. Using this vertical cell pairing (VCP) system, we investigated the dynamics of the inhibitory synapse mediated by an inhibitory receptor, programed death protein-1, and the cytotoxic synapse at the single-cell level. In addition to the technique innovation, we have demonstrated novel biological findings by this VCP device, including novel distribution of F-actin and cytolytic granules at the IS, programed death protein-1 microclusters at the NK IS, and kinetics of cytotoxicity. We propose that this high-throughput, cost-effective, easy-to-use VCP system, along with conventional imaging techniques, can be used to address a number of significant biological questions in a variety of disciplines.
Copyright © 2015 by The American Association of Immunologists, Inc.
Figures

Similar articles
-
Remodelling of cortical actin where lytic granules dock at natural killer cell immune synapses revealed by super-resolution microscopy.PLoS Biol. 2011 Sep;9(9):e1001152. doi: 10.1371/journal.pbio.1001152. Epub 2011 Sep 13. PLoS Biol. 2011. PMID: 21931537 Free PMC article.
-
Cytoskeletal stabilization of inhibitory interactions in immunologic synapses of mature human dendritic cells with natural killer cells.Blood. 2011 Dec 15;118(25):6487-98. doi: 10.1182/blood-2011-07-366328. Epub 2011 Sep 13. Blood. 2011. PMID: 21917751 Free PMC article.
-
Super-resolution imaging of the natural killer cell immunological synapse on a glass-supported planar lipid bilayer.J Vis Exp. 2015 Feb 11;(96):52502. doi: 10.3791/52502. J Vis Exp. 2015. PMID: 25741636 Free PMC article.
-
Quantitative Imaging Approaches to Study the CAR Immunological Synapse.Mol Ther. 2017 Aug 2;25(8):1757-1768. doi: 10.1016/j.ymthe.2017.06.003. Epub 2017 Jun 26. Mol Ther. 2017. PMID: 28663103 Free PMC article. Review.
-
Cytotoxic immunological synapses.Immunol Rev. 2010 May;235(1):24-34. doi: 10.1111/j.0105-2896.2010.00904.x. Immunol Rev. 2010. PMID: 20536553 Free PMC article. Review.
Cited by
-
PostFocus: automated selective post-acquisition high-throughput focus restoration using diffusion model for label-free time-lapse microscopy.Bioinformatics. 2024 Aug 2;40(8):btae467. doi: 10.1093/bioinformatics/btae467. Bioinformatics. 2024. PMID: 39042160 Free PMC article.
-
Signaling pathway and dysregulation of PD1 and its ligands in lymphoid malignancies.Biochim Biophys Acta. 2016 Jan;1865(1):58-71. doi: 10.1016/j.bbcan.2015.09.002. Epub 2015 Oct 16. Biochim Biophys Acta. 2016. PMID: 26432723 Free PMC article. Review.
-
Evaluation of Single-Cell Cytokine Secretion and Cell-Cell Interactions with a Hierarchical Loading Microwell Chip.Cell Rep. 2020 Apr 28;31(4):107574. doi: 10.1016/j.celrep.2020.107574. Cell Rep. 2020. PMID: 32348757 Free PMC article.
-
Functionalized Lipid Droplets and Microfluidics Approach to Study Immune Cell Polarity In Vitro.Methods Mol Biol. 2023;2654:345-362. doi: 10.1007/978-1-0716-3135-5_22. Methods Mol Biol. 2023. PMID: 37106193
-
The Role of Immunological Synapse in Predicting the Efficacy of Chimeric Antigen Receptor (CAR) Immunotherapy.Cell Commun Signal. 2020 Aug 25;18(1):134. doi: 10.1186/s12964-020-00617-7. Cell Commun Signal. 2020. PMID: 32843053 Free PMC article. Review.
References
-
- Bromley SK, Burack WR, Johnson KG, Somersalo K, Sims TN, Sumen C, Davis MM, Shaw AS, Allen PM, Dustin ML. The immunological synapse. Annu. Rev. Immunol. 2001;19:375–396. - PubMed
-
- Davis DM, Dustin ML. What is the importance of the immunological synapse? Trends Immunol. 2004;25:323–327. - PubMed
-
- Grakoui A, Bromley SK, Sumen C, Davis MM, Shaw AS, Allen PM, Dustin ML. The immunological synapse: A molecular machine controlling T cell activation. Science. 1999;285:221–227. - PubMed
-
- Monks CR, Freiberg BA, Kupfer H, Sciaky N, Kupfer A. Three-dimensional segregation of supramolecular activation clusters in T cells. Nature. 1998;395:82–86. - PubMed
Publication types
MeSH terms
Substances
Grants and funding
- R21 HL125018/HL/NHLBI NIH HHS/United States
- R01 CA180083/CA/NCI NIH HHS/United States
- R01 DA035868/DA/NIDA NIH HHS/United States
- R56 AI130197/AI/NIAID NIH HHS/United States
- P30 AI036211/AI/NIAID NIH HHS/United States
- R01 AI130197/AI/NIAID NIH HHS/United States
- P50CA126752./CA/NCI NIH HHS/United States
- R21 AI129594/AI/NIAID NIH HHS/United States
- R21 AI124769/AI/NIAID NIH HHS/United States
- P50 CA126752/CA/NCI NIH HHS/United States
- 1R01DA035868-01/DA/NIDA NIH HHS/United States
- AI36211/AI/NIAID NIH HHS/United States
- T32 AI053831/AI/NIAID NIH HHS/United States
LinkOut - more resources
Full Text Sources
Other Literature Sources
Research Materials
Miscellaneous