. 2015 Aug 3;125(8):3198-214.
doi: 10.1172/JCI81166. Epub 2015 Jun 29.

IL-34 mediates acute kidney injury and worsens subsequent chronic kidney disease

IL-34 mediates acute kidney injury and worsens subsequent chronic kidney disease

Jea-Hyun Baek et al. J Clin Invest. .

Abstract

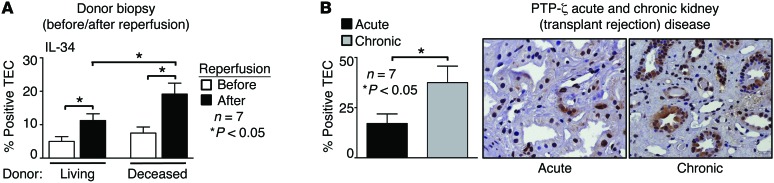
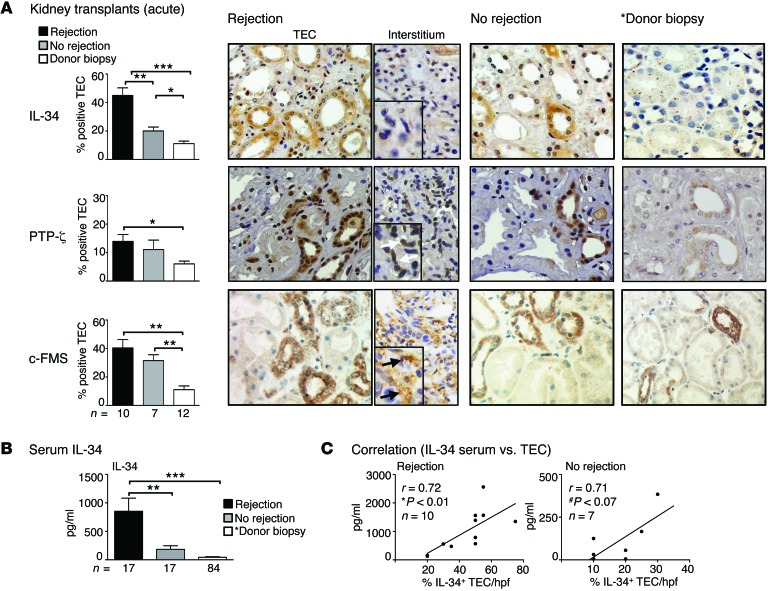
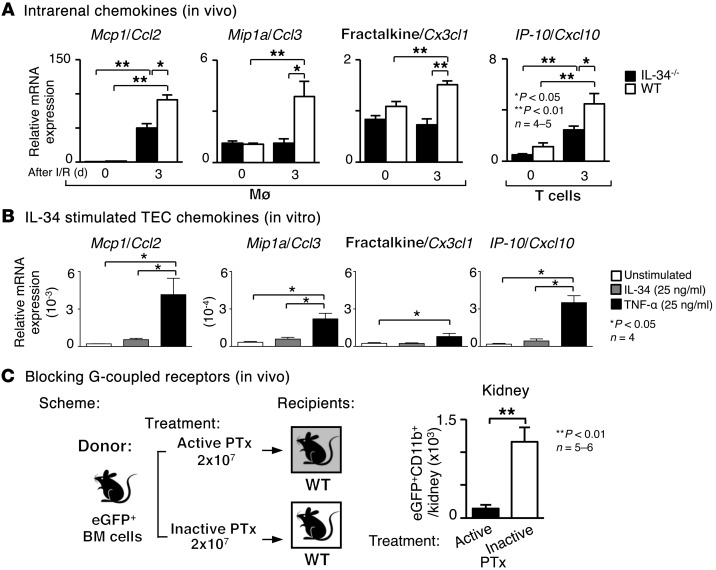
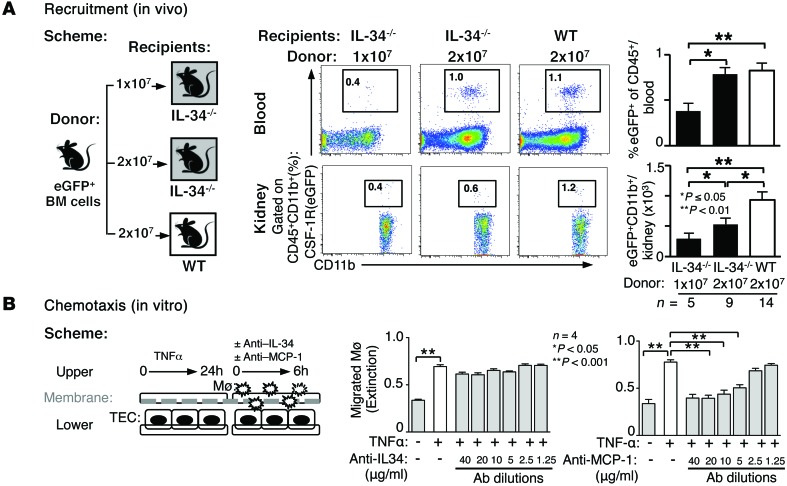
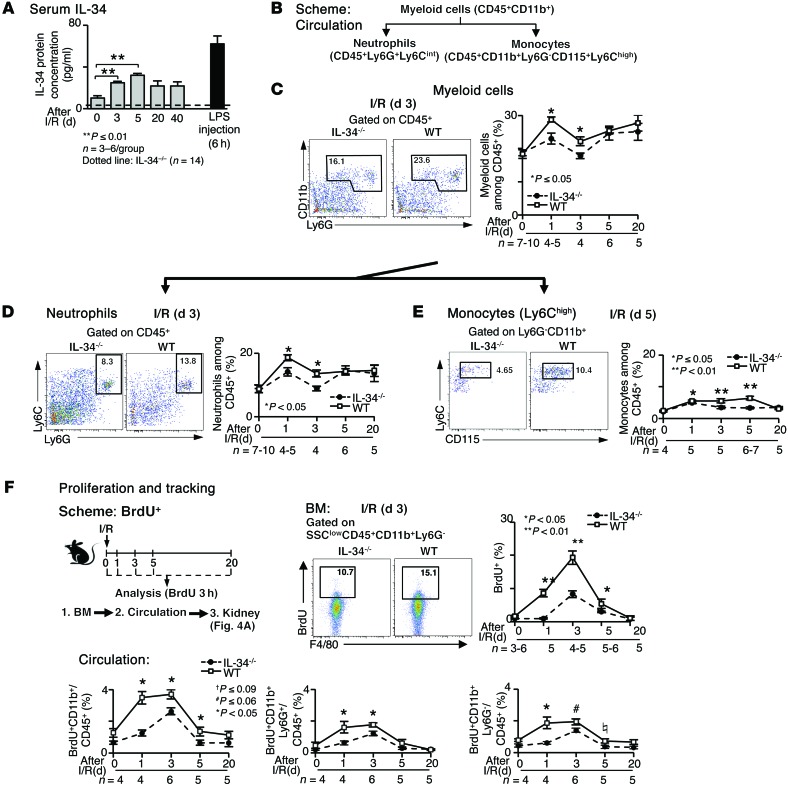
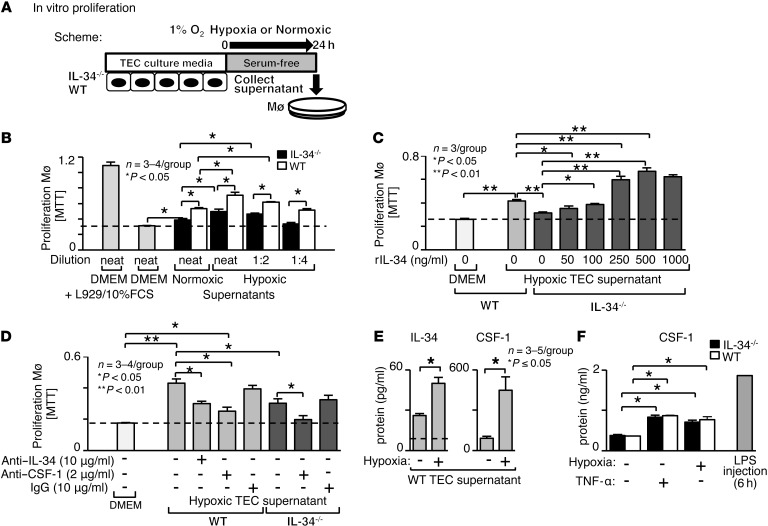
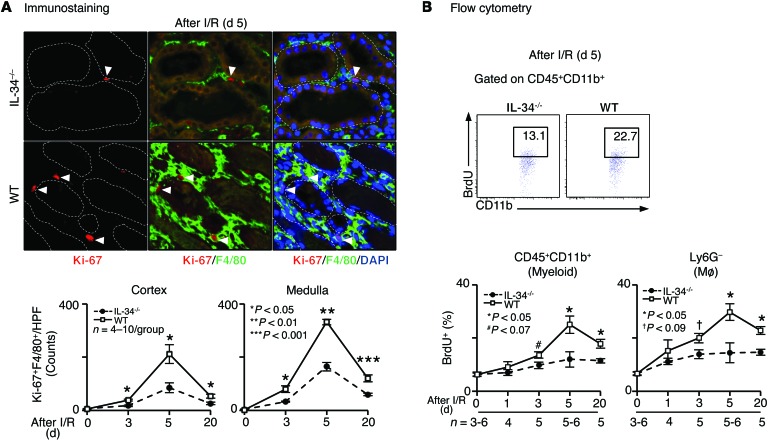
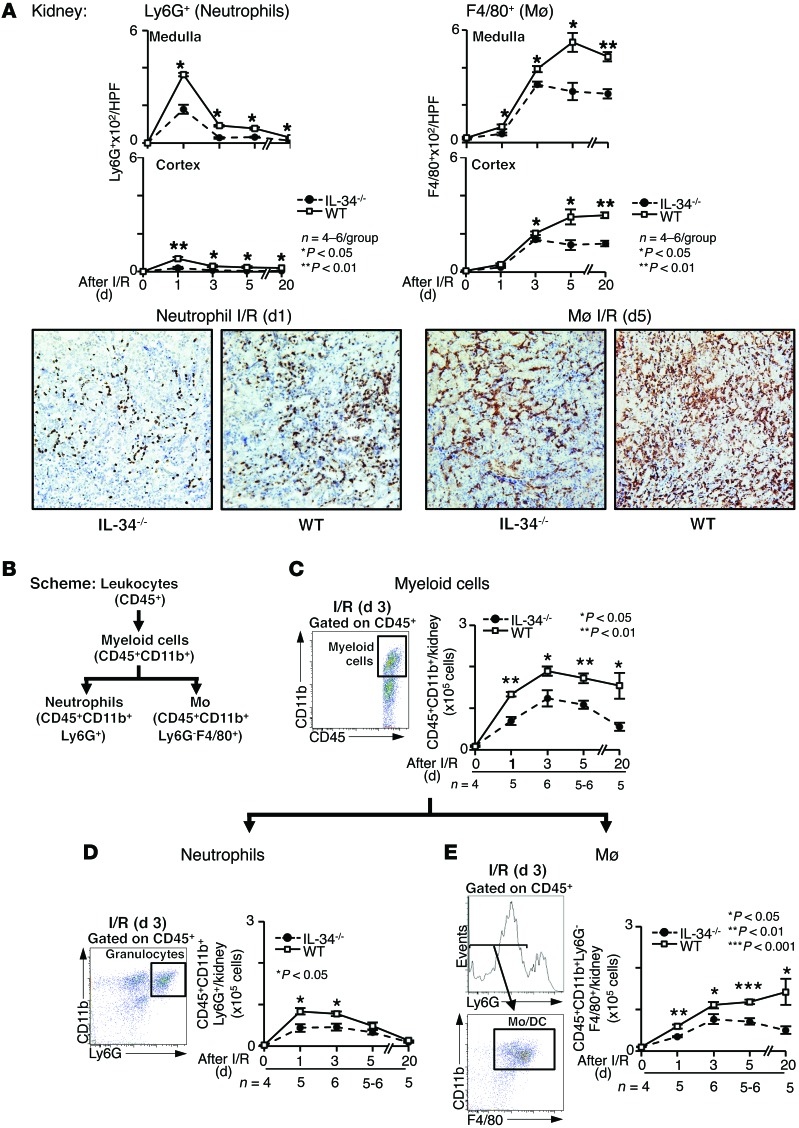
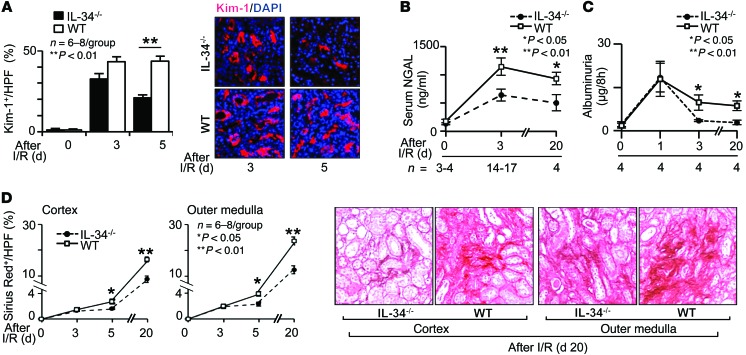
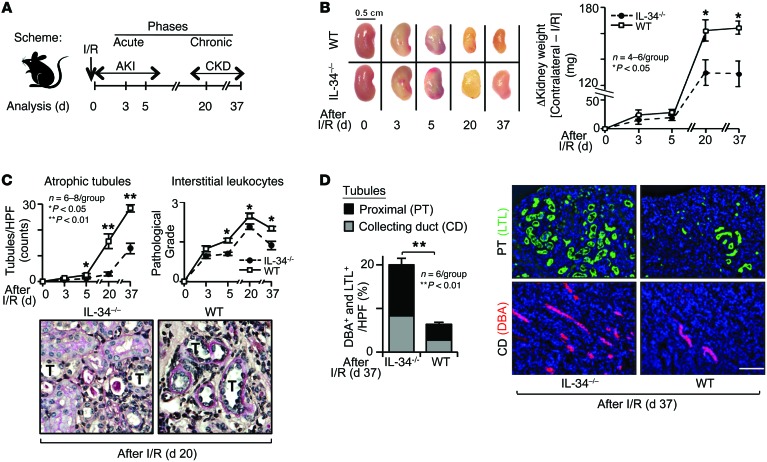
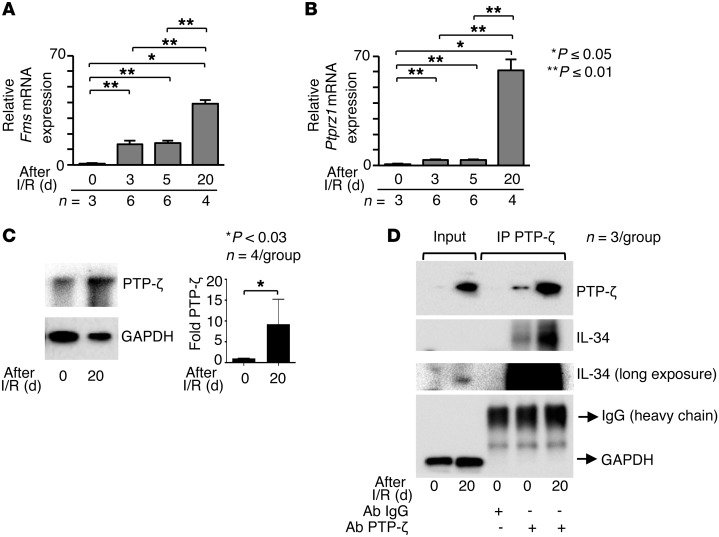
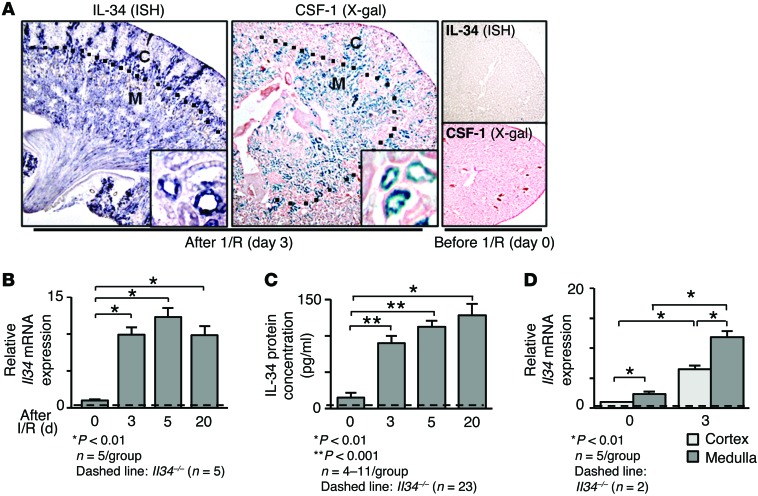
Macrophages (Mø) are integral in ischemia/reperfusion injury-incited (I/R-incited) acute kidney injury (AKI) that leads to fibrosis and chronic kidney disease (CKD). IL-34 and CSF-1 share a receptor (c-FMS), and both cytokines mediate Mø survival and proliferation but also have distinct features. CSF-1 is central to kidney repair and destruction. We tested the hypothesis that IL-34-dependent, Mø-mediated mechanisms promote persistent ischemia-incited AKI that worsens subsequent CKD. In renal I/R, the time-related magnitude of Mø-mediated AKI and subsequent CKD were markedly reduced in IL-34-deficient mice compared with controls. IL-34, c-FMS, and a second IL-34 receptor, protein-tyrosine phosphatase ζ (PTP-ζ) were upregulated in the kidney after I/R. IL-34 was generated by tubular epithelial cells (TECs) and promoted Mø-mediated TEC destruction during AKI that worsened subsequent CKD via 2 distinct mechanisms: enhanced intrarenal Mø proliferation and elevated BM myeloid cell proliferation, which increases circulating monocytes that are drawn into the kidney by chemokines. CSF-1 expression in TECs did not compensate for IL-34 deficiency. In patients, kidney transplants subject to I/R expressed IL-34, c-FMS, and PTP-ζ in TECs during AKI that increased with advancing injury. Moreover, IL-34 expression increased, along with more enduring ischemia in donor kidneys. In conclusion, IL-34-dependent, Mø-mediated, CSF-1 nonredundant mechanisms promote persistent ischemia-incited AKI that worsens subsequent CKD.


Figures

Figure 12
Figure 12. IL-34 is upregulated in reperfused deceased donor kidneys, and PTP-ζ is more abundantly expressed in chronic than acute transplant rejected kidneys.
(A) IL-34 expression in living and deceased donor biopsies before and after reperfusion (n = 7/group). (B) PTP-ζ expression in acute and chronic disease in human kidney transplants (n = 7/group). Graph and representative photomicrographs. Original magnification, ×40. Demographic and patient clinical characteristics detailed in Supplemental Table 1. Statistics analyzed by the Mann-Whitney U test. *P < 0.05. Values are means ± SEM.
Figure 11
Figure 11. Intrarenal IL-34 is increased in engrafted and rejected kidney transplants.
(A) Kidney biopsies include: the *donor (defined as donor biopsy from living and deceased donors after reperfusion) and engrafted and rejected (acute cellular) transplant (within 6 months of transplant). IL-34, PTP-ζ, and c-FMS expression detected in renal biopsy by immunostaining (brown reaction product) in TECs and interstitium. White arrows denote PTP-ζ–expressing cells, and black arrows denote c-FMS–expressing cells. Representative photomicrographs. Original magnification, ×40 (n = 7–12/group). (B) Serum IL-34 expression in *donor and transplanted kidneys quantified by an ELISA (n = 17–84/group). (C) Correlation of serum and IL-34+ TEC expression (n = 7–10/group). Demographic and patient clinical characteristics detailed in Supplemental Table 1. Statistics analyzed by the Mann-Whitney U test. *P < 0.05, **P < 0.01, ***P < 0.001. Values are means ± SEM.
Figure 10
Figure 10. IL-34 mediates a rise in intrarenal chemokines that recruit monocytes to the inflamed kidney.
(A) Kidneys are analyzed for transcript expression of selected chemokines at d3 after I/R using qPCR (n = 4–5/group). (B) TECs after stimulation with IL-34 and TNFα are analyzed for transcript expression of select chemokines (n = 4/group), repeated 2×. (C) Recruitment of myeloid cells tested as in A. To inhibit G-coupled receptors, donor cells are pretreated with PTx (100 ng/ml, 1 hour). Control: donor cells pretreated with heat-inactivated PTx (n = 5–6/group). Statistical differences are determined by Mann-Whitney U test. *P < 0.05, **P < 0.01. Values are means ± SEM.
Figure 9
Figure 9. IL-34 recruits BM derived cells to the kidney by indirectly amplifying intrarenal chemokines after I/R.
(A) Il34–/– and WT mice are intravenously injected either with the same or half the number of BM cells from MacGreen mice 3 hours before sacrifice at d1 after I/R. Blood and kidney are collected and analyzed by flow cytometry for the number and frequency of donor cells, respectively (n = 5–14/group). (B) Induction of BMMø migration to stimulated TEC supernatants incubated with and without diluted anti–IL-34 and anti–MCP-1 Abs (n = 4/group), repeated 3×. Statistical differences are determined by Mann-Whitney U test. *P < 0.05, **P < 0.01. Values are means ± SEM.
Figure 8
Figure 8. IL-34 promotes myeloid cell proliferation in BM and increases circulating monocyte.
(A) IL-34 protein in the circulation of WT mice after I/R measured using an ELISA (n = 3–6/group). The serum collected 6 hours after LPS injection (25 μg, i.p.) into WT mice is used as a positive control, and serum from Il34–/– mice (dashed line) is used as a negative control (n = 14). (BE) Scheme (B), graphs, and plots using flow cytometry analysis to evaluate the frequency of myeloid cells (C), neutrophils (D), and monocytes (E) in the circulation after I/R (n = 4–10/group). (F) Scheme. BrdU (2 mg) was injected 3 hours prior to sacrifice. Data was analyzed using flow cytometry. BM: Proliferating SSClo myeloid cells in BM. Circulation: Proliferating circulating myeloid cells, Ly6Chi neutrophils and monocytes mice (n = 3–6/group). Statistics analyzed using Mann-Whitney U test. *P < 0.05, **P < 0.01, #P ≤ 0.06, P < 0.09. Values are means ± SEM.
Figure 7
Figure 7. IL-34 generated from hypoxic TECs directly induces Mø proliferation.
In vitro Mø proliferation: (A) Scheme. (B) Cultured WT BMMø stimulated (24 hours) with supernatants of Il34–/– and WT TECs after hypoxia or normoxic (24 hours) (MTT assay) (n = 3–4/group). (C) To rescue IL-34 in Il34–/– TEC supernatant, rIL-34 is added to TEC supernatant prior to stimulating WT BMMø (MTT assay) (n = 3/group). (D) To block IL-34 or CSF-1 in WT TEC supernatant, anti–IL-34 or anti–CSF-1 Ab, respectively, are added to the TEC supernatant prior to stimulating WT BMMø (n = 3–4/group). (E) IL-34 and CSF-1 protein in supernatant of hypoxic and normoxic (24 hours) TECs evaluated by ELISA (n = 3-5/group). Dotted line represents Il34–/– hypoxic supernatant control (n = 2). (F) CSF-1 protein in the supernatant of TNFα (25 ng/ml) stimulated and hypoxic Il34–/– and WT TECs. CSF-1 control is serum from mice injected i.p. with LPS (25 μg) (n = 3–5/group). Statistics analyzed using the Mann-Whitney U test. *P ≤ 0.05, **P < 0.01. Values are means ± SEM.
Figure 6
Figure 6. IL-34 expressed by TECs promotes Mø proliferation.
In vivo Mø Proliferation: (A) Paraffin sections dual-stained with anti-Ki67 (red) and anti-F4/80 (green) Ab to identify proliferating Mø after I/R (n = 4–10/group). Dashed white lines outline tubules, and white arrows indicate Ki67-positive nuclei. Representative photomicrographs and corresponding graphs (Ki67+F4/80+ cells/HPF). Original magnification, ×20. (B) Proliferating myeloid cells and Mø are identified by BrdU staining and analyzed using flow cytometry (n = 3–6/group). Statistics analyzed using the Mann-Whitney U test. *P < 0.05, **P < 0.01, ***P < 0.001, #P < 0.07, P < 0.09. Values are means ± SEM.
Figure 5
Figure 5. Fewer Mø and neutrophils in Il34–/– compared with WT kidneys after I/R.
(A) Neutrophils (Ly6G+/HPF) and Mø (F4/80+/HPF) in the cortex and medulla identified using immunostaining. Representative photomicrographs. Original magnification, ×10 (n = 4–6/group). (B) Scheme depicting cell-sorting approach. (C–E) Myeloid cell (C), neutrophil (D), and Mø (E) analysis by flow cytometry from the whole kidney (n = 4–6/group). Graphs and representative plots. Statistics analyzed using the Mann-Whitney U test. *P < 0.05, **P < 0.01, ***P < 0.001. Values are means ± SEM.
Figure 4
Figure 4. KIM-1 expression and intrarenal fibrosis are decreased in Il34–/– after I/R.
(A) KIM-1 expression (red) immunofluorescence after I/R. Graphs (KIM-1/HPF) and representative photomicrographs. Nuclei are stained with DAPI (blue). Original magnification, ×20 (n = 6–8/group). (B) Serum NGAL levels evaluated by Luminex technology. (C) Urine albumin excretion over 8 hours evaluated by SDS-PAGE after I/R (n = 3–17/group). (D) Renal fibrosis using collagen staining (Picrosirius red). Graphs (% Picrosirius red) and representative photomicrographs after I/R. Original magnification, ×10 (n = 6–8/group). Statistics analyzed using the Mann-Whitney U test. *P < 0.05, **P < 0.01. Values are means ± SEM.
Figure 3
Figure 3. Tubular atrophy and interstitial infiltration are diminished in Il34–/– after I/R.
(A) Scheme: Time-related comparison for AKI and CKD after I/R. (B) Representative kidneys from Il34–/– and WT B6 mice (left panel) and change in kidney weights (contralateral minus I/R kidney; right panel) after I/R (n = 4–6/group). (C) Graphs indicate tubular atrophy and interstitial infiltration grades after I/R injury. Representative photomicrographs after I/R. Original magnification, ×40. T, Tubule (n = 6–8/group). (D) LTL identifies proximal tubules, and DBA identifies collecting ducts after I/R. Graphs and representative photomicrographs after I/R. Original magnification, ×10 (n = 6/group). Statistics analyzed using the Mann-Whitney U test. *P < 0.05, **P < 0.01. Values are means ± SEM.
Figure 2
Figure 2. IL-34 receptors have overlapping and distinct expression in the kidney after I/R and IL-34 binds to PTP-ζ.
(A–B) Intrarenal Fms (A) and Ptprz1 (B) transcript expression on the same samples using qPCR (repeated 3×). Statistics analyzed using the Mann-Whitney U test. *P ≤ 0.05, **P ≤ 0.01. Values are means ± SEM. (C). Intrarenal PTP-ζ protein levels detected by immunoblotting. Quantitation of PTP-ζ relative to GAPDH (n = 4). Statistics analyzed using unpaired t test (Mann-Whitney U test). *P < 0.03. Values are means ± SEM. (D) Immunoprecipitation performed from kidney lysates with PTP-ζ or control (mouse IgG) Ab showing IL-34 binding to PTP-ζ (n = 3).
Figure 1
Figure 1. IL-34 is increased in the kidney after I/R.
In each figure, expression is analyzed before and after I/R. (A) IL-34 expression in B6 TECs identified using in situ hybridization (ISH), and CSF-1 using a CSF-1 reporter mouse (lacZ under control of Csf1 promoter and first intron) stained for β-galactosidase activity (X-gal). Representative photomicrographs (n = 5). Original magnification, ×2.5; inset, ×20. Dotted lines indicate the junction between the cortex (C) and the medulla (M). (B and C) We detected expression of intrarenal IL-34 transcripts and protein using qPCR (n = 5/group) (B) and ELISA (n = 4–11/group) (C), respectively. (D) Il34 transcripts in the cortex and medulla were evaluated using qPCR (n = 5/group). *P < 0.01, **P < 0.001. Statistics analyzed using the Mann-Whitney U test. Values are means ± SEM.

Comment in

Similar articles

Cited by

References

    1. Lee S, et al. Distinct macrophage phenotypes contribute to kidney injury and repair. J Am Soc Nephrol. 2011;22(2):317–326. doi: 10.1681/ASN.2009060615. - DOI - PMC - PubMed
    1. Lech M, et al. Macrophage phenotype controls long-term AKI outcomes--kidney regeneration versus atrophy. J Am Soc Nephrol. 2014;25(2):292–304. doi: 10.1681/ASN.2013020152. - DOI - PMC - PubMed
    1. Iwata Y, et al. Aberrant macrophages mediate defective kidney repair that triggers nephritis in lupus-susceptible mice. J Immunol. 2012;188(9):4568–4580. doi: 10.4049/jimmunol.1102154. - DOI - PMC - PubMed
    1. Menke J, et al. CSF-1 signals directly to renal tubular epithelial cells to mediate repair in mice. J Clin Invest. 2009;119(8):2330–2342. doi: 10.1172/JCI39087. - DOI - PMC - PubMed
    1. Bloom RD, Florquin S, Singer GG, Brennan DC, Kelley VR. Colony stimulating factor-1 in the induction of lupus nephritis. Kidney Int. 1993;43(5):1000–1009. doi: 10.1038/ki.1993.141. - DOI - PubMed

Publication types

MeSH terms

Substances