SIRT3-SOD2-mROS-dependent autophagy in cadmium-induced hepatotoxicity and salvage by melatonin
- PMID: 26120888
- PMCID: PMC4590599
- DOI: 10.1080/15548627.2015.1052208
SIRT3-SOD2-mROS-dependent autophagy in cadmium-induced hepatotoxicity and salvage by melatonin
Abstract
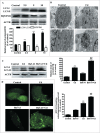
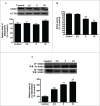
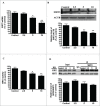
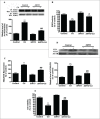
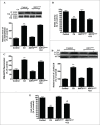
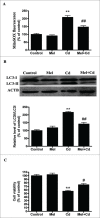
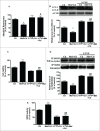
Cadmium is one of the most toxic metal compounds found in the environment. It is well established that Cd induces hepatotoxicity in humans and multiple animal models. Melatonin, a major secretory product of the pineal gland, has been reported to protect against Cd-induced hepatotoxicity. However, the mechanism behind this protection remains to be elucidated. We exposed HepG2 cells to different concentrations of cadmium chloride (2.5, 5, and 10 μM) for 12 h. We found that Cd induced mitochondrial-derived superoxide anion-dependent autophagic cell death. Specifically, Cd decreased SIRT3 protein expression and activity and promoted the acetylation of SOD2, superoxide dismutase 2, mitochondrial, thus decreasing its activity, a key enzyme involved in mitochondrial ROS production, although Cd did not disrupt the interaction between SIRT3 and SOD2. These effects were ameliorated by overexpression of SIRT3. However, a catalytic mutant of SIRT3 (SIRT3(H248Y)) lacking deacetylase activity lost the capacity to suppress Cd-induced autophagy. Notably, melatonin treatment enhanced the activity but not the expression of SIRT3, decreased the acetylation of SOD2, inhibited mitochondrial-derived O2(•-) production and suppressed the autophagy induced by 10 μM Cd. Moreover, 3-(1H-1,2,3-triazol-4-yl)pyridine, a confirmed selective SIRT3 inhibitor, blocked the melatonin-mediated suppression of autophagy by inhibiting SIRT3-SOD2 signaling. Importantly, melatonin suppressed Cd-induced autophagic cell death by enhancing SIRT3 activity in vivo. These results suggest that melatonin exerts a hepatoprotective effect on mitochondrial-derived O2(•-)-stimulated autophagic cell death that is dependent on the SIRT3/SOD2 pathway.
Keywords: 3-MA, 3-methyladenine; 3-TYP, 3-(1H-1,2,3-triazol-4-yl)pyridine; ACTB, actin, β; Baf A1, bafilomycin A1; Cd, cadmium; CdCl2, cadmium chloride; GPT/ALT, glutamic-pyruvate transaminase (alanine aminotransferase); H2O2, hydrogen peroxide; LC3, microtubule-associated protein 1 light chain 3; O2•−, superoxide anion; SIRT1, sirtuin 1; SIRT3; SIRT3, sirtuin 3; SOD2; SOD2, superoxide dismutase 2, mitochondrial; SQSTM1/p62, sequestosome 1; autophagy; cadmium; hepatotoxicity; mROS, mitochondrial reactive oxygen species; mel, melatonin; melatonin; mitochondrial ROS; tf-LC3, tandem fluorescent mRFP-GFP-LC3B.
Figures




Similar articles
-
Efficacy of 5-aminolevulinic acid-based photodynamic therapy against keloid compromised by downregulation of SIRT1-SIRT3-SOD2-mROS dependent autophagy pathway.Redox Biol. 2019 Jan;20:195-203. doi: 10.1016/j.redox.2018.10.011. Epub 2018 Oct 17. Redox Biol. 2019. PMID: 30368039 Free PMC article.
-
Excessive production of mitochondrion‑derived reactive oxygen species induced by titanium ions leads to autophagic cell death of osteoblasts via the SIRT3/SOD2 pathway.Mol Med Rep. 2020 Jul;22(1):257-264. doi: 10.3892/mmr.2020.11094. Epub 2020 Apr 24. Mol Med Rep. 2020. PMID: 32468046 Free PMC article.
-
Resveratrol rescues cadmium-induced mitochondrial injury by enhancing transcriptional regulation of PGC-1α and SOD2 via the Sirt3/FoxO3a pathway in TCMK-1 cells.Biochem Biophys Res Commun. 2017 Apr 22;486(1):198-204. doi: 10.1016/j.bbrc.2017.03.027. Epub 2017 Mar 9. Biochem Biophys Res Commun. 2017. PMID: 28286268
-
NAD+ precursor modulates post-ischemic mitochondrial fragmentation and reactive oxygen species generation via SIRT3 dependent mechanisms.Exp Neurol. 2020 Mar;325:113144. doi: 10.1016/j.expneurol.2019.113144. Epub 2019 Dec 16. Exp Neurol. 2020. PMID: 31837320 Free PMC article. Review.
-
SIRT3 a Major Player in Attenuation of Hepatic Ischemia-Reperfusion Injury by Reducing ROS via Its Downstream Mediators: SOD2, CYP-D, and HIF-1α.Oxid Med Cell Longev. 2018 Nov 13;2018:2976957. doi: 10.1155/2018/2976957. eCollection 2018. Oxid Med Cell Longev. 2018. PMID: 30538800 Free PMC article. Review.
Cited by
-
Melatonin improves age-induced fertility decline and attenuates ovarian mitochondrial oxidative stress in mice.Sci Rep. 2016 Oct 12;6:35165. doi: 10.1038/srep35165. Sci Rep. 2016. PMID: 27731402 Free PMC article.
-
Diclofenac impairs autophagic flux via oxidative stress and lysosomal dysfunction: Implications for hepatotoxicity.Redox Biol. 2020 Oct;37:101751. doi: 10.1016/j.redox.2020.101751. Epub 2020 Oct 12. Redox Biol. 2020. PMID: 33080439 Free PMC article.
-
Long-term exercise prevents hepatic steatosis: a novel role of FABP1 in regulation of autophagy-lysosomal machinery.FASEB J. 2019 Nov;33(11):11870-11883. doi: 10.1096/fj.201900812R. Epub 2019 Jul 31. FASEB J. 2019. PMID: 31366243 Free PMC article.
-
Sirtuin 3-dependent mitochondrial redox homeostasis protects against AGEs-induced intervertebral disc degeneration.Redox Biol. 2018 Oct;19:339-353. doi: 10.1016/j.redox.2018.09.006. Epub 2018 Sep 6. Redox Biol. 2018. PMID: 30216853 Free PMC article.
-
Atractylon inhibits the tumorigenesis of glioblastoma through SIRT3 signaling.Am J Cancer Res. 2022 May 15;12(5):2310-2322. eCollection 2022. Am J Cancer Res. 2022. PMID: 35693089 Free PMC article.
References
-
- Waalkes MP. Cadmium carcinogenesis. Mutat Res 2003; 533:107-20; PMID:14643415; http://dx.doi.org/10.1016/j.mrfmmm.2003.07.011 - DOI - PubMed
-
- Satarug S, Baker JR, Urbenjapol S, Haswell-Elkins M, Reilly PE, Williams DJ, Moore MR. A global perspective on cadmium pollution and toxicity in non-occupationally exposed population. Toxicol Lett 2003; 137:65-83; PMID:12505433; http://dx.doi.org/10.1016/S0378-4274(02)00381-8 - DOI - PubMed
-
- Perlman GD, Berman L, Leann K, Bing L. Agency for toxic substances and disease registry brownfields/ land-reuse site tool. J Environ Health 2012; 75:30-4; PMID:23270111 - PubMed
-
- Huang J, Okuka M, McLean M, Keefe DL, Liu L. Telomere susceptibility to cigarette smoke-induced oxidative damage and chromosomal instability of mouse embryos in vitro. Free Radic Biol Med 2010; 48:1663-76; PMID:20381605; http://dx.doi.org/10.1016/j.freeradbiomed.2010.03.026 - DOI - PubMed
-
- Larson C. ENVIRONMENTAL SCIENCE China gets serious about its pollutant-laden soil. Science 2014; 343:1415-6; PMID:24675928; http://dx.doi.org/10.1126/science.343.6178.1415 - DOI - PubMed
Publication types
MeSH terms
Substances
LinkOut - more resources
Full Text Sources
Other Literature Sources
Research Materials
Miscellaneous
