. 2015 Jun 26:15:60.
doi: 10.1186/s12896-015-0169-1.

SH2-PLA: a sensitive in-solution approach for quantification of modular domain binding by proximity ligation and real-time PCR

Affiliations

SH2-PLA: a sensitive in-solution approach for quantification of modular domain binding by proximity ligation and real-time PCR

Christopher M Thompson et al. BMC Biotechnol. .

Abstract

Background: There is a great interest in studying phosphotyrosine dependent protein-protein interactions in tyrosine kinase pathways that play a critical role in many aspects of cellular function. We previously established SH2 profiling, a phosphoproteomic approach based on membrane binding assays that utilizes purified Src Homology 2 (SH2) domains as a molecular tool to profile the global tyrosine phosphorylation state of cells. However, in order to use this method to investigate SH2 binding sites on a specific target in cell lysate, additional procedures such as pull-down or immunoprecipitation which consume large amounts of sample are required.

Results: We have developed PLA-SH2, an alternative in-solution modular domain binding assay that takes advantage of Proximity Ligation Assay and real-time PCR. The SH2-PLA assay utilizes oligonucleotide-conjugated anti-GST and anti-EGFR antibodies recognizing a GST-SH2 probe and cellular EGFR, respectively. If the GST-SH2 and EGFR are in close proximity as a result of SH2-phosphotyrosine interactions, the two oligonucleotides are brought within a suitable distance for ligation to occur, allowing for efficient complex amplification via real-time PCR. The assay detected signal across at least 3 orders of magnitude of lysate input with a linear range spanning 1-2 orders and a low femtomole limit of detection for EGFR phosphotyrosine. SH2 binding kinetics determined by PLA-SH2 showed good agreement with established far-Western analyses for A431 and Cos1 cells stimulated with EGF at various times and doses. Further, we showed that PLA-SH2 can survey lung cancer tissues using 1 μl lysate without requiring phospho-enrichment.

Conclusions: We showed for the first time that interactions between SH2 domain probes and EGFR in cell lysate can be determined in a microliter-scale assay using SH2-PLA. The obvious benefit of this method is that the low sample requirement allows detection of SH2 binding in samples which are difficult to analyze using traditional protein interaction assays. This feature along with short assay runtime makes this method a useful platform for the development of high throughput assays to determine modular domain-ligand interactions which could have wide-ranging applications in both basic and translational cancer research.


Figures
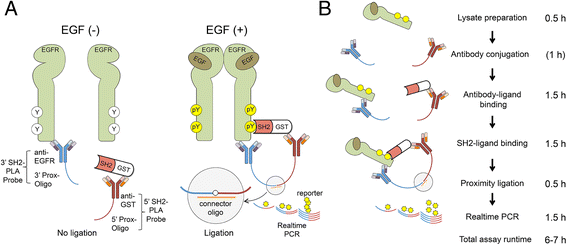
Fig. 1
Fig. 1
In-solution SH2 domain binding assay using proximity ligation and real-time PCR. a , Schematic Illustration of SH2-PLA. A pair of PLA probes is used to detect the interaction of tyrosine phosphorylated EGFR and a GST-SH2 domain. The 3′ SH2-PLA probe consists of an anti-EGFR antibody conjugated with the 3′ proximity oligonucleotide (3′ Prox-Oligo). The 5′ SH2-PLA probes consists of an anti-GST antibody conjugated with the 5′ Prox-Oligo and a GST-SH2 domain. When the GST-SH2 domain binds to tyrosine phosphorylation sites of EGFR, the 5′ and 3′ PLA probes are brought in close proximity, allowing ligation of the two Prox-Oligos which is detectable by real-time PCR. b , Experimental workflow of SH2-PLA Method 1. Lysates are prepared with or without EGF stimulation. Biotinylated anti-GST and anti-EGFR antibodies are conjugated with the 5′ and 3′ Prox-Oligos, respectively, and stored at −20 °C. The 5′ SH2-PLA probe is mixed with purified GST-SH2, and the 3′ SH2-PLA probe is mixed with cell lysates allowing the antibodies to bind their respective epitopes. Subsequently, the 5′ and 3′ PLA probe solutions are combined to induce interaction between the SH2 and pEGFR. Then, the amount of the complex is quantified by proximity ligation and real-time PCR. An alternative method is also possible (Additional file 1: Figure S2). Estimated assay runtime including sample-handling steps for each procedure is noted on the right
Fig. 2
Fig. 2
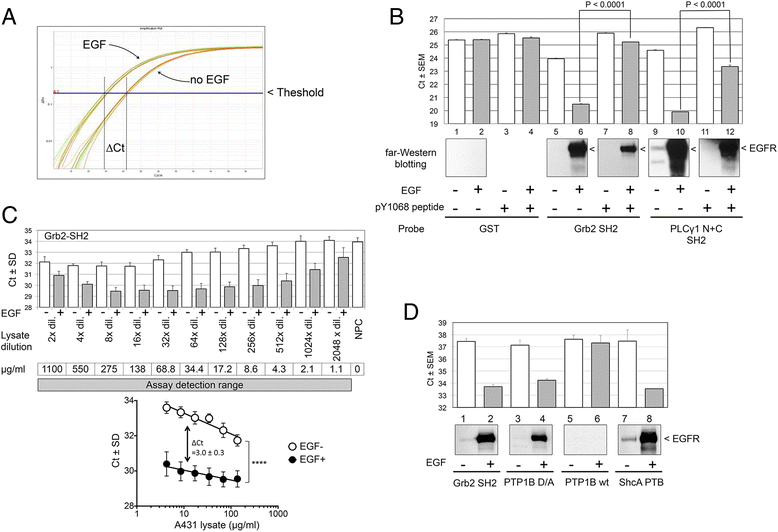
Validation of the SH2-PLA assay. a , Representative PCR amplification plot for SH2-PLA experiments. Increased binding between SH2 and pEGFR upon EGF stimulation is expressed as a reduced threshold cycle value (Ct). Here, ∆Ct is defined as [Ctcontrol – CtEGF stimulated]. b, Specificity of SH2-PLA. SH2-PLA (top panel) and far-Western (middle panel) results for EGF-stimulated and control A431 cell samples are shown. Results for GST control probe are shown in lanes 1–4; Grb2 SH2 probe in lanes 5–8; and PLCγ1 tandem SH2 probe in lanes 9–12. Lanes 3, 4, 7, 8, 11, and 12 show the assay result in the presence of pY1068 blocking peptide, which contains the Grb2 SH2 consensus binding site of EGFR. c , SH2-PLA assay performance. The SH2-PLA assay was performed three times using a two fold dilution series of EGF-stimulated and control A431 cell lysates. Average Ct values, normalized to non protein control (NPC), are shown in the upper panel. The intra-assay variation for Ct values was 0.07-2.36 (mean 0.60) and the inter-assay %CV was 0.32-3.08 (mean 1.28). Since EGF-stimulated samples always showed a greater signal (lower Ct) than the unstimulated control throughout the dilution series, the range of assay detection is estimated to be at least 1.1–1100 μg/ml of lysate concentration, and the lower limit of detection is approximately 2 ng of protein per assay. The lower panel shows the approximately linear region of the mean Ct plot against log input lysate concentrations, and the ∆Ct (unstimulated – stimulated) of about three cycles. The log2 fold change between EGF-stimulated and control samples was estimated to be 6.0 - 6.4 using the ProteinAssist software tool (Additional file 1: Figure S3). d, Adoption of other phosphotyrosine recognizing domains. The SH2-PLA methodology was applied to protein tyrosine phosphatase (PTP) and phosphotyrosine binding (PTB) domains. ShcA PTB domain and the substrate-trapping mutant of PTP1B PTP domain displayed activity comparable to Grb2 SH2 (lanes 1–4 and 7–8). Signal was undetectable for the wild type (wt) PTP1B PTP domain, likely due to the intrinsic phosphatase activity (lanes 5–6)
Fig. 3
Fig. 3
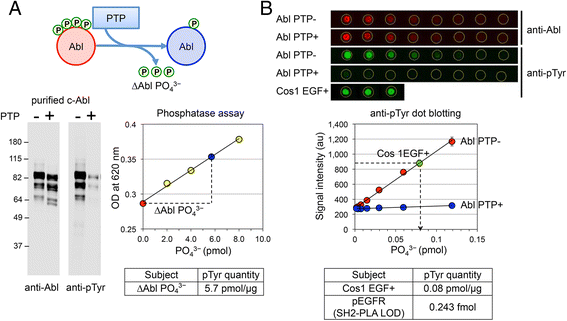
Estimation of EGFR phosphotyrosines at the limit of detection. To define an absolute lower limit of detection (LOD) for SH2-PLA, the total amount of EGFR phosphotyrosines in sample cell lysate was estimated using a phosphotyrosine standard sample and quantitative dot blotting analyses. a, Recombinant c-Abl protein, the pTyr-standard sample, was treated with tyrosine specific phosphatases PTP1B and TC-PTP. The amount of hydrolyzed phosphotyrosine was quantified by malachite green phosphatase assay (∆Abl PO4 3−). Left panel shows anti-Abl and anti-phosphotyrosine blots for phosphatase-treated (Abl PTP+) and -untreated (Abl PTP-) samples. After the PTP treatment, the level of c-Abl tyrosine phosphorylation was greatly reduced but weak phosphorylation was still detectable with longer exposure time. The right panel shows a plot of the phosphate standard used for the quantification. Red circle, untreated c-Abl; blue circle, PTP-treated c-Abl; yellow circles, the kit supplied phosphate standard. From this analysis, ∆Abl PO4 3 was estimated to be 5.7 pmol per μg of the c-Abl protein. b , Quantitative dot blotting. The total pTyr in the EGF-stimulated Cos1 cell lysate was estimated from a pTyr standard curve generated from anti-phosphotyrosine dot blotting. Upper panel shows raw anti-Abl and anti-pTyr blots. Serially diluted c-Abl pTyr standard (left to right 3.1–0.02 ng per spot) and 0.01 μg EGF-stimulated Cos1 samples were spotted on nitrocellulose membrane (performed in triplicate). The middle panel shows the resulting pTyr standard plot with the quantified signal intensities. The pTyr amount in the EGF-stimulated Cos1 lysate was estimated to be 0.08 pmol per μg lysate. Subsequently, an anti-pTyr Western analysis for A431 and Cos1 samples was performed, relative intensities of the EGFR bands were calculated, and the amount of EGFR pTyr in the EGF-stimulated A431 sample was estimated to be 0.122 pmol/μg. Thus 2 ng of EGF-stimulated A431 sample, which is the lower limit for SH2-PLA detection, would contain 0.243 femtomole EGFR pTyr. See Methods and Additional file 1: Figure S4 for more information
Fig. 4
Fig. 4
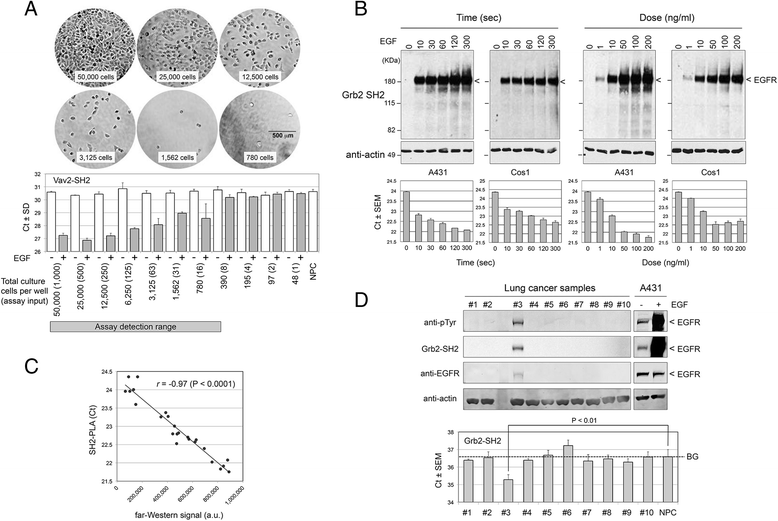
Applications of SH2-PLA assay. a, Practical limit of detection from cell culture. Two-fold serial dilutions of A431 cells were seeded to wells in a 96-well plate. Image series shows various 10x magnifications of diluted A431 cells with cell number indicated. Vav2 SH2:pEGFR interaction of starved or EGF-stimulated cell lysates was quantified by the SH2-PLA assay to resolve the assay detection limit. The Ct values from real-time PCR are shown with approximate numbers of cells per culture well or per assay (in brackets) underneath the chart. b , Time course and dose response of EGF stimulation. A431 and Cos1 cells were starved and stimulated with EGF at various times and concentrations as indicated. Upper panel shows far-Western blotting with Grb2 SH2 (25 μg lysate loaded per lane) and control blotting with anti-actin. Bottom panel shows Ct values of comparable SH2-PLA experiments loading 0.4 μg lysate per assay well. c , Correlation between far-Western and SH2-PLA assay. Using experimental results shown in B, EGFR band intensities of far-Western blot (X-axis) and average Ct values of SH2-PLA (Y-axis) in panel B were plotted and showed strong correlation. a.u., arbitrary unit; r, Pearson correlation coefficient. d , Application of SH2-PLA for cancer tissue analysis. The SH2-PLA/Western/far-Western analyses were performed using 10 lung cancer tissue samples. Upper panel shows Western and far-Western results with antibody/probe names indicated on the left. Only one sample (#3) shows an EGFR size band which also overlapped with bands detected by anti-pTyr and Grb2 SH2 (far-Western image represents 60-min exposure). The tyrosine phosphorylation level of the band is similar to the weak phosphorylation of EGFR in unstimulated A431 cells (right panel). The PLA-SH2 results for the same set of lung cancer samples are shown on the bottom. Consistent with the Grb2 far-Western result, only sample #3 had significant signal beyond the no protein control (NPC). The BG line indicates the background Ct value

Similar articles

Cited by

References

    1. Yaffe MB. Phosphotyrosine-binding domains in signal transduction. Nat Rev Mol Cell Biol. 2002;3(3):177–86. doi: 10.1038/nrm759. - DOI - PubMed
    1. Kaneko T, Joshi R, Feller SM, Li SS. Phosphotyrosine recognition domains: the typical, the atypical and the versatile. Cell Commun Signal. 2012;10(1):32. doi: 10.1186/1478-811X-10-32. - DOI - PMC - PubMed
    1. Liu BA, Jablonowski K, Raina M, Arce M, Pawson T, Nash PD. The human and mouse complement of SH2 domain proteins-establishing the boundaries of phosphotyrosine signaling. Mol Cell. 2006;22(6):851–68. doi: 10.1016/j.molcel.2006.06.001. - DOI - PubMed
    1. Machida K, Mayer BJ. The SH2 domain: versatile signaling module and pharmaceutical target. Biochim Biophys Acta. 2005;1747(1):1–25. doi: 10.1016/j.bbapap.2004.10.005. - DOI - PubMed
    1. Schweigel H, Geiger J, Beck F, Buhs S, Gerull H, Walter U, et al. Deciphering of ADP-induced, phosphotyrosine-dependent signaling networks in human platelets by Src-homology 2 region (SH2)-profiling. Proteomics. 2013;13(6):1016–27. doi: 10.1002/pmic.201200353. - DOI - PubMed

Publication types

MeSH terms