Review
. 2015 Jul;95(3):853-951.
doi: 10.1152/physrev.00023.2014.

Neuronal Reward and Decision Signals: From Theories to Data

Affiliations
Review

Neuronal Reward and Decision Signals: From Theories to Data

Wolfram Schultz. Physiol Rev. 2015 Jul.

Abstract

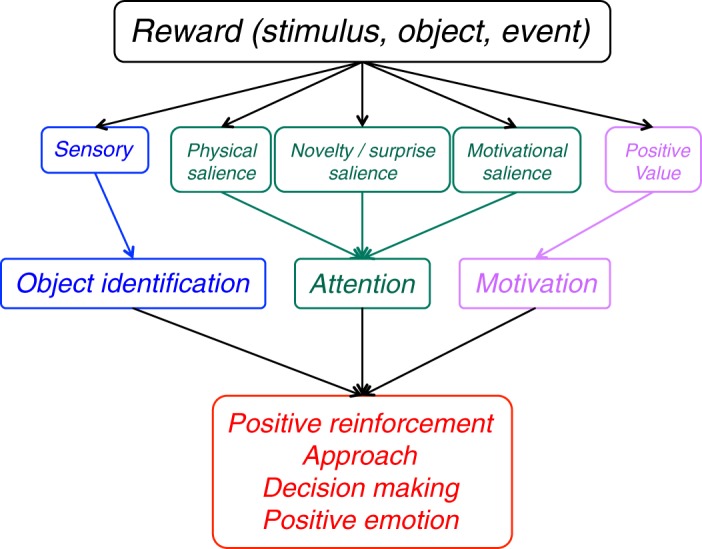
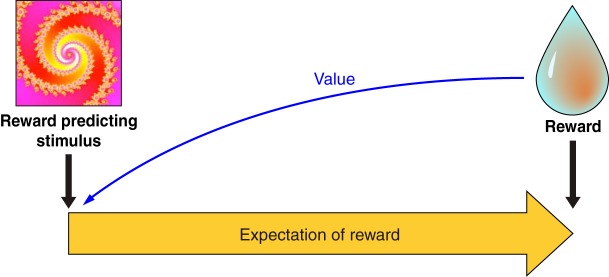
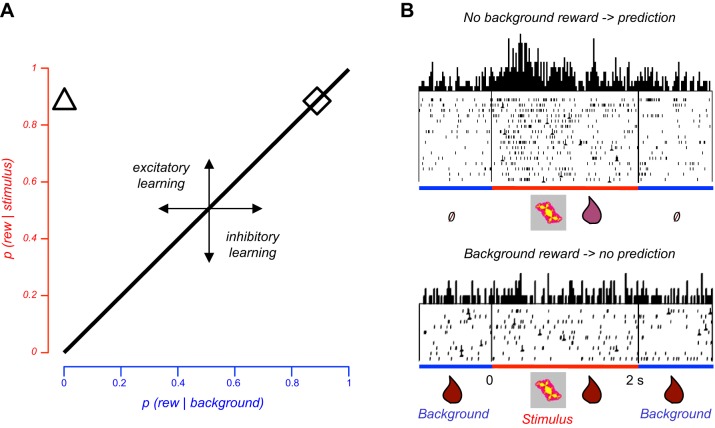
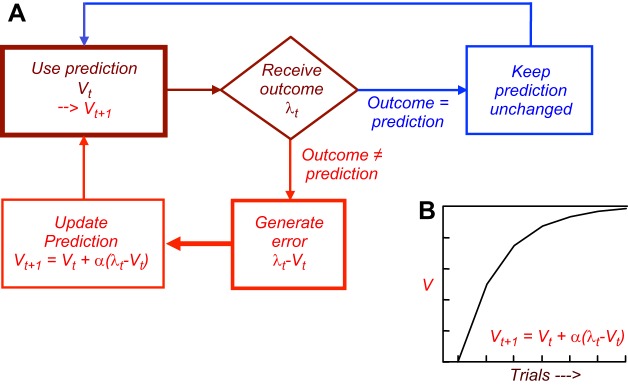
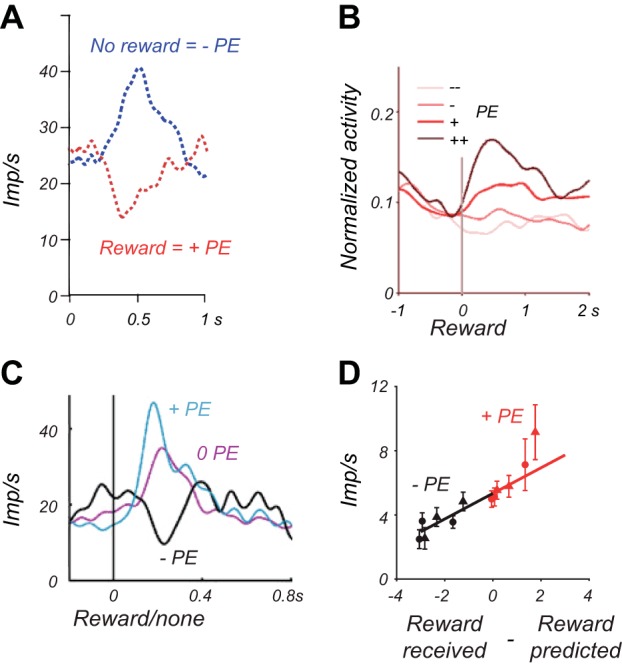
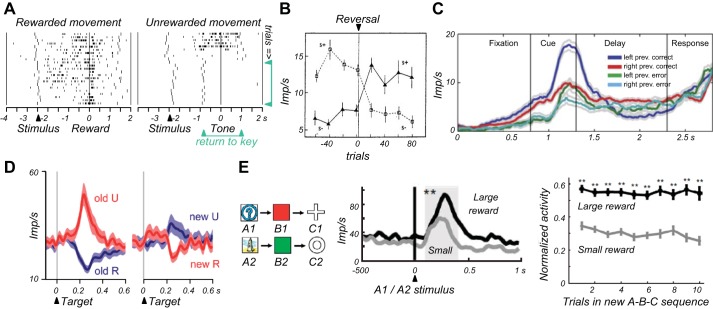
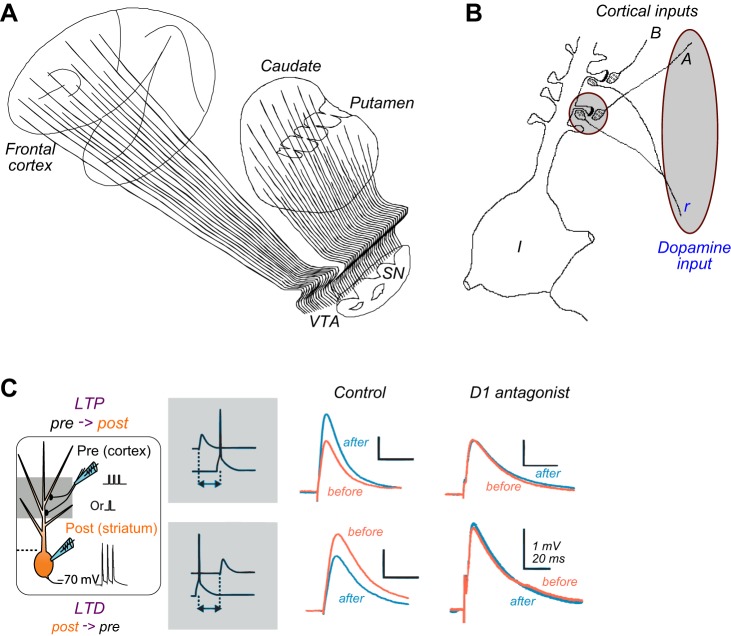
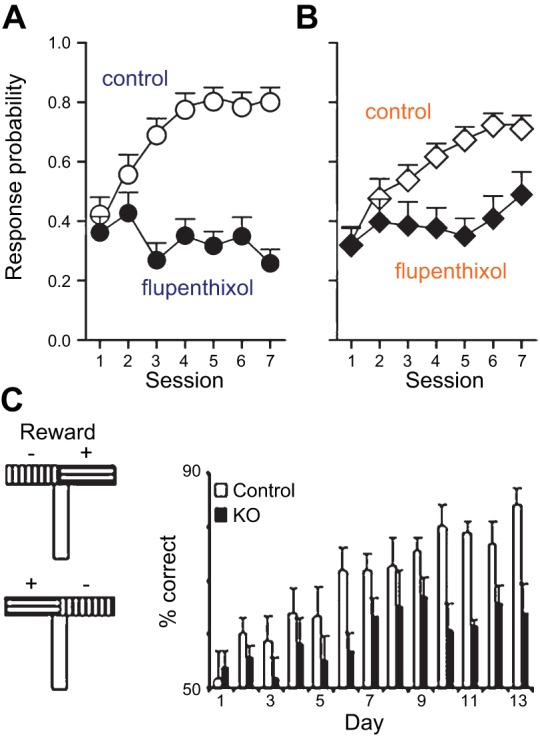
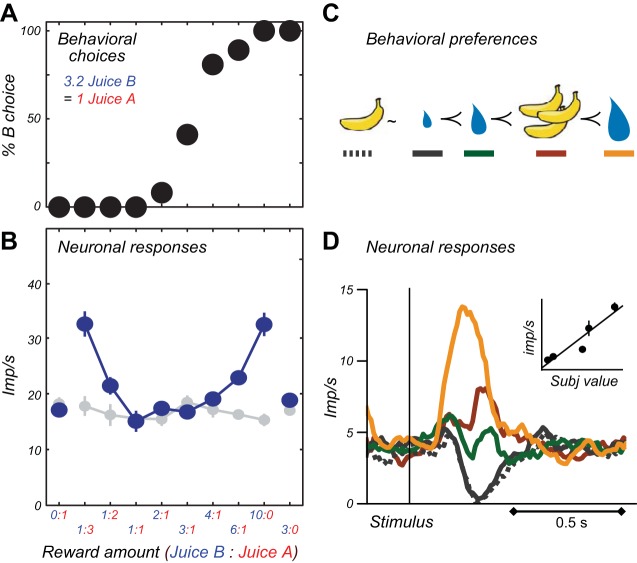
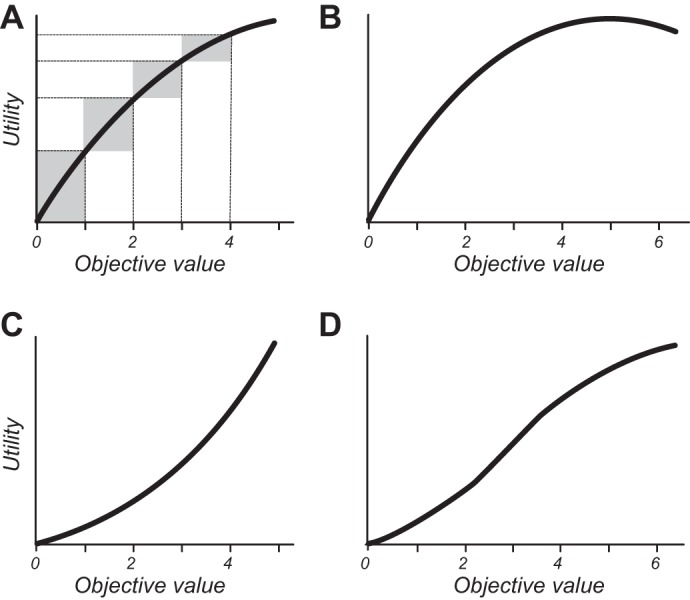
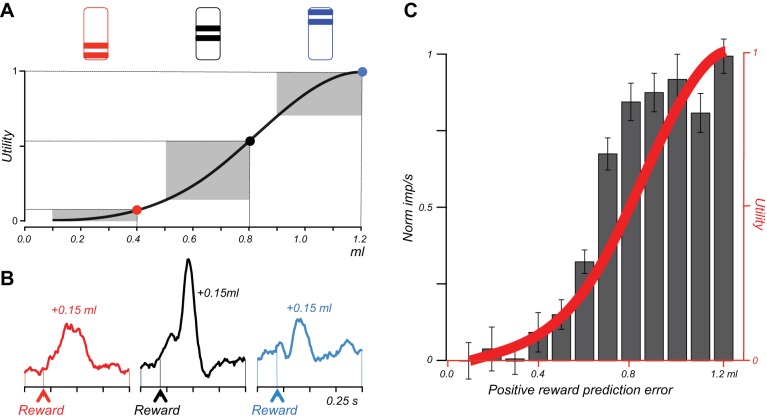
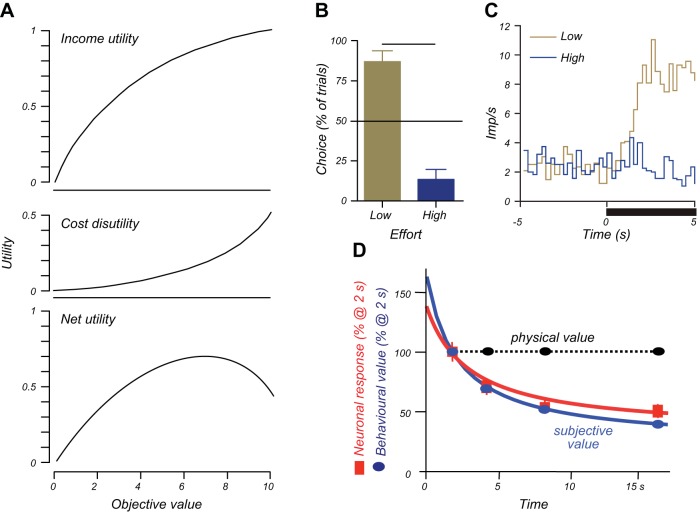
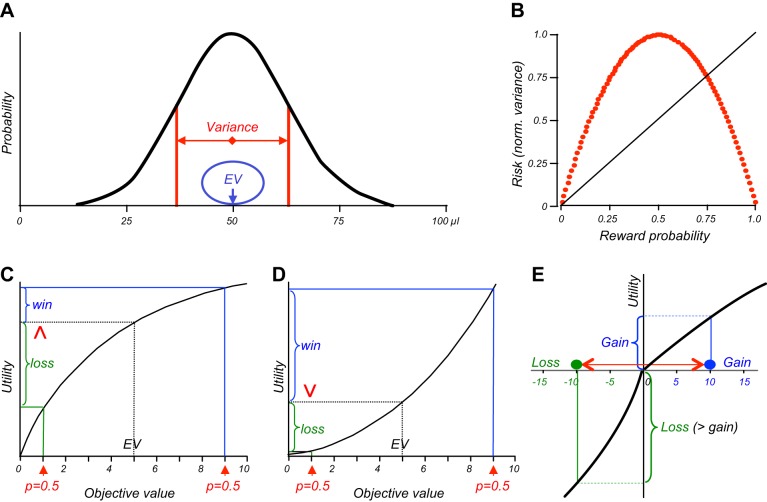
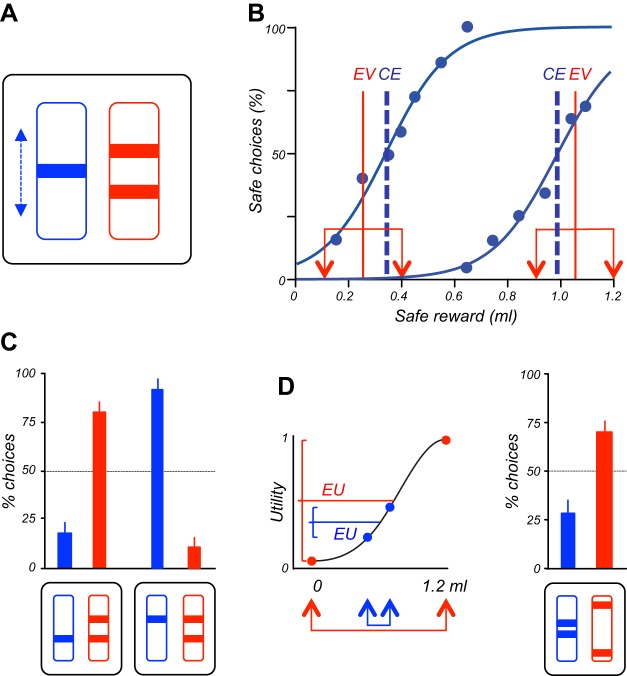
Rewards are crucial objects that induce learning, approach behavior, choices, and emotions. Whereas emotions are difficult to investigate in animals, the learning function is mediated by neuronal reward prediction error signals which implement basic constructs of reinforcement learning theory. These signals are found in dopamine neurons, which emit a global reward signal to striatum and frontal cortex, and in specific neurons in striatum, amygdala, and frontal cortex projecting to select neuronal populations. The approach and choice functions involve subjective value, which is objectively assessed by behavioral choices eliciting internal, subjective reward preferences. Utility is the formal mathematical characterization of subjective value and a prime decision variable in economic choice theory. It is coded as utility prediction error by phasic dopamine responses. Utility can incorporate various influences, including risk, delay, effort, and social interaction. Appropriate for formal decision mechanisms, rewards are coded as object value, action value, difference value, and chosen value by specific neurons. Although all reward, reinforcement, and decision variables are theoretical constructs, their neuronal signals constitute measurable physical implementations and as such confirm the validity of these concepts. The neuronal reward signals provide guidance for behavior while constraining the free will to act.


Figures

FIGURE 1.
FIGURE 1.
Reward components and their functions. The sensory component reflects the impact of environmental stimuli, objects, and events on the organism (blue). Pleasurable activities and situations belong also in this sensory component. The three salience components elicting attentional responses (green) derive from the physical impact (left), novelty (middle), and commonly from reward and punishment (right). The specific positively motivating function of rewards derives from the value component (pink). Value does not primarily reflect physical parameters but the brain's subjective assessment of the usefulness of rewards for survival and reproduction. These reward components are either external (sensory, physical salience) or internal (generated by the brain; value, novelty/surprise salience, motivational salience). All five components together ensure adequate reward function.
FIGURE 2.
FIGURE 2.
Subjective esthetic reward value derived from objective physical properties. The beauty of the Canaletto picture depends on the Golden Ratio of horizontal proportions, defined as (a + b)/a = a/b ∼ 0.618; a and b for width of image. The importance of geometric asymmetry becomes evident when covering the left part of the image until the distant end of the canal becomes the center of the image: this increases image symmetry and visibly reduces beauty. However, there is no intrinsic reason why physical asymmetry would induce subjective value: the beauty appears only in the eye of the beholder. (Canaletto: The Upper Reaches of the Grand Canal in Venice, 1738; National Gallery, London.)
FIGURE 3.
FIGURE 3.
Principal brain structures for reward and decision-making. Dark blue: main structures containing various neuronal subpopulations coding reward without sensory stimulus or motor action parameters (“explicit reward signals”). Light blue: structures coding reward in conjunction with sensory stimulus or motor action parameters. Maroon: non-reward structures. Other brain structures with explicit or conjoint reward signals are omitted for clarity.
FIGURE 4.
FIGURE 4.
Pavlovian reward prediction. With conditioning, an arbitrary stimulus becomes a reward predictor and elicits an internal expectation of reward. Some of the behavioral reactions typical for reward occur also after the stimulus (Pavlovian stimulus substitution), in particular approach behavior, indicating that the stimulus has acquired reward value (blue arrow).
FIGURE 5.
FIGURE 5.
Reward contingency. A: role of contingency in learning. Contingency is shown as reward difference between stimulus presence and absence (background). Abscissa and ordinate indicate conditional reward probabilities. Higher reward probability in the presence of the stimulus compared with its absence (background) induces positive conditioning (positive contingency, triangle). No learning occurs with equal reward probabilities between stimulus and background (diagonal line, rhombus). Reward contingency applies to Pavlovian conditioning (shown here; reward contingent on stimulus) and operant conditioning (reward contingent on action). [Graph inspired by Dickinson (132).] B: contingency-dependent response in single monkey amygdala neuron. Top: neuronal response to conditioned stimulus (reward P = 0.9; red) set against low background reward probability (P = 0.0; blue) (triangle in A). Bottom: lack of response to same stimulus paired with same reward (P = 0.9) when background produces same reward probability (P = 0.9) (rhombus in A) which sets reward contingency to 0 and renders the stimulus uninformative. Thus the neuronal response to the reward-predicting stimulus depends entirely on the background reward and thus reflects reward contingency rather than stimulus-reward pairing. A similar drop in neuronal responses occurs with comparable variation in reward magnitude instead of probability (41). Perievent time histograms of neuronal impulses are shown above raster displays in which each dot denotes the time of a neuronal impulse relative to a reference event (stimulus onset, time = 0, vertical line at left; line to right indicates stimulus offset). [From Bermudez and Schultz (41).]
FIGURE 6.
FIGURE 6.
Learning with prediction errors. A: feedback circuit diagram for prediction updating by error. An error is generated when outcome (reward, punisher) differs from its prediction. In Pavlovian conditioning, a prediction error after an outcome change leads to prediction updating which leads to a behavioral change. In operant conditioning, a prediction error after an outcome change leads to a behavioral change which leads to prediction updating. In contrast, no prediction error is generated when the outcome matches the prediction, and behavior remains unchanged. V is reward prediction, λ is reward, α is learning rate, and t is trial. B: typical learning curve, generated by gradually declining prediction errors [λ(t) − V(t)].
FIGURE 7.
FIGURE 7.
Dopamine prediction error responses at the time of reward in monkeys. A: dopamine responses to touch of food without any phasic stimuli predicting the reward. The food inside the box is invisible but is touched by the hand underneath the cover. Movement onset is defined as release of resting key. B: differential response to touch of a piece of apple (top) but not to touch of a bare wire (bottom) or known inedible objects. Left graphs show the animal's hand entering the covered food box. Inside the box, touch of a bare wire or a wire holding the food elicits an electric signal for temporal reference (vertical line at right). [A and B from Romo and Schultz (491), with kind permission from Springer Science and Business Media.] C: reward prediction error responses at time of reward (right) and reward-predicting visual stimuli (left in 2 bottom graphs). The dopamine neuron is activated by the unpredicted reward eliciting a positive reward prediction error (blue + error, top), shows no response to the fully predicted reward eliciting no prediction error (0 error, middle), and is depressed by the omission of predicted reward eliciting a negative prediction error (- errror, bottom). [From Schultz et al. (524).] D: reward prediction error responses at time of reward satisfy stringent prediction error tests. Top: blocking test: lack of response to reward absence following the stimulus that was blocked from learning (left), but activation by surprising reward after blocked stimulus (right). [From Waelti et al. (618).] Bottom: conditioned inhibition test. Supranormal activation to reward following an inhibitory stimulus explicitly predicting no reward. [From Tobler et al. (597).]
FIGURE 8.
FIGURE 8.
Dopamine responses to conditioned stimuli in monkeys. A: stimulus responses of a single dopamine neuron during a blocking test. A pretrained stimulus predicts liquid reward and induces a standard dopamine response (top). During compound training, a test stimulus is shown together with the pretrained stimulus while keeping the reward unchanged (middle left). Thus the reward is fully predicted by the pretrained stimulus, no prediction error occurs, and the test stimulus is blocked from learning a reward prediction. Correspondingly, the test stimulus alone fails to induce a dopamine response (bottom). [From Waelti et al. (618).] B: stimulus responses of a single dopamine neuron during a conditioned inhibition test. The reward normally occurring with the pretrained stimulus (top) fails to occur during compound training with a test stimulus (middle left). This procedure makes the test stimulus a predictor of no reward which correspondingly induces a dopamine depression (bottom). [From Tobler et al. (597).] C: stepwise transfer of dopamine response from reward to first reward-predicting stimulus, corresponding to higher order conditioning conceptualized by temporal difference (TD) model. CS2: instruction, CS1: movement releasing (trigger) stimulus in delayed response task. [From Schultz et al. (521).] D: reward prediction error responses closely parallel prediction errors of formal TD model. Left: sequential movement-reward task. One or two stimuli (white N1, N2) precede the movements leading to reward (orange, 1st, 2nd, 3rd). Right: averaged population responses of 26 dopamine neurons at each sequence step (gray bars, numbers indicate reward probabilities in %) and time course of modeled prediction errors {[λ(t) + γ∑V(t)] − V(t − 1)} (black line). [From Enomoto et al. (144).] E: dopamine prediction error responses reflect model-based reward prediction derived from temporal task structure. The model specifies an increase in conditional reward probability P(reward | no reward yet) from initial P = 0.0625 to P = 1.0 after six unrewarded trials. Correspondingly, positive prediction errors with reward occurrence decrease across successive trials, and negative errors with reward omission increase. Averaged population responses of 32 dopamine neurons show similar temporal profiles (blue and red, as impulses/s above neuronal background activity). [From Nakahara et al. (382), with permission from Elsevier.]
FIGURE 9.
FIGURE 9.
Two components of phasic dopamine responses. A: averaged population responses of 69 monkey dopamine neurons to conditioned stimuli (CS) predicting reward (gray) and no reward (black). Note the initial indiscriminate detection response component (blue) and the subsequent reward response component distinguishing between reward and no reward prediction (red). [From Tobler et al. (597).] B: averaged population responses of 54 monkey dopamine neurons to conditioned stimuli (CS) predicting rewards at different delays (2, 4, 8, and 16 s; brown, green, orange, and blue, respectively). The value reduction due to temporal discounting affects only the second, reward prediction error component (red). [From Kobayashi and Schultz (285).] C: differentiation of dopamine response into initial detection response and subsequent prediction error response. Increasing motion coherence (from 0 to 50%) improves binary dot motion discrimination and translates into increasing reward probability (from P = 0.49 to P = 0.99). The first response component is nondifferentially constant (blue), whereas the second component grows with increasing reward value (derived from probability, bottom to top, red). [From Nomoto et al. (389).] D: accurate value coding at time of reward despite initial indiscriminate stimulus detection response. After the unrewarded conditioned stimulus (CS-), surprising reward (R) elicits a positive prediction error response (top), whereas predicted reward absence (noR) fails to elicit a negative error response (bottom). [From Waelti et al. (618).]
FIGURE 10.
FIGURE 10.
Four factors influencing the detection component of phasic dopamine responses. A: detection response generated by sensory impact, conferring physical salience. Louder, nonaversive sounds with higher physical salience generate stronger activations (72 and 90 dB, respectively; behavioral choice preferences demonstrated their nonaversive nature). Averaged population responses measured as impulses/s (imp/s) of 14 and 31 monkey dopamine neurons, respectively. [From Fiorillo et al. (160).] B: detection response, and possibly also second response component, enhanced by stimulus novelty, conferring novelty or surprise salience. Stimulus novelty itself is not sufficient to induce dopamine activations, as shown by response absence with small stimuli (horizontal line), but enhances detection response when stimuli are physically larger and more salient (vertical axis). Neuronal responses wane with stimulus repetition due to loss of novelty and increase again with conditioning to reward (from left to right). [Composite scheme from Schultz (517), derived from original data (221, 597, 618).] C: detection response enhanced by generalization to rewarded stimuli. Blue: minor population response to conditioned visual aversive stimulus alternating with auditory reward-predicting stimulus (REW auditory) (active avoidance task). Red: substantial activation to identical visual aversive stimulus when the alternate reward-predicting stimulus is also visual (REW visual), a situation more prone to stimulus generalization. As control, both auditory and visual reward-predicting stimuli induce typical dopamine activations (not shown). [From Mirenowicz and Schultz (366).] D: detection response enhanced by reward context. Left (separate contexts): minor dopamine population activations induced by unrewarded big and small pictures when non-reward context is well separated from reward context by testing in separate trial blocks, using distinct background pictures and removing liquid spout in picture trials. Right (common reward context): major activations by same unrewarded pictures without separation between non-reward and reward context. [From Kobayashi and Schultz (286).]
FIGURE 11.
FIGURE 11.
No aversive coding in monkey dopamine activations. A: psychophysical assessment of aversiveness of bitter solution (denatonium) as prerequisite for investigating quantitative neuronal processing of aversiveness. Monkey chose between single juice reward and juice reward + denatonium (top). The blue and black psychophysics curves show that increasing the volume of single juice reward induces more frequent choices of this reward against constant alternative juice + denatonium. Aversiveness of denatonium is expressed as difference between volume of single juice and juice together with denatonium at choice indifference (50% choice). Thus 1 mM denatonium is worth −100 μl of juice (black), and 10 mM denatonium is worth −180 μl (blue). The x-axis shows volume of single juice, and y-axis shows percent of choices of single juice. B: inverse relationship of neuronal activations to psychophysically quantified aversiveness of bitter solutions (behavioral method shown in A). N = number of neurons. Imp/s indicate firing rate. C: development of behavioral aversiveness of solutions within individual test days, as assessed with method shown in A. Liquid solutions of salt or bitter molecules lose reward value through gradual satiation and thus become increasingly aversive (thirsty monkeys work for mildly “aversive” saline solutions, and thus find them rewarding, as outcome value is dominated by liquid over salt). D: decreasing dopamine activations with increasing aversiveness of saline solution within individual test days (behavioral aversiveness assessment shown in C), suggesting subtraction of negative aversive value from gradually declining juice value due to satiation. [A–D are from Fiorillo et al. (160).]
FIGURE 12.
FIGURE 12.
Reward components inducing the two phasic dopamine response components. The initial component (blue) detects the event before having identified its value. It increases with sensory impact (physical salience), novelty (novelty/surprise salience), generalization to rewarded stimuli, and reward context. This component is coded as temporal event prediction error (389). The second component (red) codes reward value (as reward prediction error).
FIGURE 13.
FIGURE 13.
Dopamine prediction error responses reflect changing reward prediction during learning. A: stepwise learning of spatial delayed response task via intermediate spatial subtasks. Each dot shows mean percentage of correct behavioral performance in 20–30 trials during learning (red) and asymptotic performance (blue). B: positive dopamine reward prediction error responses during learning of each subtask, and their disappearance during acquired performance. Each histogram shows averaged responses from 10–35 monkey dopamine neurons recorded during the behavior shown in A. [A and B from Schultz et al. (521).] C: behavioral learning and performance of temporal difference model using the dopamine prediction error signals shown in B. The slower model learning compared with the animal's learning of the final delayed response task is due to a single step increase of delay from 1 to 3 s in the model, whereas the delay increased gradually in animals (A). [From Suri and Schultz (573), with permission from Elsevier.]
FIGURE 14.
FIGURE 14.
Plasticity of dopamine reward prediction error responses. A: transfer of dopamine response from primary reward to conditioned, reward-predicting stimulus during learning. The plots show voltammetrically measured dopamine concentration changes in ventral striatum of rats. Note simultaneous occurrence of responses to reward and stimulus during intermediate learning stage. [From Stuber et al. (598). Reprinted with permission from AAAS.] B: stimulus eligibility traces linking reward to stimulus during learning in original formulation of temporal difference model (TD) model. [Redrawn from Sutton and Barto (574).] C: stimulus eligibility traces used in biologically plausible implementation of TD model of dopamine prediction error responses. The traces allow single step transfer of dopamine prediction error signal from reward to an earlier stimulus. D: transfer of modeled dopamine prediction error response from reward to conditioned stimulus using eligibility traces shown in B and C. [C and D from Suri and Schultz (573), with permission from Elsevier.] E: time-sensitive plasticity of dopamine neurons in rat midbrain slices. LTP induction depends on timing of burst stimulation of dopamine neurons relative to their synaptic excitation. Only bursts occurring 0.5–1.5 s after synaptic stimulation lead to measurable LTP (excitatory postsynaptic currents, EPSC, mediated by NMDA receptors). [From Harnett et al. (203), with permission from Elsevier.]
FIGURE 15.
FIGURE 15.
Bidirectional non-dopamine reward prediction error signals. A: averaged responses from 43 neurons in monkey lateral habenula during first trial of position-reward reversals. Red: positive prediction error; blue: negative prediction error. Note the inverse response polarity compared with dopamine error responses. PE = prediction error. [From Matsumoto and Hikosaka (344). Reprinted with permission from Nature Publishing Group.] B: averaged responses from 8 neurons in rat striatum. Subjective reward values (tiny, small, large, huge) are estimated by a Rescorla-Wagner reinforcement model fit to behavioral choices. [From Kim et al. (275).] C: response of single neuron in monkey amygdala. [From Belova et al. (36), with permission from Elsevier.] D: response of single neuron in monkey supplementary eye field. [From So and Stuphorn (551).]
FIGURE 16.
FIGURE 16.
Overview of reward learning-related responses in monkey non-dopamine neurons. A: adaptation of reward expectation in single ventral striatum neuron during learning. In each learning episode, two new visual stimuli instruct a rewarded and an unrewarded arm movement, respectively, involving the acquisition of differential reward expectations for the same movement. Reward expectation is indicated by the return of the animal's hand to the resting key. This occurs with all rewarded movements after reward delivery (long vertical markers in left rasters, right to reward). With unrewarded movements, which alternate pseudorandomly with rewarded movement trials, the return occurs in initial trials after the tone (top right) but subsequently jumps before the tone (green arrows), indicating initial default reward expectation that disappears with learning. The reward expectation-related neuronal activity shows a similar development during learning (from top to bottom). [From Tremblay et al. (600).] B: rapid reversal of stimulus response in orbitofrontal neuron with reversed stimulus-reward association. S+ and S− are two different visual stimuli that are initially rewarded and unrewarded, respectivey. With reversal, they stay physically constant but inverse their reward prediction. [From Rolls et al. (485).] C: cue response in dorsolateral prefrontal cortex neuron reflecting correct, as opposed to erroneous, performance in previous trial in a delayed conditional motor task with reversal. This typical prefrontal neuron discriminates between left and right movements. Errors reduce differential left-right movement-related activity (previous trial correct: blue and red vs. error: green and blue). [From Histed et al. (217), with permission from Elsevier.] D: inference-related reversal of neuronal population responses in lateral habenula. These neurons are activated by unrewarded targets and depressed by rewarded targets. Left: in the first trial after target-reward reversal, before any new outcome occurs, the neurons continue to show activation to the old unrewarded target (red, old U) and depression to the old rewarded target (blue, old R). Right: in the second trial after reversal, after having experienced one outcome, the neuronal responses reflect the reward association of the other target. Thus the neurons are activated by the newly unrewarded target (blue, new U) and depressed by the newly rewarded target (red, new R), based entirely on inference from the outcome of only one target. [From Bromberg-Martin et al. (68).] E: inference of reward value from differentially rewarded paired associates in prefrontal cortex. Monkeys are first trained with two complete A-B-C sequences (left). Then, before the first trial of a new sequence, the two C stimuli are followed by large and small reward, respectively. For testing, the animal is presented with an A stimulus and choses the corresponding B and then C stimuli from the first new sequence trial on, even before sequential A-B-C-reward conditioning could occur. Neurons show corresponding reward differential activity (center, single neuron) from the first trial on (right, population average from 107 neurons), suggesting inference without explicit linking A and B stimuli to reward. [From Pan et al. (411). Reprinted with permission from Nature Publishing Group.]
FIGURE 17.
FIGURE 17.
Anatomical and cellular dopamine influences on neuronal plasticity. A: global dopamine signal advancing to striatum and cortex. The population response of the majority of substantia nigra (SN) pars compacta and ventral tegmental area (VTA) dopamine neurons can be schematized as a synchronous, parallel volley of activity advancing at a velocity of 1–2 m/s (525) along the diverging projections from the midbrain to large populations of striatum (caudate and putamen) and cortex. [From Schultz (517).] B: differential influence of global dopamine signal on selectively active corticostriatal neurotransmission. The dopamine reinforcement signal (r) modifies conjointly active Hebbian synapses from active input (A) at striatal neuron (I) but leaves inactive synapses from inactive input (B) unchanged. Gray circle and ellipse indicate simultaneously active elements. There are ∼10,000 cortical terminals and 1,000 dopamine varicosities on each striatal neuron (138, 192). Drawing based on data from Freund et al. (171) and Smith and Bolam (548). [From Schultz (520).] C: dopamine-dependent neuronal plasticity in striatal neurons. Left: experimental in vitro arrangement of cortical input stimulation and striatal neuron recording using a spike time dependent plasticity (STDP) protocol in rats. Control: positive STDP timing (striatal EPSP preceding action potential, Δt = 20 ms) results in long-term potentiation (LTP) (top), whereas negative STDP timing (striatal EPSP following action potential, Δt = −30 ms) results in long-term depression (LTD) (1, orange, and 2, blue, refer to before and after stimulation). Dopamine D1 recepor antagonist SCH23390 (10 μM) blocks both forms of plasticity, whereas D2 antagonist sulpiride (10 μM) has less clear effects and affects only plasticity onset times (not shown). [From Shen et al. (540). Reprinted with permission from AAAS. From Pawlak and Kerr (424).]
FIGURE 18.
FIGURE 18.
Differential learning impairment by dopamine receptor blockade. A: dopamine receptor blockade induces severe learning deficits in sign-tracking rats (learning under flupenthixol, not shown; test drug free, shown here). Sign trackers contact a conditioned stimulus before approaching the goal. B: dopamine receptor blockade by flupenthixol induces less severe learning deficits in goal-tracking rats. Goal trackers bypass the stimulus and directly approach the goal. [A and B from Flagel et al. (163). Reprinted with permission from Nature Publishing Group.] C: knockout (KO) of NMDA receptors on mouse midbrain dopamine neurons reduces phasic impulse bursts (not shown) and induces learning deficits in pseudorandomly alternating T-maze reward arms. [From Zweifel et al. (650).]
FIGURE 19.
FIGURE 19.
Effects of dopamine stimulation on behavioral learning. A: operant self-stimulation chamber. Pressing the lever elicits an electrical or optogenetic stimulus delivered to a specific brain structure through an implanted electrode/optrode. [From Rentato M. E. Sabatini, The history of electrical stimulation of the brain, available at http://www.cerebromente.org.br/n18/history/stimulation_i.htm.] B: place preference conditioning by phasic but not tonic optogenetic activation of dopamine neurons in mice. [From Tsai et al. (605). Reprinted with permission from AAAS.] C: operant nosepoke learning induced by optogenetic activation of dopamine neurons at stimulated target (blue) but not at inactive target (black) in rats. [From Witten et al. (641), with permission from Elsevier.] D: optogenetic activation of dopamine neurons unblocks learning of visual stimulus for nosepoke in rats, as shown by stronger response to stimulus paired with optogenetic stimulation in a blocking procedure (blue) compared with unpaired stimulus (orange) and stimulation in wild-type animals (gray). Response decrements are typical for unreinforced tests (“in extinction”). [From Steinberg et al. (562). Reprinted with permission from Nature Publishing Group.] E: place dispreference conditioning by direct optogenetic inhibition of dopamine neurons in mice (yellow; optical stimulation alone, gray). [From Tan et al. (582), with permission from Elsevier.] F: operant conditioning of approach (blue) and avoidance (red) behavior by optogenetic activation of D1 and D2 dopamine receptor expressing striatal neurons, respectively, in mice. [From Kravitz et al. (293). Reprinted by permission of Nature Publishing Group.]
FIGURE 20.
FIGURE 20.
Explicit and conjoint neuronal reward signals in monkeys. A: scheme of explicit reward processing. Reward-predicting responses occur to an initial cue or to an action-inducing stimulus. Anticipatory activity occurs during the expectation of reward elicited by an external stimulus or action. Reward detection responses occur to the final reward. These different activities occur in separate neurons, except for dopamine neurons which all show similar responses (and no sustained reward expectation activations). B: neuronal reward processing irrespective of spatial position in orbitofrontal cortex. Differential activation by conditioned stimulus predicting grenadine juice but not apple juice, irrespective of spatial stimulus position and required movement (spatial delayed response task). C: neuronal reward processing irrespective of visual stimulus features in orbitofrontal cortex. Differential activations by conditioned stimuli predicting grape juice but not orange juice, irrespective of visual stimulus features. [A and B from Tremblay and Schultz (601).] D: scheme of conjoint reward-action processing. Predicted reward affects neuronal activity differentiating between different movement parameters during the instruction, preparation, and execution of action (e.g., spatial or go-nogo, blue vs. gray). E: conjoint processing of reward type (raisin vs. cabbage) and differentiating between spatial target positions in dorsolateral prefrontal cortex (spatial delayed response task). [From Watanabe (627). Reprinted with permission from Nature Publishing Group.] F: conjoint processing of reward (vs. no reward) and movement (vs. no movement) in caudate nucleus (delayed go-nogo task). The neuronal activities in E and F reflect the specific future reward together with the specific action required to obtain that reward. [From Hollerman et al. (222).]
FIGURE 21.
FIGURE 21.
Simplified scheme of brain structures and connections involved in explicit and conjoint reward processing. The diagonal line schematically separates brain structures with neurons processing explicit reward information from structures whose neurons process reward together with sensory or action information. The striatum contains both classes.
FIGURE 22.
FIGURE 22.
Dopamine reward response requires correct perception of reward-predicting stimulus. The reward prediction error response occurs only when the stimulus is present and is correctly reported as being present (hit; vibratory stimulus, top) but not when the stimulus is missed (miss) or is absent but incorrectly reported as present (false alarm). [From de Lafuente and Romo (122).]
FIGURE 23.
FIGURE 23.
Common currency coding of subjective value derived from different rewards in monkeys. A: behavioral choices between two juice rewards of varying amounts reveal common scale subjective economic value. Amounts at choice indifference (50% choice of either reward) reveal 3.2 times lower value of reward B than reward A (which serves as common scale reference). B: common currency coding of subjective value derived from different juice rewards in single orbitofrontal neuron. Response to reward-predicting stimulus increases with amount of either juice, irrespective of juice. This activity codes the decision variable of chosen value. [A and B from Padoa-Schioppa and Assad (405). Reprinted by permission from Nature Publishing Group.] C: rank ordered, ordinal behavioral preferences for different liquid and food rewards, as assessed in behavioral choices between blackcurrant juice (blue drop) and mashed mixture of banana, chocolate, and hazelnut food (yellow bananas). ∼, indifferent; <, preferred. D: common currency coding of subjective value in dopamine neurons (averages from 20 neurons). Colors refer to the rewards shown in C. [C and D from Lak et al. (301).]
FIGURE 24.
FIGURE 24.
Utility functions. A: a “well behaved,” gradually flattening (“concave”), continuous, monotonically increasing, nonsaturating utility function, typically for money. Gray rectangles indicate decreasing marginal utility (y-axis) with increasing wealth despite identical changes in objective value (x-axis). B: a saturating, nonmonotonic utility function typical for many biological rewards. Marginal utility becomes negative when an additional unit of consumption reduces utility (right end of function). C: a convex utility function, with gradually increasing marginal utility. D: a convex-concave utility function typical for progressively increasing marginal utility in lower ranges and progressively decreasing marginal utility in higher ranges.
FIGURE 25.
FIGURE 25.
Nonlinear reward probability weighting functions estimated from behavioral choices in monkey. Fitting by one-parameter Prelec function (435) (black), two-parameter Prelec function (green), and linear-in-log-odds function (red) (187, 305). [From Stauffer et al. (565).]
FIGURE 26.
FIGURE 26.
Neuronal value coding by monkey dopamine neurons. Monotonically increasing responses to increasing expected value (EV), irrespective of individual probability-magnitude combinations. EVs (right) are from 5 binary probability distributions with different probabilities and magnitudes of juice reward indicated at left. Population average from 55 dopamine neurons. Note that these responses do not suggest specific coding of EV as opposed to expected utility (EU), as at the time this distinction was not made experimentally. [From Tobler et al. (598).]
FIGURE 27.
FIGURE 27.
Utility prediction error signal in monkey dopamine neurons. A, top: gambles used for testing (0.1–0.4; 0.5–0.8; 0.9–1.2 ml juice; P = 0.5 each outcome). Height of each bar indicates juice volume. Bottom: behavioral utility function in monkey. Delivery of higher reward in each gamble generates identical positive physical prediction errors across gambles (0.15 ml, red, black, and blue dots). Due to different positions on the convex-concave utility function, the same physical prediction errors vary nonmonotonically in utility. Shaded areas indicate physical volumes (horizontal) and utilities (vertical) of tested gambles. B: positive neuronal utility prediction error responses (averaged from 52 dopamine neurons) to higher gamble outcomes in same animal (colored dots on utility function in A). The nonmonotonically varying dopamine responses reflect the nonmonotonically varying first derivative of the utility function (marginal utility). C: positive utility prediction error responses to unpredicted juice rewards. Red: utility function. Black: corresponding, nonlinear increase of population response (n = 14 dopamine neurons) in same animal. [AC from Stauffer et al. (560).]
FIGURE 28.
FIGURE 28.
Neuronal value coding incorporates reward cost and delay. A: construction of net utility from reward cost. Concave income utility (top) minus convex cost disutility (middle) results in nonmonotonic net utility (bottom). B: behavioral choice preferences reveal stronger reduction of subjective reward value by high compared with low effort cost (number of lever presses) in rats (income is identical). C: stronger reduction of cue response of single rat nucleus accumbens neuron by high (blue) compared with low (gray) effort cost. [B and C from Day et al. (116). Copyright 2010 John Wiley and Sons.] D: temporal discounting in monkey choice behavior (blue) and corresponding responses of dopamine neurons (red) across reward delays of 2–16 s (hyperbolic fittings; n = 33 neurons). [From Kobayashi and Schultz (285).]
FIGURE 29.
FIGURE 29.
Risk and utility functions. A: two principal measures in probability distributions (density function). Expected value (EV, first raw moment) denotes value. Variance (second central moment) denotes spread of values and is a good measure for symmetric risk. Red arrows show ± 1 units of standard deviation (SD; square root of variance). Not included are other important risk measures, including informational entropy and higher statistical moments such as skewness and kurtosis. B: variance risk (normalized) as a nonmonotonic function of probability. For contrast, dotted line shows monotonic increase of value with probability. C: concave utility function associated with risk avoidance. The risky gamble (red, 1 vs. 9, each at P = 0.5) induces stronger utility loss when losing the gamble (green) than the gain when winning the gamble (blue) relative to the utility of the expected value of the certain outcome (EV = 5). D: convex utility function associated with risk seeking. Gain from gamble win is stronger than loss from gamble losing. E: explaining subjective risk notions by gain-loss functions. Due to the steeper loss slope (“loss aversion”), the loss from the low outcome of the binary gamble looms larger than the gain from the high outcome. Hence, risk is often associated with the notion of loss. [Value function from Kahneman and Tversky (258), copyright Econometric Society.]
FIGURE 30.
FIGURE 30.
Behavioral risk measures in monkeys. A: stimuli indicating an adjustable certain (riskless, safe) outcome (blue) and a minimal risky binary gamble (red). Heights of horizontal bars indicate reward magnitude (higher is more). Typically, each gamble outcome occurs with probability P = 0.5. B: psychophysical assessment of subjective value of binary risky gambles by eliciting the certainty equivalent (CE). The CE is the value of the adjustable certain (riskless, safe) outcome at which choice indifference against the risky gamble is obtained (oculomotor choices in monkeys). A CE exceeding expected value (EV) indicates risk seeking (gamble at left), CE < EV indicates risk avoidance (right). Red arrows indicate the two outcomes of each gamble. C: choices for better options satisfy first-order stochastic dominance in monkey, indicating meaningful choice behavior. In choices against an equiprobable gamble (P = 0.5 each outcome), monkeys avoid the low certain reward (set at low gamble outcome, left) and prefer the high certain reward (set at high gamble outcome, right). Averaged data from binary choices involving four gambles: 0.1–0.4 ml, 0.5–0.8 ml, 0.9–1.2 ml, 0.1–1.2 ml. D: choices for riskier options with mean preserving spread satisfy second-order stochastic dominance for risk seeking in monkey, indicating meaningful incorporation of risk into choices. When presented with gambles in the risk-seeking domain of the utility function (left; expected utility, EU, higher for riskier gamble, red), monkeys prefer the riskier over the less risky gamble. [B–D from Stauffer et al. (560).]
FIGURE 31.
FIGURE 31.
Neuronal risk processing in monkeys. A: coding of risk in single neuron of orbitofrontal cortex. Height of bars indicates liquid reward volume, two bars within a rectangle indicate an equiprobable gamble (P = 0.5 each). The three gambles have same mean but different variance (9, 36, and 144 ml × 10−4) (mean-preserving spread). This neuron, as most other orbitofrontal risk neurons, failed to code reward value (not shown). [From O'Neill and Schultz (391), with permission from Elsevier.] B: coding of risk prediction error in orbitofrontal cortex. Top: risk prediction error (colored double arrows), defined as difference between current risk (vertical distance between bars in each gamble indicates standard deviation) and predicted risk (common dotted red line, mean of standard deviations of the three gambles). Colored double vertical arrows indicate unsigned (absolute) prediction errors in variance risk. Bottom: averaged population responses from 15 orbitofrontal neurons to unsigned risk error. Such signals may serve for updating risk information. [From O'Neill and Schultz (392).] C: risk coding in single dopamine neuron during the late stimulus-reward interval. The activation is maximal with reward probability of P = 0.5, thus following the inverted U function of variance risk shown in Figure 29B. Trials are off line sorted according to reward probability. [From Fiorillo et al. (161).] D: independence of risk activation in single dopamine neuron from reward outcome in preceding trial. Activation is not stronger after positive prediction errors (top) than after negative prediction errors (bottom). Thus prediction error responses do not backpropagate in small steps from reward to stimulus. Both rewarded and unrewarded current trials are shown in each graph. [From Fiorillo et al. (162).] E: influence of risk on subjective value coding in dopamine neurons. The population response is stronger with subjectively higher valued certain (safe) juice rewards (green: blackcurrant; blue: orange; both 0.45 ml), demonstrating value coding. This value response is enhanced with risky juice volumes (equiprobable gamble of 0.3 and 0.6 ml, same mean of 0.45 ml), corresponding to the animal's risk seeking attitude (higher subjective value for risky compared with certain rewards, inset). [From Lak et al. (301).] F: dopamine responses satisfy first-order stochastic dominance, demonstrating meaningful processing of stimuli and reward value under risk (averages from 52 neurons). In the two gambles (blue, red), the higher outcomes are equal, but the lower red outcome is higher than the lower blue outcome, defining gamble dominance. G: dopamine responses satisfy second-order stochastic dominance, demonstrating meaningful incorporation of risk into neuronal utility signal (averages from 52 neurons). The red gamble has greater mean-preserving spread than the blue gamble, defining dominance with risk seeking. [F and G from Stauffer et al. (560).]
FIGURE 32.
FIGURE 32.
Scheme of adaptive reward processing. A: adaptation to expected value (r1, r2): shift of reference point changes utility gain to loss for identical objective values. B: adaptation to variance (v1, v2): slope adaptation to variance results in larger utility for lower objective value. [Value function from Kahneman and Tversky (258), copyright Econometric Society.]
FIGURE 33.
FIGURE 33.
Adaptive neuronal reward processing in monkey orbitofrontal cortex. A: response adaptation to approximate expected subjective value in single neuron. Trial block 1 offers pieces of cereal or apple, separate block 2 offers same apple (indicated by same stimulus) or raisin. Behavioral choices ranked cereal < apple < raisin. Visual instructions predict type of reward, trigger stimuli elicit arm movement leading to reward. [From Tremblay and Schultz (601).] B: response adaptation to variance of reward amount (ml) in single neuron. Inset shows change of reward-response regression slope in same neuron. [From Kobayashi et al. (284).]
FIGURE 34.
FIGURE 34.
Social reward processing. A: social reward inequity aversion. Difference between own and other's reward reduces my utility. Usually, disadvantageous inequity (getting less than others, negative difference, left) has stronger and more consistent effects than advantageous inequity (getting more than others, right). [From Loewenstein et al. (324).] B: action-dependent coding of social reward in single striatal neurons. In the imperative reward giving task (modified dictator game), two monkeys sit opposite each other across a touch-sensitive computer monitor and give reward to itself and the conspecific. Left: neuronal activation when receiving own reward, either only to itself (red) or together with conspecific (green), but no activation with reward only to conspecific (violet) or to nobody (blue). Right: activation with own reward occurs only with own action (top, continuous lines) or only with conspecific's action (bottom, dotted lines, different neurons between top and bottom). [From Báez-Mendoza et al. (25).]
FIGURE 35.
FIGURE 35.
Steps and components of voluntary economic decisions. Five component processes occur in sequence, and to some extent in parallel depending on the characteristics of the decision. Decision variables are indicated in central box below their respective mediating processes (object value, action value, chosen value, chosen object, chosen action).
FIGURE 36.
FIGURE 36.
Schematics of decision mechanisms. A: diffusion model of perceptual decisions. Difference signals for sensory evidence or value increase in a single integrator towards a specific threshold for one or the opposite choice option (red, blue). Later threshold acquisition results in later decision (green). Time basis varies according to the nature of the decision and the difficulty in acquiring sensory evidence and valuing the options. B: race model of perceptual decisions. Separate signals for each choice option increase in separate integrators towards specific thresholds. The option whose value signal reaches the threshold first (red) will be pursued, whereas the lower signal at this point loses (blue). C: basic competition mechanism. Separate inputs for each choice option (A, B) compete with each other through lateral inhibition. Feedforward excitation (red) enhances stronger options, and mutual inhibition (green) reduces weaker options even more, thus enhancing the contrast between options. This competition mechanism defines object value and action value as input decision variables. For a winner-take-all (WTA) version, a threshold cuts off the weaker of the resulting signals and makes the stronger option the only survivor.
FIGURE 37.
FIGURE 37.
Neuronal ramping activity preceding stimuli, action, and reward. A: gradual activity increase during the expectation of an initial visual instruction stimulus in premotor cortex neuron. Open arrow points to movement triggering stimulus. [From Mauritz and Wise (350), with kind permission from Springer Science and Business Media.] B: gradual increase of left-right differential activity during movement preparation in premotor cortex neuron. Activity terminates just after the movement triggering stimulus and before the movement. Left (black) and right (gray) refer to target positions. [From Kurata and Wise (298).] C: ramping activity preceding self-initiated movements in striatum neuron. Activity begins gradually without external imperative stimuli and terminates with movement onset. [From Schultz and Romo (528), with kind permission from Springer Science and Business Media.] D: differential reward expectation activity in striatum neuron. Activity is lower in anticipation of raspberry juice (black) than blackcurrant juice (gray). [From Hassani et al. (205).] E: reward expectation activity in amygdala neuron reflecting instantaneous reward probability. Activity ramps up steeply before singular reward occurring at predictable time after stimulus onset (increasing reward expectation), but shows lesser increase before reward occurring pseudorandomly during stimulus (flat reward expectation with flat occurrence rate). [From Bermudez et al. (40).]
FIGURE 38.
FIGURE 38.
Neuronal ramping activity during perceptual decisions. A: ramping activity during dot motion discrimination in monkey lateral intraparietal cortex (average from 54 neurons). Continuous and dotted lines indicate saccades into and out of neuronal response field, respectively. Motion strength indicates the percentage of coherently moving dots, and thus the facility to discriminate between their direction (out of two possible directions). The buildup is steeper with higher motion coherence but ends at same height at the time of choice. Stimulus marks onset of search array (target and distractors); choice marks saccade onset. [From Roitman and Shadlen (483).] B: ramping activity during visual search in a monkey frontal eye field neuron. Heavy and thin lines indicate target position inside and out of neuronal response field, respectively. Stimulus marks onset of search array (target and distractors); filled arrow marks saccade onset. [From Thompson et al. (588).] C: average ramping activity from 104 neurons in monkey lateral intraparietal cortex reflects subjective perception of dot motion direction rather than objective motion direction (12.8% coherently moving dots). Correct trials (full line) and error trials (dashed) differentiate between saccades into and out of neuronal response field (black and gray), irrespective of actual dot motion direction. [From Shadlen and Newsome (535).]
FIGURE 39.
FIGURE 39.
Neuronal ramping activity during action decisions. A: ramping activity during eye movement countermanding in a monkey frontal eye field neuron. Thin and heavy lines indicate continued and correctly stopped (countermanded) saccades, respectively. [From Schall et al. (507), with permission from Elsevier.] B: steeper ramping activity associated with earlier saccade choice in a monkey frontal eye field neuron. Neuronal activity has reached the same height at time of choice irrespective of slope. [From Schall and Thompson (508). Copyright 1999, Annual Reviews.] C: ramping activity during action decisions in monkey cingulate motor area. Upon decrease of reward amount, the monkey selects an alternate arm movement (turn) after the previous movement (push), thus restoring full reward amount. [From Shima and Tanji (543). Reprinted with permission from AAAS.] D: ramping activity preceding choice target reflects future choice in monkey supplementary eye field neuron. Black, free choice into neuronal response field; gray, opposite choice. [From Coe et al. (101).] E: differentiation of action coding in monkey premotor cortex. Neuronal population activity is initially segregated according to each action (red and blue circles) but becomes selective for final action after an imperative cue instructs the action. [From Cisek and Kalaska (99). Copyright 2010, Annual Reviews.]
FIGURE 40.
FIGURE 40.
Neuronal ramping activity during economic decisions. Ramping activity in monkey lateral intraparietal cortex neurons during oculomotor matching choice between more and less frequently rewarded options (average from 43 neurons). Activity reflects the “fractional income” (ratio of chosen reward value to summed value of all options). Blue, saccade into neuronal response field; green, opposite movement. Fractional income varies between 0 (dotted lines) and 1.0 (think lines). [From Sugrue et al. (571). Reprinted with permission from AAAS.]
FIGURE 41.
FIGURE 41.
Neuronal coding of economic input decision variables for competitive mechanisms. A: behavioral choices between two juices that vary in magnitude. Increasing the amount of juice B (blue) increases the frequency of the monkey choosing that juice. The estimated indifference point (50% B choice) reveals that juice B is worth 0.4 units (1/2.5) of juice A. B: object value coding of single neuron in monkey orbitofrontal cortex during behavioral choices assessed in A. Activity increases with the amount of only juice B, not juice A, suggesting object value coding of reward B. [A and B from Padoa-Schioppa and Assad (405). Reprinted with permission from Nature Publishing Group.] C: behavioral choices between two actions that vary in reward probability. Blue and red ticks show actual choices of left and right targets, respectively. Light blue line shows running % left choices. D: action value coding of single neuron in monkey striatum. Activity increases with value (probability) for left action (left panel: blue vs. orange), but remains unchanged with value changes for right action (right panel), thus coding left action value. [C and D from Samejima et al. (500). Reprinted with permission from AAAS.]
FIGURE 42.
FIGURE 42.
Abstract neuronal decision signals in monkeys. A: abstract perceptual decision coding in prefrontal cortex neuron. Initial graded frequency coding of vibrotactile stimulus (left peak) transitions to all-or-none coding of difference between two successive vibration frequencies. First vibratory stimulus begins at −0.5 s, second (comparison) vibratory stimulus begins at 3.0 s. Y and N refer to yes/no decision about the first stimulus frequency being higher than the second one. [From Machens et al. (334). Reprinted with permission from AAAS.] B: abstract economic decision coding during save-spend choices in single amygdala neuron. In each trial, the animal chose between saving reward with an interest or spending the saved reward. The neuron codes reward value early in the trial (derived from choice preferences, green) and later codes the actual save-spend choice (blue). Shown are time courses of the two most significant partial regression coefficients (r2) from a multiple regression model that includes abstract save-spend choice, value (reward magnitude), spatial cue position, left-right action, and reaction time. [From Grabenhorst et al. (188).]
FIGURE 43.
FIGURE 43.
Relative value signals in monkey lateral intraparietal cortex. A: single neuron activity reflecting relative value during free oculomotor choice. Left: higher activity with higher “expected gain ratio” (EGR), lower activity with lower EGR. Right: linear regression on EGR. EGR denotes liquid reward volume of chosen option divided by summed magnitude of all options. [From Platt and Glimcher (433). Reprinted with permission of Nature Publishing Group.] B: single neuron responses increasing with the log likelihood ratio (logLR) of reward probabilities between chosen and unchosen options (choices into neuronal response field). [From Yang and Shadlen (643). Reprinted with permission from Nature Publishing Group.]
FIGURE 44.
FIGURE 44.
Chosen object and action signals in monkey lateral intraparietal cortex. A: coding of chosen object (orange color) or chosen action (blue) during perceptual decisions in population (averages from 23 neurons). In the conditional motor task, the animal saccades to a red or green dot (chosen object) depending on the direction of random dot motion. The dots are shown at different spatial positions and thus require different saccades (chosen action). Ordinate is % of significantly responding neurons for chosen object and chosen action (and dot motion direction, magenta). [From Bennur and Gold (38).] B: chosen action coding in single neuron. After a common onset, activity differentiates between effectors ∼400 ms before action (saccade vs. reach). [From Cui and andersen (109), with permission from Elsevier.]
FIGURE 45.
FIGURE 45.
Hypothetical mechanism of dopamine updating of decision variables. Within a competitive decision mechanism, the global dopamine reward prediction error signal would act indiscriminately on postsynaptic neurons and changes their synaptic input efficacy by influencing stimulus eligibility traces. It affects only neurons coding object value or action value of the option chosen, as only their eligibility traces are being stabilized and maintained by input from neurons activated by the chosen object or chosen action (right), but not affect neurons whose initial eligibility traces are lost due to lack of stabilizing input from neurons not being activated by the unchosen object or unchosen action (left). This selective effect requires specific connections from chosen object/chosen action neurons to object value/action value neurons for the same object/action. The prediction error conveyed by the dopamine neurons derives from chosen value (experienced minus predicted reward). Gray zones at top right indicate common activations. The weight of dots and lines in the circuit model indicates level of neuronal activity. Dotted lines indicate inputs from unchanged neuronal activities. Crossed green connections are inhibitory; WTA, winner-take-all selection. Scheme developed together with Fabian Grabenhorst.
FIGURE 46.
FIGURE 46.
Immediate dopamine influences. A: hypothetical mechanism of influence of dopamine reward signal on striatal reward response. Bottom: a rewarded, but not unrewarded, stimulus differentially activates a dopamine neuron. [From Tobler et al. (598).] Middle: possible dopamine influence on striatal synaptic potentials: dopamine D1 receptor agonist prolongs the depolarization of a striatal neuron. [From Hernández-Lopez et al. (213).] Top: as a result of the dopamine influence on striatal depolarization, the striatal neuron responds stronger to a rewarded compared with an unrewarded stimulus. [From Hollerman et al. (222).] B: influence of dopamine reward signal on behavioral navigation. Electrical stimulation to the left and right somatosensory cortex of rats provides cues for turning; electrical stimulation of the medial forebrain bundle containing dopamine axons induces forward locomotion. The combined stimulation is able to guide a rat through a three-dimensional obstacle course, including an unnatural open field ramp. Colored dots indicate stimulation of forebrain bundle and somatosensory cortex. [From Talwar et al. (580). Reprinted with permission from Nature Publishing Group.] C: influence of dopamine reward signal on behavioral choices. Unilateral optogenetic stimulation of mouse striatal neurons expressing dopamine D1 or D2 receptors induces immediate differential choice biases (left bias for right D1 stimulation, top; and right bias for right D2 stimulation, bottom). [From Tai et al. (576). Reprinted with permission from Nature Publishing Group.]
FIGURE 47.
FIGURE 47.
Hypothetical mechanism of immediate dopamine influence on neuronal coding of decision variables. For the basic competitive decision mechanism, the dopamine signal arises from a temporal difference (TD) prediction error in chosen value at the time of the decision. The dopamine signal boosts differences in activity between the two options reflecting object value or action value (bottom). Alternatively, and more effectively, the signal may enhance activities representing chosen object or chosen action selected by the winner-take-all (WTA) mechanism (top right), while leaving nonexisting activity unchanged (top left). The weight of dots and lines in the circuit model indicates level of neuronal activity. Dotted lines indicate inputs from unchanged neuronal activities. Crossed green connections are inhibitory.
FIGURE 48.
FIGURE 48.
An example economic decision model and key anatomical foundations. A: architecture of a sensory or value decision model involving the cerebral cortex and basal ganglia. Recurrent excitations induce ramping activity in cortex (input to basal ganglia) and superior colliculus (output of basal ganglia), whereas lateral inhibition between neuronal pools representing the two choice options mediate competitive winner-take-all (WTA) selection of the better option at the input (cortex) and induce a corresponding ocular saccade at the output (superior colliculus). [From Wang (623), with permission from Elsevier.] B: anatomical convergence of neurons from striatum (caudate and putamen) onto dendritic disks of neurons in globus pallidus (internal and external segments) in monkey. The dendritic disks represent an abstraction of the wide dendritic arborizations that are oriented orthogonally to axons traversing the globus pallidus from the striatum. Inset shows several axons from striatal neurons traversing and contacting the pallidal dendritic disks. These parallel striatal axons induce substantial anatomical striatal-pallidal convergence by contacting the dendrites in the disks. [From Percheron et al. (430). Copyright 1984 John Wiley and Sons.]
FIGURE 49.
FIGURE 49.
Unconscious onset of conscious awareness to act. A: design of Libet's classic experiment. A dot moves clockwise around a circle. Subjects remember the dot position at which they became consciously aware of the urge to do a self-initiated finger or wrist movement and report the dot position after being prompted. B: electroencephalographic readiness potential recorded at the vertex (top of skull) of one human participant (average of 40 trials). Onset of aware urge to move is indicated in red (bar shows range from eight averages of 40 trials each). Muscle onset denotes onset of electromyographic activity in involved forearm muscle. [From Libet et al. (316), by permission of Oxford University Press.] C: detection of time and occurrence of deviation from baseline activity in 37 single and multiple neurons before awareness to act, as determined by a support vector machine classifier. The neurons or multineuron clusters are located in human supplementary motor area (n = 22), anterior cingulate cortex (n = 8), and medial temporal lobe (n = 7). D: ramping activity preceding the conscious awareness to act in activity averaged from 59 neurons in human supplementary motor area. [C and D from Fried et al. (172), with permission from Elsevier.]

Similar articles

Cited by

References

    1. Abe H, Lee D. Distributed coding of actual and hypothetical outcomes in the orbital and dorsolateral prefrontal cortex. Neuron 70: 731–741, 2011. - PMC - PubMed
    1. Adamantidis AR, Tsai HC, Boutrel B, Zhang F, Stuber GD, Budygin EA, Touriño C, Bonci A, Deisseroth K, de Lecea L. Optogenetic interrogation of dopaminergic modulation of the multiple phases of reward-seeking behavior. J Neurosci 31: 10829–10835, 2011. - PMC - PubMed
    1. Adrian ED, Zotterman Y. The impulses produced by sensory nerve endings. Part 3. Impulses set up by Touch and Pressure. J Physiol 61: 465–483, 1926. - PMC - PubMed
    1. Ainslie GW. Impulse control in pigeons. J Exp Anal Behav 21: 485–489, 1974. - PMC - PubMed
    1. Ainslie GW. Specious rewards: a behavioral theory of impulsiveness and impulse control. Psych Bull 82: 463–496, 1975. - PubMed

Publication types