

Influence of a strict glucose protocol on serum potassium and glucose concentrations and their association with mortality in intensive care patients
- PMID: 26100120
- PMCID: PMC4548912
- DOI: 10.1186/s13054-015-0959-9
Influence of a strict glucose protocol on serum potassium and glucose concentrations and their association with mortality in intensive care patients
Abstract
Introduction: Tight glucose control therapy (TGC) has been implemented to control hyperglycemia in ICU patients. TGC may also influence serum potassium concentrations. We therefore investigated the influence of TGC on both serum glucose and serum potassium concentrations and associated mortality.
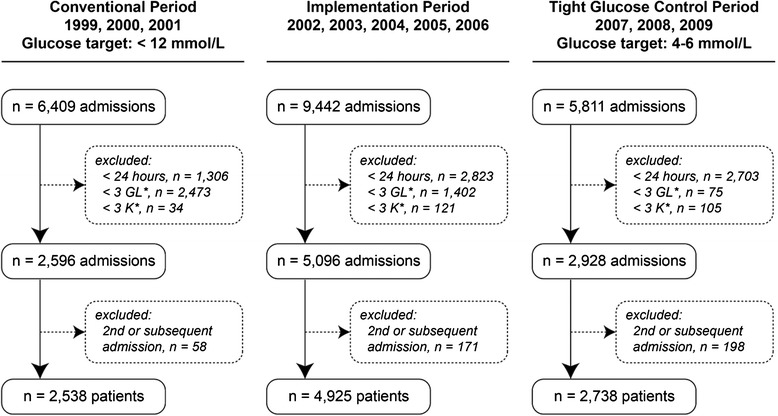
Method: We performed a retrospective analysis including all patients admitted to the ICU of a tertiary hospital for 24 hours or more and with at least three serum glucose and serum potassium concentrations between 1999-2001 (conventional period), 2002-2006 (implementation period) or 2007-2009 (TGC period). Segmented regression analysis was used to estimate changes in outcomes that occurred after the intervention controlling for pre-intervention trends. Means and standard deviations (SDs) of serum glucose and serum potassium concentrations, and rate of severe hypoglycemia (≤ 2.2 mmol/L) and hypokalemia (≤ 3 mmol/L), were compared between the TGC and conventional period.
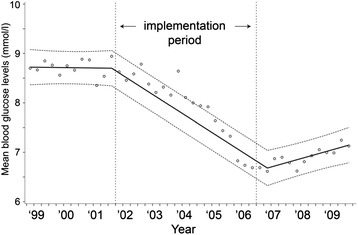
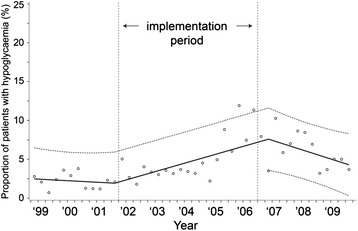
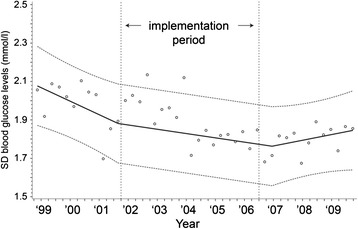
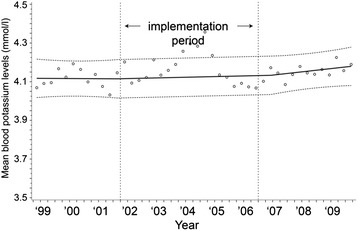
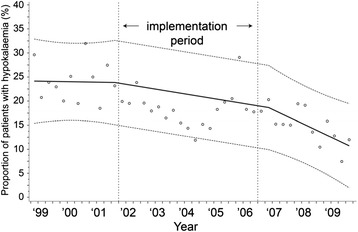
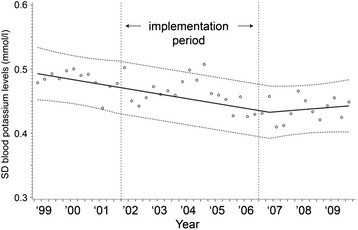
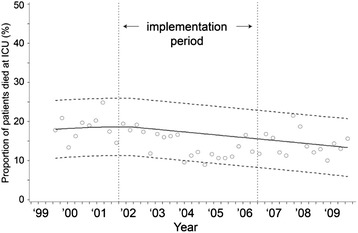
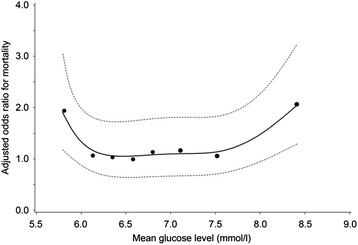
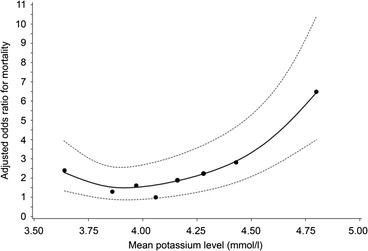
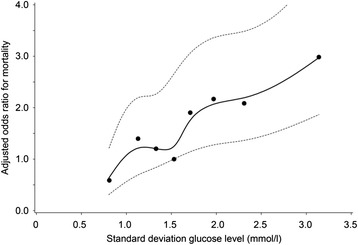
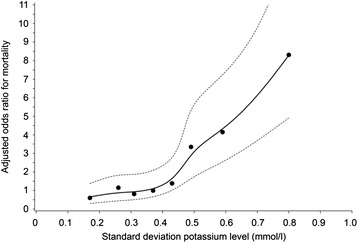
Results: Although mean serum glucose concentrations dropped 2.1 mmol/L (95% CI =-1.8 to -2.3 mmol/L, p<0.002), mean serum potassium concentrations did not change (absolute increase 0.02 mmol/L; 95% CI = -0.06 to 0.09 mmol/L, p=0.64). The rate of severe hypoglycemia increased with 5.9% (95% CI=-3.0 to -8.9, p<0.002), but the rate of hypokalemia remained equal (absolute reduction 4.8%; 95% CI = -11.1% to 1.5%, p=0.13). The SD of serum glucose concentrations within a patient did not change, while the SD of serum potassium concentrations even decreased 0.04 mmol/L (95% CI = -0.01 to -0.07, p = 0.01). ICU mortality decreased but this decrease was not significant (absolute difference -3.63%; 95% CI = -9.33 to 2.09, p = 0.20). Mean serum glucose concentrations, mean serum potassium concentrations and SDs of both serum glucose and serum potassium concentrations were all independently associated with ICU mortality. Highest mortality rates were seen at both the lowest and highest mean values (U/J-shaped association) and mortality rates increased with increasing variability (SDs) for both serum glucose and serum potassium concentrations.
Conclusion: Our study shows that a TGC was not associated with an increased risk of serum potassium related events. Low and high mean values and high variability of both serum glucose and serum potassium concentrations are predictors for high ICU mortality.
Figures
Similar articles
-
The relationship between serum potassium, potassium variability and in-hospital mortality in critically ill patients and a before-after analysis on the impact of computer-assisted potassium control.Crit Care. 2015 Jan 6;19(1):4. doi: 10.1186/s13054-014-0720-9. Crit Care. 2015. PMID: 25560457 Free PMC article.
-
Implementation and evaluation of the SPRINT protocol for tight glycaemic control in critically ill patients: a clinical practice change.Crit Care. 2008;12(2):R49. doi: 10.1186/cc6868. Epub 2008 Apr 16. Crit Care. 2008. PMID: 18412978 Free PMC article.
-
Influence of dyskalemia at admission and early dyskalemia correction on survival and cardiac events of critically ill patients.Crit Care. 2019 Dec 19;23(1):415. doi: 10.1186/s13054-019-2679-z. Crit Care. 2019. PMID: 31856891 Free PMC article.
-
Glucose control in the intensive care unit.Crit Care Med. 2009 May;37(5):1769-76. doi: 10.1097/CCM.0b013e3181a19ceb. Crit Care Med. 2009. PMID: 19325461 Review.
-
Tight glucose control in critically ill children--a systematic review and meta-analysis.Pediatr Diabetes. 2014 Mar;15(2):75-83. doi: 10.1111/pedi.12134. Pediatr Diabetes. 2014. PMID: 24783254 Review.
Cited by
-
Serum osmolality was non-linearly associated with the risk of all-cause and cardiovascular mortality in patients with diabetes.BMJ Open Diabetes Res Care. 2023 Dec 22;11(6):e003826. doi: 10.1136/bmjdrc-2023-003826. BMJ Open Diabetes Res Care. 2023. PMID: 38135453 Free PMC article.
-
Clinical Management of Diabetes Mellitus in the Era of COVID-19: Practical Issues, Peculiarities and Concerns.J Clin Med. 2020 Jul 18;9(7):2288. doi: 10.3390/jcm9072288. J Clin Med. 2020. PMID: 32708504 Free PMC article. Review.
-
Current Practices in Missing Data Handling for Interrupted Time Series Studies Performed on Individual-Level Data: A Scoping Review in Health Research.Clin Epidemiol. 2021 Jul 23;13:603-613. doi: 10.2147/CLEP.S314020. eCollection 2021. Clin Epidemiol. 2021. PMID: 34326669 Free PMC article.
-
Handling Missing Values in Interrupted Time Series Analysis of Longitudinal Individual-Level Data.Clin Epidemiol. 2020 Oct 8;12:1045-1057. doi: 10.2147/CLEP.S266428. eCollection 2020. Clin Epidemiol. 2020. PMID: 33116899 Free PMC article.
-
Association between serum glucose potassium ratio and mortality in critically ill patients with intracerebral hemorrhage.Sci Rep. 2024 Nov 9;14(1):27391. doi: 10.1038/s41598-024-78230-8. Sci Rep. 2024. PMID: 39521806 Free PMC article.
References
Publication types
MeSH terms
Substances
LinkOut - more resources
Full Text Sources
Other Literature Sources
Medical
