. 2016 Jan;137(1):231-245.e4.
doi: 10.1016/j.jaci.2015.05.004. Epub 2015 Jun 19.

RhoA orchestrates glycolysis for TH2 cell differentiation and allergic airway inflammation

Affiliations

RhoA orchestrates glycolysis for TH2 cell differentiation and allergic airway inflammation

Jun-Qi Yang et al. J Allergy Clin Immunol. 2016 Jan.

Abstract

Background: Mitochondrial metabolism is known to be important for T-cell activation. However, its involvement in effector T-cell differentiation has just begun to gain attention. Importantly, how metabolic pathways are integrated with T-cell activation and effector cell differentiation and function remains largely unknown.

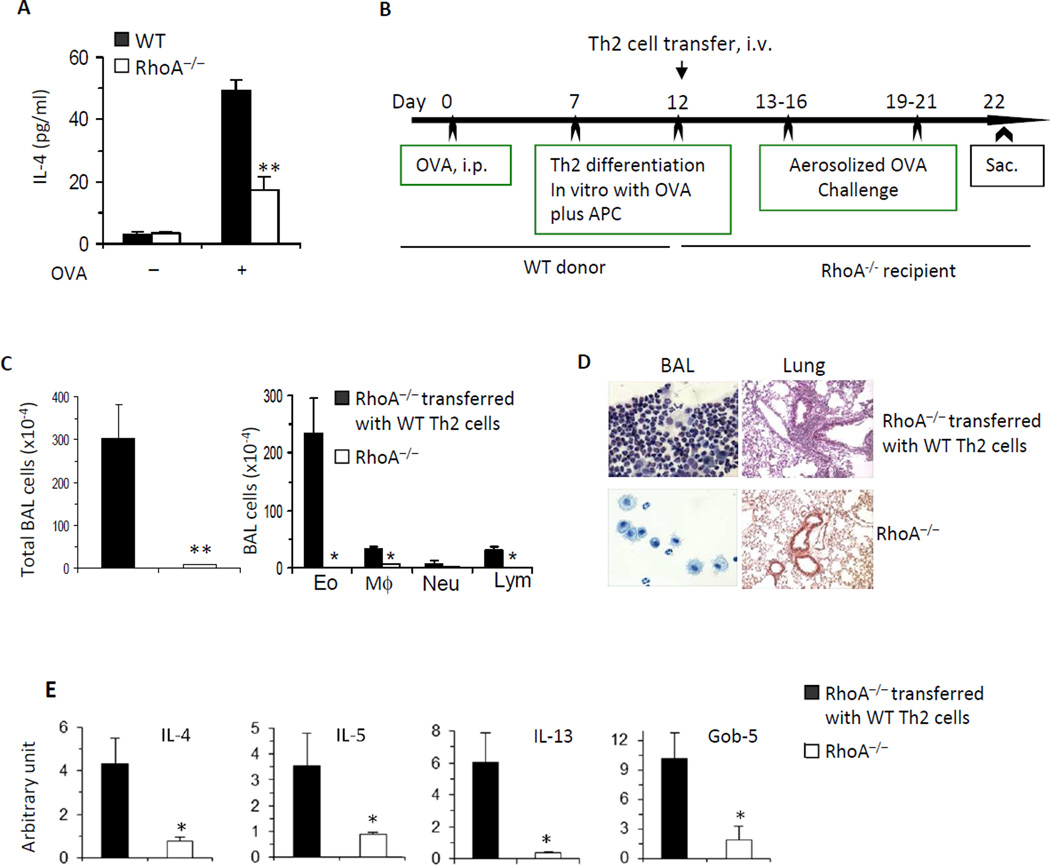
Objective: We sought to test our hypothesis that RhoA GTPase orchestrates glycolysis for TH2 cell differentiation and TH2-mediated allergic airway inflammation.

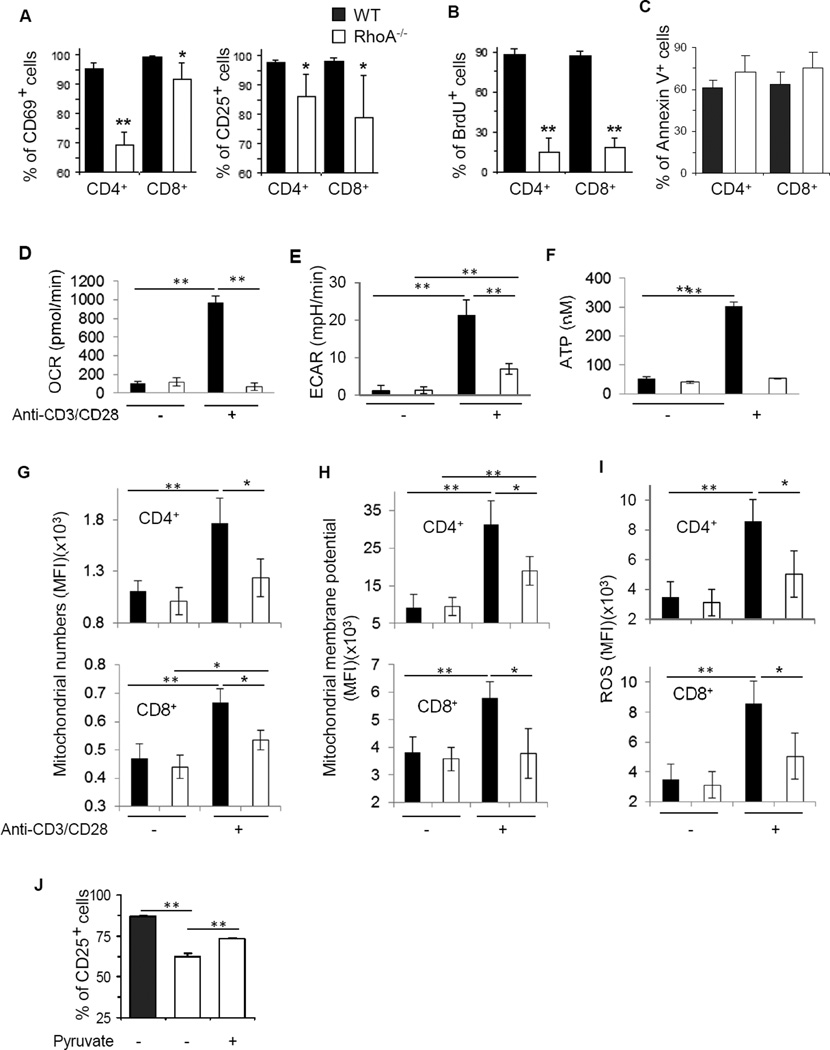
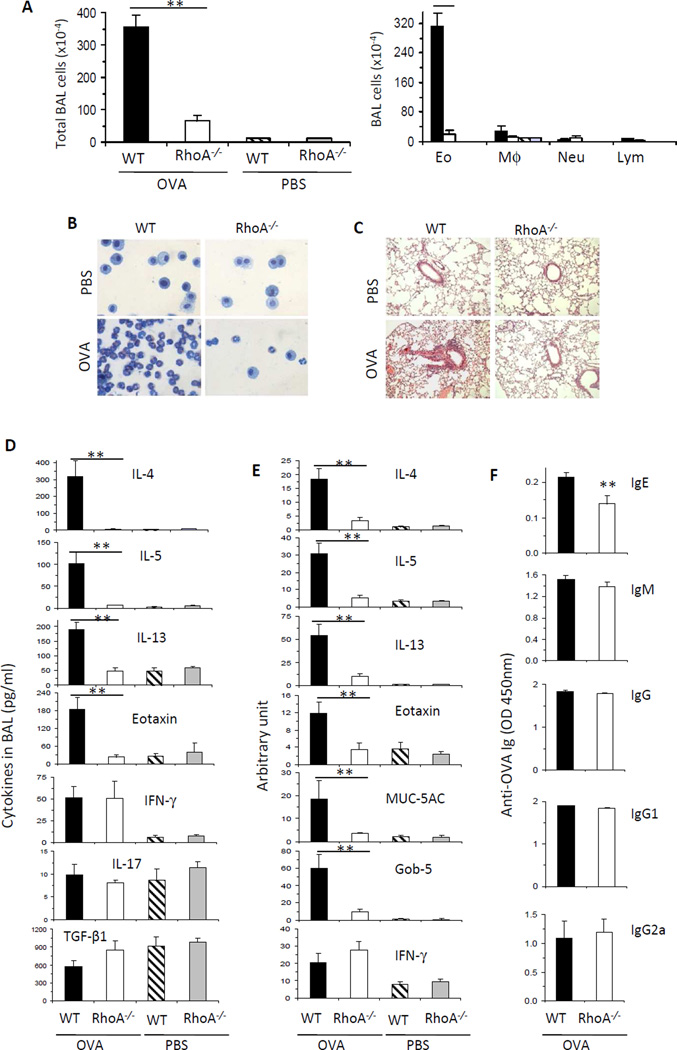
Methods: Conditional RhoA-deficient mice were generated by crossing RhoA(flox/flox) mice with CD2-Cre transgenic mice. Effects of RhoA on TH2 differentiation were evaluated based on in vitro TH2-polarized culture conditions and in vivo in ovalbumin-induced allergic airway inflammation. Cytokine levels were measured by using intracellular staining and ELISA. T-cell metabolism was measured by using the Seahorse XF24 Analyzer and flow cytometry.

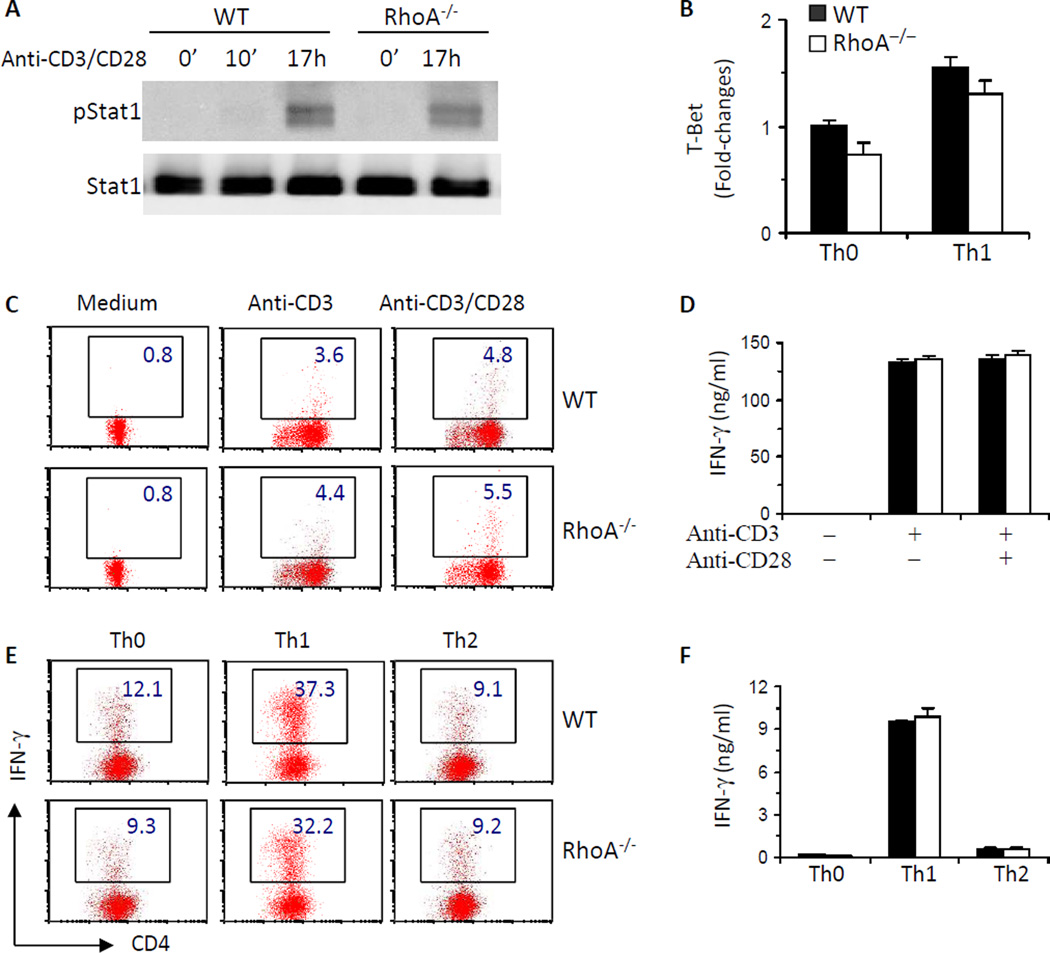
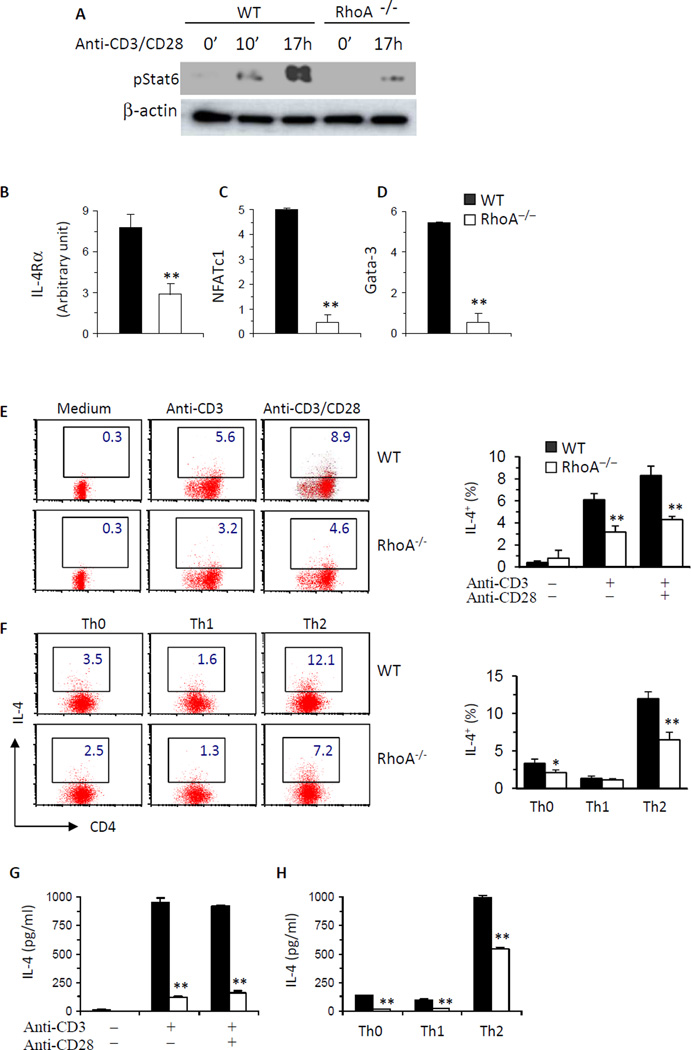
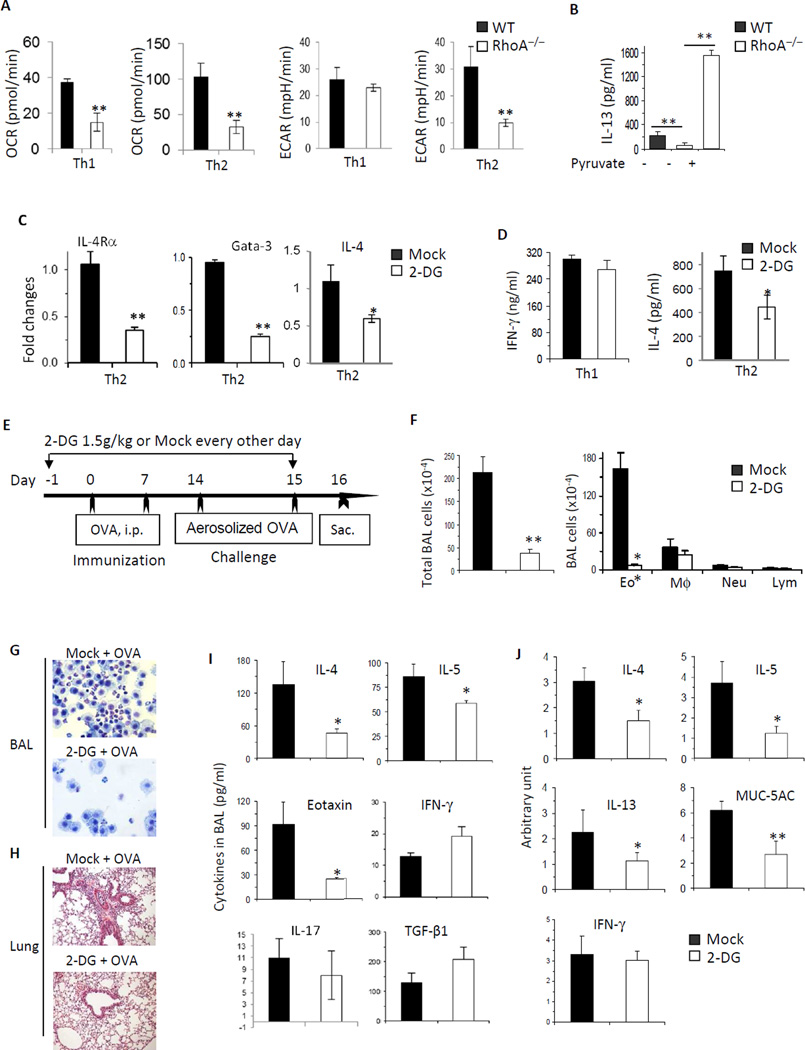
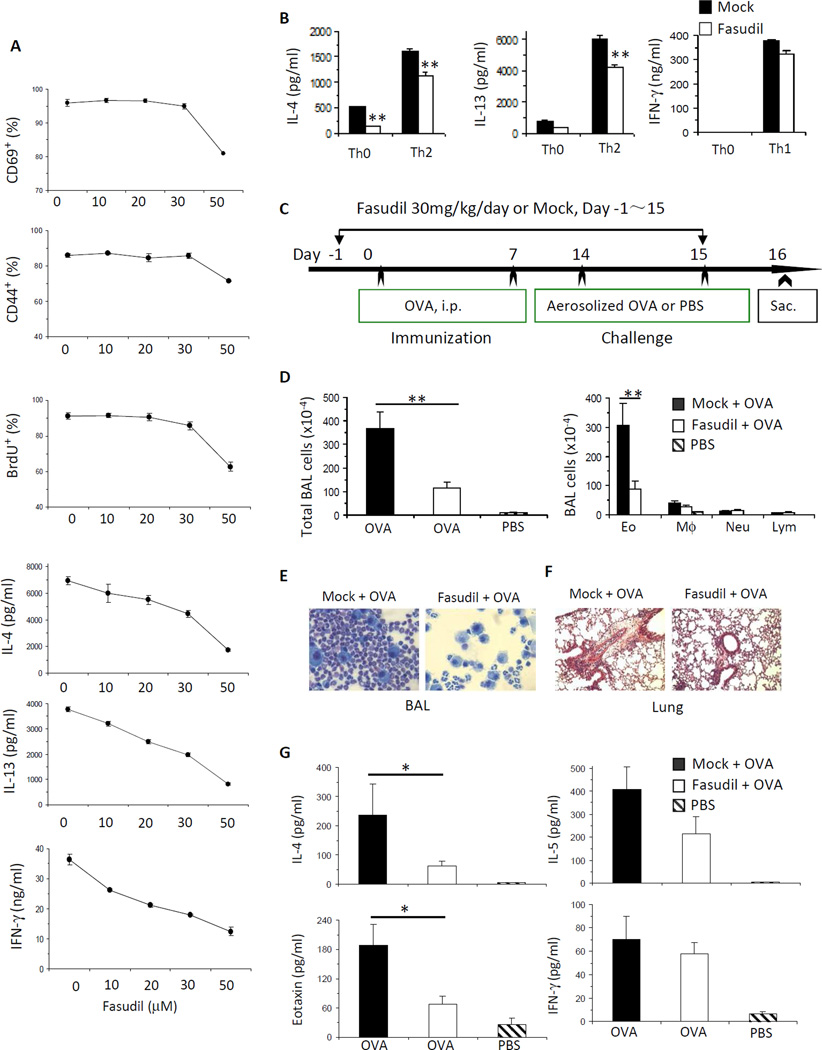
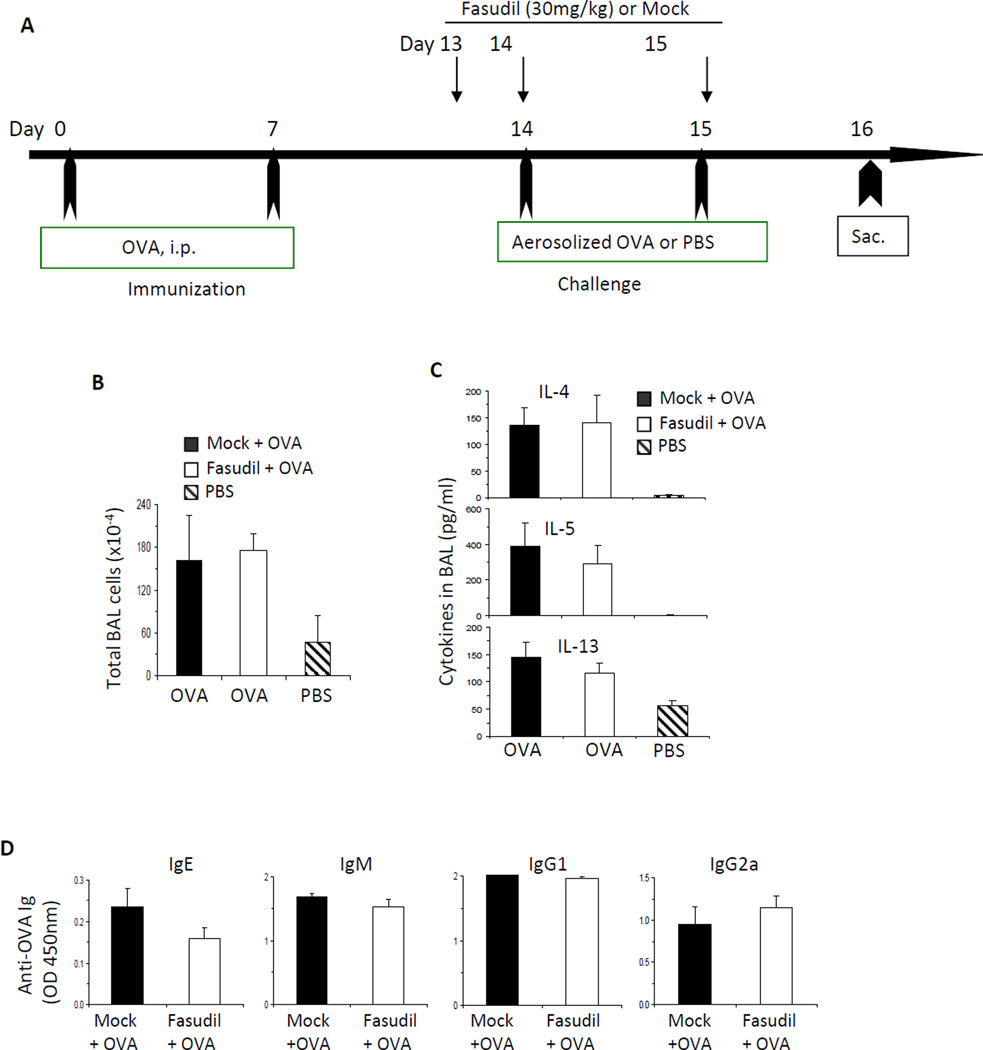
Results: Disruption of RhoA inhibited T-cell activation and TH2 differentiation in vitro and prevented the development of allergic airway inflammation in vivo, with no effect on TH1 cells. RhoA deficiency in activated T cells led to multiple defects in metabolic pathways, such as glycolysis and oxidative phosphorylation. Importantly, RhoA couples glycolysis to TH2 cell differentiation and allergic airway inflammation through regulating IL-4 receptor mRNA expression and TH2-specific signaling events. Finally, inhibition of Rho-associated protein kinase, an immediate downstream effector of RhoA, blocked TH2 differentiation and allergic airway inflammation.

Conclusion: RhoA is a key component of the signaling cascades leading to TH2 differentiation and allergic airway inflammation at least in part through control of T-cell metabolism and the Rho-associated protein kinase pathway.

Keywords: RhoA; T(H)2 differentiation; T-cell metabolism; allergic airway inflammation; glycolysis.


Figures

FIG 1
FIG 1. RhoA deficiency impairs T cell activation and mitochondrial metabolism
A and B, RhoA deficiency impairs T cell activation (A) and proliferation (B). Naïve T cells were stimulated with anti-CD3/CD28 for 2 days. BrdU (10 µM) was added at the last 20 h. The surface expression of T cell activation markers CD69 and CD25 (A) and BrdU staining (B) in CD4+ and CD8+ cells was analyzed by flow cytometry. C, RhoA deficiency has no effect on cell apoptosis. Cell apoptosis was detected by Annexin V staining and flow cytometry. D–I, RhoA deficiency impairs mitochondrial metabolism in activated T cells. Naïve T cells were stimulated with or without anti-CD3/CD28 overnight, followed by analysis of oxygen consumption rate (OCR) (D), extracellular acidification rate (ECAR) (E), ATP production (F), Mitochondria numbers (G), mitochondrial membrane potential (H), and ROS (I). J, Pyruvate partially rescues RhoA deficiency-induced defect in T cell activation. Naïve CD4+ T cells were stimulated with anti-CD3/CD28 for 2 days, in the presence or absence of pyruvate (2 mM). The surface expression of CD25 was analyzed by flow cytometry. n=4–8 mice per group. Results are representative of two (D–J) or three (A–C) independent experiments. Error bars represent SD. *P < .05, **P < .01.
FIG 2
FIG 2. RhoA deficiency has no effect on Th1 cell differentiation
A, RhoA deficiency has no effect on Stat1 activation. CD4+ naïve T cells were cultured with anti-CD3/CD28 for 0~17 h. Phosphorylated (p) and total Stat1 were examined by immunoblot. B, RhoA deficiency has no effect on T-bet expression. CD4+ naïve T cells were cultured under Th0 or Th1 conditions for 4 days and restimulated with PMA plus ionomycin for 5 h. T-Bet mRNA was analyzed by realtime PCR. C–F, RhoA deficiency has no effect on IFN-γ production. CD4+ naïve T cells were cultured with or without anti-CD3/CD28 for 2 days (C and D) or differentiated under Th0, Th1-, or Th2-skewed conditions for 4 days and restimulated with PMA plus ionomycin for 5 h (E and F). BD GolgiPlug™ was added at the last 2 h. The cells were collected for surface staining of CD4 and intracellular staining of IFN-γ. Percentages of IFN-γ +CD4+ T cells are shown in representative dot plots (C and E). Supernatants were collected from other sets of cultures without BD GolgiPlug™ for ELISA assays to detect IFN- γ secretion (D and F). CD4+ naïve T cells were pooled from 5–8 mice. Results are representative of three independent experiments. Error bars represent SD of triplicates.
FIG 3
FIG 3. RhoA deficiency impairs Th2 cell differentiation
A, RhoA deficiency inhibits Stat6 activation. CD4+ naïve T cells were cultured with anti-CD3/CD28 for 0~17 h. Phosphorylated (p) and total Stat6 were examined by immunoblot. B–D, RhoA deficiency suppresses IL-4Ra, NFATc1 and GATA3 expression. CD4+ naïve T cells were cultured under Th2 conditions for 24 h (B), or for 4 days and restimulated with PMA and ionomycin for 5 h (C and D). mRNA levels of IL-4Rα (B), NFATc1 (C) and GATA3 (D) were analyzed by real-time PCR. E–H, RhoA deficiency inhibits IL-4 production. CD4+ naïve T cells were cultured with or without anti-CD3/CD28 for 2 days (E and G) or differentiated under Th0, Th1-, or Th2-skewed conditions for 4 days and restimulated with PMA plus ionomycin for 5 h (F and H). BD GolgiPlug™ was added at the last 2 h. The cells were collected for surface staining of CD4 and intracellular staining of IL-4 (E and F). Percentages of IL-4+CD4+ T cells are shown in representative dot plots and mean percentages in histogram (E and F). Supernatants were collected from other sets of cultures without BD GolgiPlug™ for ELISA assays to detect IL-4 secretion (G and H). CD4+ naïve T cells were pooled from 5–8 mice. Results are representative of two (B) or three (A, C–H) independent experiments. Error bars represent SD of triplicates. **P < .05, **P < .01.
FIG 4
FIG 4. RhoA deficiency suppresses OVA-induced allergic airway inflammation
WT and RhoA−/− mice were immunized i.p. with OVA and then challenged with aerosolized OVA or PBS as control. Mice were sacrificed 24 h after the last challenge. A, Quantification of total cells (left), eosinophils (Eo), macrophages (Mφ), neutrophils (Neu), and lymphocytes (Lym) (right) in BAL fluids. B and C, Representative Kwik-Diff staining for BAL cytospins (B) and H&E staining of lung tissue sections (C). D, Cytokine levels in BAL fluids determined by ELISA. E, mRNA levels of IL-4, IL-5, IL-13, Eotaxin, MUC-5AC, Gob-5 and IFN-γ in lung tissue determined by real-time PCR. Data are normalized to an 18S reference and expressed as arbitrary units. F, OVA-specific IgE, IgM, IgG, IgG1 and IgG2a levels in sera of mice immunized and challenged with OVA. Similar levels of OVA-specific Ig subclasses were detected from OVA-immunized and PBS-challenged control groups and not shown. Results are representative of two independent experiments. Error bars represent SE of 8 mice. **P < .05, **P < .01.
FIG 5
FIG 5. The inhibitory effect of RhoA deficiency on allergic airway inflammation is caused by suppression of Th2 cell differentiation
A, OVA-induced Th2 cell differentiation is impaired in the absence of RhoA. Spleen cells from OVA-immunized WT and RhoA−/− mice were cultured in the presence or absence of OVA (100 µg/ml) for 3 days. IL-4 in the culture supernatants was detected by ELISA. B–E, Adoptively transferred WT Th2 cells can trigger allergic airway inflammation in RhoA−/− mice. WT Th2 cells were generated by culturing splenic CD4+ T cells from OVA-immunized WT mice with OVA plus irradiated APC. The cells were then injected into RhoA−/− mice. The mice were challenged with aerosolized OVA and sacrificed for analysis of allergic airway inflammation (B). Total BAL cells and differential cell counts (C), representative Kwik-Diff staining for BAL cytospins (D) and H&E staining of lung tissue sections (D), and mRNA expression of cytokines and Gob-5 in lung tissues (E) are shown. Error bars represent SE of 4 mice. **P < .01.
FIG 6
FIG 6. RhoA connects glycolysis to Th2 cell differentiation and allergic airway inflammation
A, RhoA deficiency impairs OXPHOS in both Th1 and Th2 cells, but glycolysis in Th2 but not Th1 cells. WT and RhoA−/− CD4+ naïve T cells were cultured under Th1- or Th2-skewed conditions for 4 days and restimulated with PMA plus ionomycin for 5 h, followed by measurement of OCR and ECAR. B, Pyruvate rescues RhoA deficiency-induced defect in Th2 cell differentiation. WT and RhoA−/− CD4+ naïve T cells were differentiated under Th2 conditions for 3 days, in the presence or absence of pyruvate (2 mM). IL-13 production was analyzed by ELISA. C, Inhibition of glycolysis impairs IL-4Rα, Gata-3, and IL-4 expression. WT CD4+ naïve T cells were cultured under Th2 conditions in the presence of PBS (Mock) or 2-DG (0.3 mM) for 24 h. mRNA levels of IL-4Rα, Gata-3, and IL-4 were analyzed by real-time PCR. D, Inhibition of glycolysis impairs IL-4 secretion. WT CD4+ naïve T cells were cultured under Th1 or Th2 conditions in the presence of Mock or 2-DG (0.3 mM). IFN-γ and IL-4 secretion were analyzed by ELISA. E–J, Inhibition of glycolysis impairs allergic airway inflammation. WT mice were injected i.p with 2-DG (1.5 g/kg) or PBS (Mock), starting 1 day before OVA immunization until 1 day before sacrifice as indicated (E). Total BAL cells and differential cell counts (F), representative Kwik-Diff staining for BAL cytospins (G) and H&E staining of lung tissue sections (H), levels of cytokines and eotaxin in BAL fluids (I), and/or mRNA expression of cytokines and MUC-5AC in lung tissues (J) are shown. Results are representative of two (A–D) independent experiments. Error bars represent SD of 4–10 mice (A–D) or SE of 4 mice (F, I and J). *P < .05, **P < .01.
FIG 7
FIG 7. ROCK acts downstream of RhoA to mediate T cell activation and Th2 cell differentiation and allergic airway inflammation
A and B, Inhibition of ROCK by fasudil impairs T cell activation, proliferation and Th2, but not Th1, cell differentiation. CD4+ naïve T cells pooled from 8 WT mice were stimulated with anti-CD3/CD28 for 2 days with or without fasudil (0~50 mM) (A), or differentiated under Th0, Th1 or Th2 conditions for 4 days and restimulated with PMA plus ionomycin for 5 h, in the presence of PBS (Mock) or fasudil (50 µM) throughout the culture (B). BrdU (10 µM) was added at the last 20 h (A). Cells were harvested for CD69, CD44, or BrdU staining and analyzed by flow cytometry (A). Cytokines in culture supernatants were determined by ELISA (A and B). C–G, Inhibition of ROCK by fasudil impairs allergic airway inflammation. WT mice were injected i.p. daily with fasudil (30 mg/kg) or PBS (Mock), starting 1 day before OVA immunization until 1 day before sacrifice (C). Total BAL cells and differential cell counts (D), representative Kwik-Diff staining for BAL cytospins (E), H&E staining of lung tissue sections (F), cytokine and eotaxin levels in BAL fluids (G) are shown. Results are representative of two independent experiments. Error bars represent SD of triplicates (A and B) or SE of 7–8 mice (D and G). *P < .05, **P < .01.
FIG 8
FIG 8. Administration of ROCK inhibitor fasudil after immunization has no effect on allergic airway inflammation
A, WT mice were immunized i.p. with OVA in alum on day 0 and day 7. On day 14 and 15, mice were challenged with aerosolized OVA or PBS. Fasudil (30 mg/kg) or PBS was injected i.p. at day 13, 14, and 15. Mice were sacrificed 24 h after the last challenge. B–D, Total BAL cells (B), cytokines in BAL fluid (C), and serum OVA-specific antibodies (D) are shown (n=4–5 mice per group). Results are representative of two independent experiments. Error bars represent SE.

Similar articles

Cited by

References

    1. Yang K, Shrestha S, Zeng H, Karmaus PW, Neale G, Vogel P, et al. T cell exit from quiescence and differentiation into Th2 cells depend on Raptor-mTORC1-mediated metabolic reprogramming. Immunity. 2013;39:1043–1056. - PMC - PubMed
    1. Kaiko GE, Horvat JC, Beagley KW, Hansbro PM. Immunological decision-making: how does the immune system decide to mount a helper T-cell response? Immunology. 2008;123:326–338. - PMC - PubMed
    1. Bowen H, Kelly A, Lee T, Lavender P. Control of cytokine gene transcription in Th1 and Th2 cells. Clin Exp Allergy. 2008;38:1422–1431. - PubMed
    1. Nakayama T, Yamashita M. The TCR-mediated signaling pathways that control the direction of helper T cell differentiation. Semin Immunol. 2010;22:303–309. - PubMed
    1. Shi LZ, Wang R, Huang G, Vogel P, Neale G, Green DR, et al. HIF1alpha-dependent glycolytic pathway orchestrates a metabolic checkpoint for the differentiation of TH17 and Treg cells. J Exp Med. 2011;208:1367–1376. - PMC - PubMed

Publication types