. 2015 Jul 23;523(7561):481-5.
doi: 10.1038/nature14592. Epub 2015 Jun 22.

Engineered CRISPR-Cas9 nucleases with altered PAM specificities

Affiliations

Engineered CRISPR-Cas9 nucleases with altered PAM specificities

Benjamin P Kleinstiver et al. Nature. .

Abstract

Although CRISPR-Cas9 nucleases are widely used for genome editing, the range of sequences that Cas9 can recognize is constrained by the need for a specific protospacer adjacent motif (PAM). As a result, it can often be difficult to target double-stranded breaks (DSBs) with the precision that is necessary for various genome-editing applications. The ability to engineer Cas9 derivatives with purposefully altered PAM specificities would address this limitation. Here we show that the commonly used Streptococcus pyogenes Cas9 (SpCas9) can be modified to recognize alternative PAM sequences using structural information, bacterial selection-based directed evolution, and combinatorial design. These altered PAM specificity variants enable robust editing of endogenous gene sites in zebrafish and human cells not currently targetable by wild-type SpCas9, and their genome-wide specificities are comparable to wild-type SpCas9 as judged by GUIDE-seq analysis. In addition, we identify and characterize another SpCas9 variant that exhibits improved specificity in human cells, possessing better discrimination against off-target sites with non-canonical NAG and NGA PAMs and/or mismatched spacers. We also find that two smaller-size Cas9 orthologues, Streptococcus thermophilus Cas9 (St1Cas9) and Staphylococcus aureus Cas9 (SaCas9), function efficiently in the bacterial selection systems and in human cells, suggesting that our engineering strategies could be extended to Cas9s from other species. Our findings provide broadly useful SpCas9 variants and, more importantly, establish the feasibility of engineering a wide range of Cas9s with altered and improved PAM specificities.


Conflict of interest statement

Conflict of interest statement: J.K.J. is a consultant for Horizon Discovery. J.K.J. has financial interests in Editas Medicine, Hera Testing Laboratories, Poseida Therapeutics, and Transposagen Biopharmaceuticals. J.K.J.’s interests were reviewed and are managed by Massachusetts General Hospital and Partners HealthCare in accordance with their conflict of interest policies.

Figures

Extended Data Figure 1
Extended Data Figure 1. Bacterial-based positive selection used to engineer altered PAM specificity variants of SpCas9
a, Expanded schematic of the positive selection from Fig. 1b (left panel), and validation that SpCas9 behaves as expected in the positive selection (right panel). b, Schematic of how the positive selection was adapted to select for SpCas9 variants that have altered PAM recognition specificities. A library of SpCas9 clones with randomized PAM-interacting (PI) domains (residues 1097-1368) is challenged by a selection plasmid that harbors an altered PAM. Variants that survive the selection by cleaving the positive selection plasmid are sequenced to determine the mutations that enable altered PAM specificity.
Extended Data Figure 2
Extended Data Figure 2. Amino acid sequences of clones that cleave target sites bearing alternate PAMs in the bacterial-based positive selection system
a, Sequences of variants that survived >10% when re-tested in the positive selection assay against an NGA PAM site (see Online Methods). Variants were selected from libraries containing randomly mutagenized PAM-interacting (PI) domains (residues 1097–1368) with or without a starting R1335Q mutation. Sequence differences compared with wild-type SpCas9 are highlighted. The histogram represents the number of changes at each position (not counting the starting R1335Q mutation). b, Sequences of variants that survived >10% when re-tested in the positive selection assay against a site containing an NGC PAM. Variants were selected from libraries containing randomly mutagenized PAM-interacting (PI) domains (residues 1097–1368) with starter mutation pairs of R1335E/T1337R or R1335T/T1337R. Sequence differences compared with wild-type SpCas9 (shown at the top) are highlighted. The histogram below illustrates the number of changes at each position (not counting starter mutations at R1335 or T1337).
Extended Data Figure 3
Extended Data Figure 3. Bacterial cell-based site-depletion assay for profiling the global PAM specificities of Cas9 nucleases
a, Expanded schematic illustrating the negative selection from Fig. 1d (left panel), and validation that wild-type SpCas9 behaves as expected in a screen of sites with functional (NGG) and non-functional (NGA) PAMs (right panel). b, Schematic of how the negative selection was used as a site-depletion assay to screen for functional PAMs by constructing negative selection plasmid libraries containing 6 randomized base pairs in place of the PAM. Selection plasmids that contain PAMs cleaved by a Cas9/sgRNA of interest are depleted while PAMs that are not cleaved (or poorly cleaved) are retained. The frequencies of the PAMs following selection are compared to their pre-selection frequencies in the starting libraries to calculate the post-selection PAM depletion value (PPDV). c, d, A cutoff for statistically significant PPDVs was established by plotting the PPDV of PAMs for catalytically inactive SpCas9 (dCas9) (grouped and plotted by their 2nd/3rd/4th positions) for the two randomized PAM libraries (c). A threshold of 3.36 standard deviations from the mean PPDV for the two libraries was calculated (red lines in (d)), establishing that any PPDV deviation below 0.85 is statistically significant compared to dCas9 treatment (red dashed line in (c)). The gray dashed line in (c) indicates a five-fold depletion in the assay (PPDV of 0.2).
Extended Data Figure 4
Extended Data Figure 4. Concordance between the site-depletion assay and EGFP disruption activity
Data points represent the average EGFP disruption of the two NGAN and NGNG PAM sites for the VQR and EQR variants (Fig. 1g) plotted against the mean PPDV observed for library 1 and 2 (Fig. 1f) for the corresponding PAM. The red dashed line indicates PAMs that are statistically significantly depleted (PPDV of 0.85, see Extended Data Fig. 3c), and the gray dashed line represents five-fold depletion (PPDV of 0.2). Mean values are plotted with the 95% confidence interval.
Extended Data Figure 5
Extended Data Figure 5. Structural and functional roles of D1135, G1218, and T1337 in PAM recognition by SpCas9
a, Structural representations of the six residues implicated in PAM recognition. The left panel illustrates the proximity of D1135 to S1136, a residue that makes a water-mediated, minor groove contact to the 3rd base position of the PAM. The right panel illustrates the proximity of G1218, E1219, and T1337 to R1335, a residue that makes a direct, base-specific major groove contact to the 3rd base position of the PAM. Angstrom distances indicated by yellow dashed lines; non-target strand guanine bases dG2 and dG3 of the PAM are shown in blue; other DNA bases shown in orange; water molecules shown in red; images generated using PyMOL from PDB:4UN3. b, Mutational analysis of six residues in SpCas9 that are implicated in PAM recognition. Clones containing one of three types of mutations at each position were tested for EGFP disruption with two sgRNAs targeted to sites harboring NGG PAMs. For each position, we created an alanine substitution and two non-conservative mutations. S1136 and R1335 were previously reported to mediate contacts to the 3rd guanine of the PAM, and D1135, G1218, E1219, and T1337 are reported in this study. EGFP disruption activities were quantified by flow cytometry; background control represented by the dashed red line; error bars represent s.e.m., n = 3.
Extended Data Figure 6
Extended Data Figure 6. Insertion or deletion mutations induced by the VQR SpCas9 variant at endogenous zebrafish sites containing NGAG PAMs
For each target locus, the wild-type sequence is shown at the top with the protospacer highlighted in yellow (highlighted in green if present on the complementary strand) and the PAM is marked as red underlined text. Deletions are shown as red dashes highlighted in gray and insertions as lower case letters highlighted in blue. The net change in length caused by each indel mutation is shown on the right (+, insertion; –, deletion). Note that some alterations have both insertions and deletions of sequence and in these instances the alterations are enumerated in parentheses. The number of times each mutant allele was recovered (if more than once) is shown in brackets.
Extended Data Figure 7
Extended Data Figure 7. Endogenous genes targeted by wild-type and evolved variants of SpCas9
a, Sequences targeted by wild-type, VQR, and VRER SpCas9 are shown in blue, red, and green, respectively. Sequences of sgRNAs and primers used to amplify these loci for T7E1 are provided in Supplementary Tables 1 and 2. b, Mean mutagenesis frequencies detected by T7E1 for wild-type SpCas9 at eight target sites bearing NGG PAMs in the four different endogenous human genes (corresponding to the annotations in the top panel). Error bars represent s.e.m., n = 3.
Extended Data Figure 8
Extended Data Figure 8. Specificity profiles of the VQR and VRER SpCas9 variants determined using GUIDE-seq
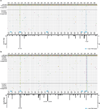
The intended on-target site is marked with a black square, and mismatched positions within off-target sites are highlighted. a, The specificity of the VQR variant was assessed in human cells by targeting endogenous sites containing NGA PAMs: EMX1 site 4, FANCF site 1, FANCF site 3, FANCF site 4, RUNX1 site 1, RUNX1 site 3, VEGFA site 1, and ZSCAN2. b, The specificity of the VRER variant was assessed in human cells by targeting endogenous sites containing NGCG PAMs: FANCF site 3, FANCF site 4, RUNX1 site 1, VEGFA site 1, and VEGFA site 2.
Extended Data Figure 9
Extended Data Figure 9. Activity differences between D1135E and wild-type SpCas9
a, Mutagenesis frequencies detected by T7E1 for wild-type and D1135E SpCas9 at six endogenous sites in human cells. Error bars represent s.e.m., n = 3; mean fold change in activity is shown. b, Titration of the amount of wild-type or D1135E SpCas9-encoding plasmid transfected for EGFP disruption experiments in human cells. The amount of sgRNA plasmid used for all of these experiments was fixed at 250 ng. Two sgRNAs targeting different EGFP sites were used; error bars represent s.e.m., n = 3. c, Targeted deep-sequencing of on- and off-target sites for 3 sgRNAs using wild-type and D1135E SpCas9. The on-target site is shown at the top, with off-target sites listed below highlighting mismatches to the on-target. Fold decreases in activity with D1135E relative to wild-type SpCas9 at off-target sites greater than the change in activity at the on-target site are highlighted in green; control indel levels for each amplicon are reported. d, Mean frequency of GUIDE-seq oligo tag integration at the on-target sites, estimated by restriction fragment length polymorphism analysis. Error bars represent s.e.m., n = 4. e, Mean mutagenesis frequencies at the on-target sites detected by T7E1 for GUIDE-seq experiments. Error bars represent s.e.m., n = 4. f, GUIDE-seq read-count differences between wild-type SpCas9 and D1135E at 3 endogenous human cell sites. The on-target site is shown at the top and off-target sites are listed below with mismatches highlighted. In the table, a ratio of off-target activity to on-target activity is compared between wild-type and D1135E to calculate the normalized fold-changes in specificity (with gains in specificity highlighted in green). For sites without detectable GUIDE-seq reads, a value of 1 has been assigned to calculate an estimated change in specificity (indicated in orange). Off-target sites analyzed by deep-sequencing in panel c are numbered to the left of the EMX1 site 3 and VEGFA site 3 off-target sites
Extended Data Figure 10
Extended Data Figure 10. Additional PAMs for St1Cas9 and SaCas9 and activities based on spacer lengths in human cells
a, PPDV scatterplots for St1Cas9 comparing the sgRNA complementarity lengths of 20 and 21 nucleotides obtained with a randomized PAM library for spacer 1 (top panel) or spacer 2 (bottom panel). PAMs were grouped and plotted by their 3rd/4th/5th/6th positions. The red dashed line indicates PAMs that are statistically significantly depleted (see Extended Data Fig. 3c) and the gray dashed line represents five-fold depletion (PPDV of 0.2). b, Table of PAMs with PPDVs of less than 0.2 for St1Cas9 under each of the four conditions tested. PAM numbering shown on the left is the same as in Fig. 4a. c, PPDV scatterplots for SaCas9 comparing the sgRNA complementarity lengths of 21 and 23 nucleotides obtained with a randomized PAM library for spacer 1 (top panel) or spacer 2 (bottom panel). PAM were grouped and plotted by their 3rd/4th/5th/6th positions. The red and gray dashed lines are the same as in (a). d, Table of PAMs with PPDVs of less than 0.2 for SaCas9 under each of the four conditions tested. PAM numbering is the same as in Fig. 4b. e, f, Human cell activity of St1Cas9 and SaCas9 across various spacer lengths via EGFP disruption (panel e, data from Figs. 4d, 4e) and endogenous gene mutagenesis detected by T7E1 (panel f, data from Figs. 4f, 4g). Activity for all replicates shown (n = 3 or 4); bars illustrate mean and 95% confidence interval; number of sites per spacer length indicated.
Figure 1
Figure 1. Evolution and characterization of SpCas9 variants with altered PAM specificities
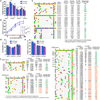
a, Activity of wild-type and mutant SpCas9s assessed via U2OS human cell-based EGFP disruption. Frequencies were quantified by flow cytometry; error bars represent s.e.m., n = 3; mean level of background EGFP loss represented by the dashed red line for this and subsequent panels (c, g, h, and j). b, Schematic of the positive selection assay (see also Extended Data Fig. 1). c, Combinatorial assembly and human cell testing of mutations obtained from the positive selection for SpCas9 variants that can cleave a target site containing an NGA PAM, using the EGFP disruption assay. d, Schematic of the negative selection assay, adapted to profile Cas9 PAM specificity by generating a library of plasmids that contain a randomized sequence adjacent to the 3’ end of the protospacer (see also Extended Data Fig. 3b). e, Scatterplot of the post-selection PAM depletion values (PPDVs) of wild-type SpCas9 with two randomized PAM libraries (each with a different protospacer). PAMs are plotted by their 2nd/3rd/4th positions. The red dashed line indicates statistically significant depletion (obtained from a dCas9 control experiment, see Extended Data Fig. 3c), and the gray dashed line represents five-fold depletion (PPDV of 0.2). f, PPDV scatterplots for the VQR and EQR variants. g, EGFP disruption frequencies for wild-type, VQR, and EQR SpCas9 on sites with NGAN and NGNG PAMs. h, Combinatorial assembly and human cell testing of mutations obtained from the positive selection for SpCas9 variants that can cleave a target site containing an NGC PAM, using the EGFP disruption assay. i, PPDV scatterplot for the VRER variant. j, EGFP disruption frequencies for wild-type and VRER SpCas9 on sites with NGCN and NGNG PAMs.
Figure 2
Figure 2. SpCas9 PAM variants robustly modify endogenous sites in zebrafish embryos and human cells
a, Mutagenesis frequencies in zebrafish embryos induced by wild-type or VQR SpCas9 at endogenous gene sites bearing NGAG PAMs. Mutation frequencies were determined using the T7E1 assay; n.d., not detectable by T7E1; error bars represent s.e.m., n = 5 to 9 embryos. b, Endogenous gene disruption activity of the VQR variant quantified by T7E1 assay. Error bars represent s.e.m., n = 3. c, Endogenous gene disruption activity of wild-type SpCas9 against NGA PAM sites quantified by T7E1 assay, where VQR data is re-presented from panel b for ease of comparison. Error bars represent s.e.m., n = 3. d, Mutation frequencies of wild-type, VRER, and VQR SpCas9 at endogenous human cell sites containing NGCG PAMs quantified by T7E1 assay; error bars represent s.e.m., n = 3. e, Representation of the number sites in the human genome with 20 nt spacers targetable by wild-type, VQR, and VRER SpCas9. The 5’-G is included for expression from a U6 promoter. f, Number of off-target cleavage sites identified by GUIDE-seq for the VQR and VRER variants using sgRNAs from panels b and d.
Figure 3
Figure 3. A D1135E mutation improves the PAM recognition and spacer specificity of SpCas9
a, PPDV scatterplots for wild-type and D1135E SpCas9 for the two randomized PAM libraries. PAMs are plotted by their 2nd/3rd/4th positions, and wild-type data is the same as shown in Fig. 1d for ease of comparison. The red dashed line indicates PAMs that are statistically significantly depleted (see Extended Data Fig. 3c), and the gray dashed line indicates five-fold depletion (PPDV of 0.2). b, EGFP disruption activities of wild-type and D1135E SpCas9 on sites that contain canonical and non-canonical PAMs in human cells. Disruption frequencies were quantified by flow cytometry; mean background level of EGFP loss represented by the dashed red line; error bars represent s.e.m., n = 3; fold change in activity is shown. c, Summary of targeted deep-sequencing data demonstrating specificity gains at off-target sites when using D1135E (see also Extended Data Fig. 9c). d, Summary of GUIDE-seq detected changes in specificity between wild-type and D1135E at off-target sites (see also Extended Data Fig. 9f). Estimated fold-gain in specificity at sites without read-counts for D1135E are not plotted (see Extended Data Fig. 8c).
Figure 4
Figure 4. Characterization of St1Cas9 and SaCas9 in bacteria and human cells
a, b, PPDV scatterplots for St1Cas9 (panel a) and SaCas9 (panel b), with PAMs plotted by their 3rd/4th/5th/6th positions. The red dashed line indicates PAMs that are statistically significantly depleted (Extended Data Fig. 3c), and the gray dashed line represents five-fold depletion (PPDV of 0.2); α, PAM previously predicted by a bioinformatic approach; β, PAMs previously identified under stringent experimental conditions; *, novel PAMs discovered in this study; γ, PAMs previously identified under moderate experimental conditions c, Survival percentages of St1Cas9 and SaCas9 in the bacterial positive selection when challenged with selection plasmids that harbor different target sites and PAMs. d, e, Mutation frequencies of St1Cas9 (panel d) and SaCas9 (panel e) quantified by T7E1 assay at sites in four endogenous human genes. Error bars represent s.e.m., n = 3; n.d., not detectable by T7E1.

Comment in

  • Engineering Cas9.
    Rusk N. Rusk N. Nat Methods. 2015 Aug;12(8):709. doi: 10.1038/nmeth.3514. Nat Methods. 2015. PMID: 26451425 No abstract available.

Similar articles

Cited by

References

    1. Sander JD, Joung JK. CRISPR-Cas systems for editing, regulating and targeting genomes. Nat Biotechnol. 2014;32:347–355. - PMC - PubMed
    1. Doudna JA, Charpentier E. Genome editing. The new frontier of genome engineering with CRISPR-Cas9. Science. 2014;346:1258096. - PubMed
    1. Mojica FJ, Diez-Villasenor C, Garcia-Martinez J, Almendros C. Short motif sequences determine the targets of the prokaryotic CRISPR defence system. Microbiology. 2009;155:733–740. - PubMed
    1. Shah SA, Erdmann S, Mojica FJ, Garrett RA. Protospacer recognition motifs: mixed identities and functional diversity. RNA Biol. 2013;10:891–899. - PMC - PubMed
    1. Jinek M, et al. A programmable dual-RNA-guided DNA endonuclease in adaptive bacterial immunity. Science. 2012;337:816–821. - PMC - PubMed

Publication types

MeSH terms

Substances

Associated data