

Conductance hysteresis in the voltage-dependent anion channel
- PMID: 26094068
- PMCID: PMC4531101
- DOI: 10.1007/s00249-015-1049-2
Conductance hysteresis in the voltage-dependent anion channel
Abstract
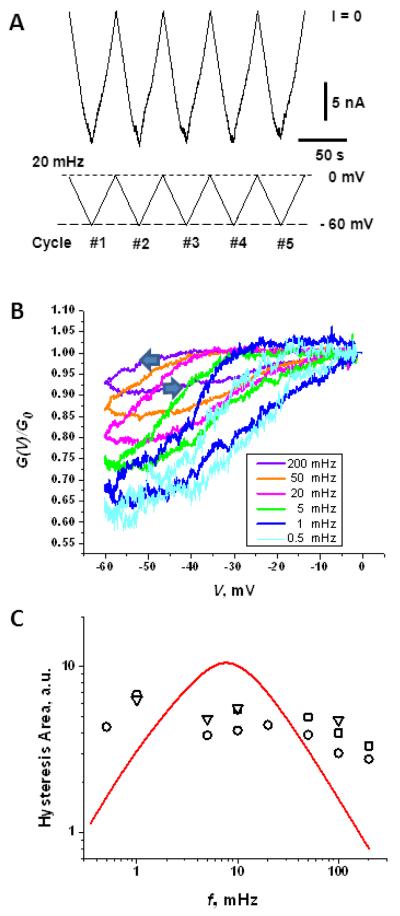
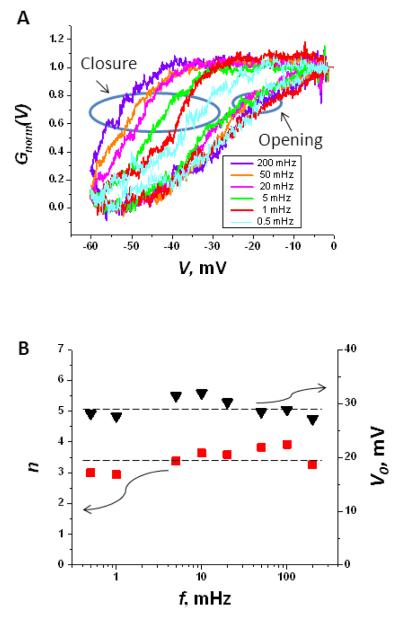
Hysteresis in the conductance of voltage-sensitive ion channels is observed when the transmembrane voltage is periodically varied with time. Although this phenomenon has been used in studies of gating of the voltage-dependent anion channel, VDAC, from the outer mitochondrial membrane for nearly four decades, full hysteresis curves have never been reported, because the focus was solely on the channel opening branches of the hysteresis loops. We studied the hysteretic response of a multichannel VDAC system to a triangular voltage ramp the frequency of which was varied over three orders of magnitude, from 0.5 mHz to 0.2 Hz. We found that in this wide frequency range the area encircled by the hysteresis curves changes by less than a factor of three, suggesting broad distribution of the characteristic times and strongly non-equilibrium behavior. At the same time, quasi-equilibrium two-state behavior is observed for hysteresis branches corresponding to VDAC opening. This enables calculation of the usual equilibrium gating parameters, gating charge and voltage of equipartitioning, which were found to be almost insensitive to the ramp frequency. To rationalize this peculiarity, we hypothesize that during voltage-induced closure and opening the system explores different regions of the complex free energy landscape, and, in the opening branch, follows quasi-equilibrium paths.
Figures
Similar articles
-
Regulation of Single-Channel Conductance of Voltage-Dependent Anion Channel by Mercuric Chloride in a Planar Lipid Bilayer.J Membr Biol. 2020 Aug;253(4):357-371. doi: 10.1007/s00232-020-00134-1. Epub 2020 Aug 4. J Membr Biol. 2020. PMID: 32748041
-
Probing tubulin-blocked state of VDAC by varying membrane surface charge.Biophys J. 2012 May 2;102(9):2070-6. doi: 10.1016/j.bpj.2012.03.058. Biophys J. 2012. PMID: 22824270 Free PMC article.
-
Ca2+-dependent control of the permeability properties of the mitochondrial outer membrane and voltage-dependent anion-selective channel (VDAC).J Biol Chem. 2006 Jun 23;281(25):17347-17358. doi: 10.1074/jbc.M600906200. Epub 2006 Apr 5. J Biol Chem. 2006. PMID: 16597621
-
Structure, gating and interactions of the voltage-dependent anion channel.Eur Biophys J. 2021 Mar;50(2):159-172. doi: 10.1007/s00249-021-01515-7. Epub 2021 Mar 29. Eur Biophys J. 2021. PMID: 33782728 Free PMC article. Review.
-
The VDAC channel: Molecular basis for selectivity.Biochim Biophys Acta. 2016 Oct;1863(10):2498-502. doi: 10.1016/j.bbamcr.2016.01.019. Epub 2016 Jan 27. Biochim Biophys Acta. 2016. PMID: 26826035 Review.
Cited by
-
Characterization of Inhibitory Capability on Hyperpolarization-Activated Cation Current Caused by Lutein (β,ε-Carotene-3,3'-Diol), a Dietary Xanthophyll Carotenoid.Int J Mol Sci. 2022 Jun 28;23(13):7186. doi: 10.3390/ijms23137186. Int J Mol Sci. 2022. PMID: 35806190 Free PMC article.
-
VDAC Gating Thermodynamics, but Not Gating Kinetics, Are Virtually Temperature Independent.Biophys J. 2020 Dec 15;119(12):2584-2592. doi: 10.1016/j.bpj.2020.10.039. Epub 2020 Nov 13. Biophys J. 2020. PMID: 33189678 Free PMC article.
-
Exploring lipid-dependent conformations of membrane-bound α-synuclein with the VDAC nanopore.Biochim Biophys Acta Biomembr. 2021 Sep 1;1863(9):183643. doi: 10.1016/j.bbamem.2021.183643. Epub 2021 May 7. Biochim Biophys Acta Biomembr. 2021. PMID: 33971161 Free PMC article.
-
The Effectiveness in Activating M-Type K+ Current Produced by Solifenacin ([(3R)-1-azabicyclo[2.2.2]octan-3-yl] (1S)-1-phenyl-3,4-dihydro-1H-isoquinoline-2-carboxylate): Independent of Its Antimuscarinic Action.Int J Mol Sci. 2021 Nov 17;22(22):12399. doi: 10.3390/ijms222212399. Int J Mol Sci. 2021. PMID: 34830281 Free PMC article.
-
Lipid Headgroup Charge and Acyl Chain Composition Modulate Closure of Bacterial β-Barrel Channels.Int J Mol Sci. 2019 Feb 5;20(3):674. doi: 10.3390/ijms20030674. Int J Mol Sci. 2019. PMID: 30764475 Free PMC article.
References
-
- Andersson T. Exploring voltage-dependent ion channels in silico by hysteretic conductance. Mathematical Biosciences. 2010;226:16–27. - PubMed
-
- Arbing MA, Hanrahan JW, Coulton JW. Mutagenesis identifies amino acid residues in extracellular loops and within the barrel lumen that determine voltage gating of porin from Haemophilus influenzae type b. Biochemistry. 2001;40:14621–14628. - PubMed
-
- Bainbridge G, Gokce I, Lakey JH. Voltage gating is a fundamental feature of porin and toxin beta-barrel membrane channels. Febs Letters. 1998a;431:305–308. - PubMed
-
- Bainbridge G, Mobasheri H, Armstrong GA, Lea EJA, Lakey JH. Voltage-gating of Escherichia coli porin: A cystine-scanning mutagenesis study of loop 3. Journal of Molecular Biology. 1998b;275:171–176. - PubMed
-
- Banerjee K. Dynamic memory of a single voltage-gated potassium ion channel: A stochastic nonequilibrium thermodynamic analysis. Journal of Chemical Physics. 2015;142:185101. - PubMed
Publication types
MeSH terms
Substances
Grants and funding
LinkOut - more resources
Full Text Sources
Other Literature Sources
