Integrated Haematological Profiles of Redox Status, Lipid, and Inflammatory Protein Biomarkers in Benign Obesity and Unhealthy Obesity with Metabolic Syndrome
- PMID: 26090072
- PMCID: PMC4451994
- DOI: 10.1155/2015/490613
Integrated Haematological Profiles of Redox Status, Lipid, and Inflammatory Protein Biomarkers in Benign Obesity and Unhealthy Obesity with Metabolic Syndrome
Abstract
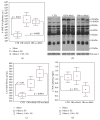
The pathogenesis of obesity (OB) and metabolic syndrome (MetS) implies free radical-, oxidized lipid- (LOOH-), and inflammatory cytokine-mediated altered pathways in target organs. Key elements of the transition from benign OB to unhealthy OB+MetS remain unclear. Here, we measured a panel of redox, antioxidant, and inflammation markers in the groups of OB patients (67 with, 45 without MetS) and 90 controls. Both OB groups displayed elevated levels of adipokines and heavy oxidative stress (OS) evidenced by reduced levels of glutathione, downregulated glutathione-S-transferase, increased 4-hydroxynonenal-protein adducts, reactive oxygen species, and membrane-bound monounsaturated fatty acids (MUFA). Exclusively in OB+MetS, higher-than-normal glutathione peroxidase activity, tumor necrosis factor-α, and other proinflammatory cytokines/chemokines/growth factors were observed; a combination of high adipokine plasminogen activator inhibitor-1 and MUFA was consistent with increased cardiovascular risk. The uncomplicated OB group showed features of adaptation to OS such as decreased levels of vitamin E, activated superoxide dismutase, and inhibited catalase, suggesting H2O2 hyperproduction. Proinflammatory cytokine pattern was normal, except few markers like RANTES, a suitable candidate for therapeutic approaches to prevent a setting of MetS by inhibition of LOOH-primed leukocyte chemotaxis/recruitment to target tissues.
Figures


Similar articles
-
Adipokines demonstrate the interacting influence of central obesity with other cardiometabolic risk factors of metabolic syndrome in Hong Kong Chinese adults.PLoS One. 2018 Aug 16;13(8):e0201585. doi: 10.1371/journal.pone.0201585. eCollection 2018. PLoS One. 2018. PMID: 30114249 Free PMC article.
-
Increased oxidative stress and inflammatory markers contrasting with the activation of the cholinergic anti-inflammatory pathway in patients with metabolic syndrome.Clin Biochem. 2021 Mar;89:63-69. doi: 10.1016/j.clinbiochem.2020.12.007. Epub 2020 Dec 14. Clin Biochem. 2021. PMID: 33333061
-
Uric acid best predicts metabolically unhealthy obesity with increased cardiovascular risk in youth and adults.Obesity (Silver Spring). 2013 Jan;21(1):E71-7. doi: 10.1002/oby.20061. Epub 2013 Jan 29. Obesity (Silver Spring). 2013. PMID: 23401248
-
Metabolic Syndrome as a Multifaceted Risk Factor for Oxidative Stress.Antioxid Redox Signal. 2017 Mar 20;26(9):445-461. doi: 10.1089/ars.2016.6756. Epub 2016 Jul 14. Antioxid Redox Signal. 2017. PMID: 27302002 Review.
-
[Inflammation biomarkers capacity in predicting the metabolic syndrome].Arq Bras Endocrinol Metabol. 2008 Apr;52(3):537-49. doi: 10.1590/s0004-27302008000300015. Arq Bras Endocrinol Metabol. 2008. PMID: 18506280 Review. Portuguese.
Cited by
-
Hypofibrinolytic State in Subjects with Type 2 Diabetes Mellitus Aggravated by the Metabolic Syndrome before Clinical Manifestations of Atherothrombotic Disease.Biomed Res Int. 2017;2017:6519704. doi: 10.1155/2017/6519704. Epub 2017 Feb 8. Biomed Res Int. 2017. PMID: 28271069 Free PMC article.
-
Fundamental role of pan-inflammation and oxidative-nitrosative pathways in neuropathogenesis of Alzheimer's disease.Am J Neurodegener Dis. 2016 Mar 1;5(1):1-28. eCollection 2016. Am J Neurodegener Dis. 2016. Retraction in: Am J Neurodegener Dis. 2016 Jul 06;5(3):152. PMID: 27073740 Free PMC article. Retracted. Review.
-
Lycium barbarum Reduces Abdominal Fat and Improves Lipid Profile and Antioxidant Status in Patients with Metabolic Syndrome.Oxid Med Cell Longev. 2017;2017:9763210. doi: 10.1155/2017/9763210. Epub 2017 Jun 8. Oxid Med Cell Longev. 2017. PMID: 28685012 Free PMC article.
-
Metabolic syndrome and the skin: a more than superficial association. Reviewing the association between skin diseases and metabolic syndrome and a clinical decision algorithm for high risk patients.Diabetol Metab Syndr. 2018 Feb 21;10:9. doi: 10.1186/s13098-018-0311-z. eCollection 2018. Diabetol Metab Syndr. 2018. PMID: 29483947 Free PMC article. Review.
-
Plasma antioxidants and oxidative stress status in obese women: correlation with cardiopulmonary response.PeerJ. 2020 May 19;8:e9230. doi: 10.7717/peerj.9230. eCollection 2020. PeerJ. 2020. PMID: 32477840 Free PMC article.
References
MeSH terms
Substances
LinkOut - more resources
Full Text Sources
Other Literature Sources
Medical
Miscellaneous

