

Motion Tracker: Camera-Based Monitoring of Bodily Movements Using Motion Silhouettes
- PMID: 26086771
- PMCID: PMC4472690
- DOI: 10.1371/journal.pone.0130293
Motion Tracker: Camera-Based Monitoring of Bodily Movements Using Motion Silhouettes
Erratum in
-
Correction: Motion Tracker: Camera-Based Monitoring of Bodily Movements Using Motion Silhouettes.PLoS One. 2015 Aug 19;10(8):e0136481. doi: 10.1371/journal.pone.0136481. eCollection 2015. PLoS One. 2015. PMID: 26287977 Free PMC article. No abstract available.
-
Correction: Motion Tracker: Camera-Based Monitoring of Bodily Movements Using Motion Silhouettes.PLoS One. 2015 Sep 17;10(9):e0138636. doi: 10.1371/journal.pone.0138636. eCollection 2015. PLoS One. 2015. PMID: 26378932 Free PMC article. No abstract available.
Abstract
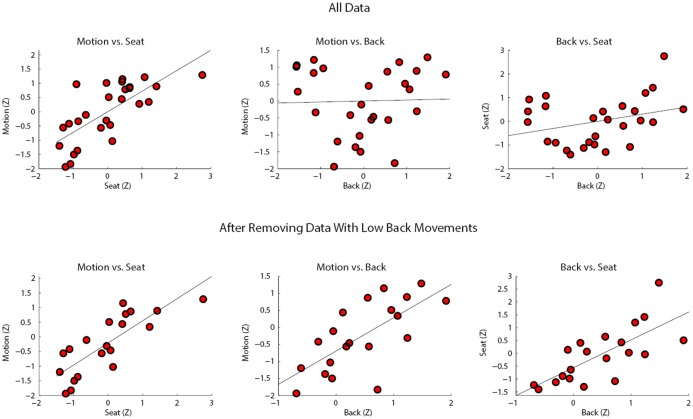
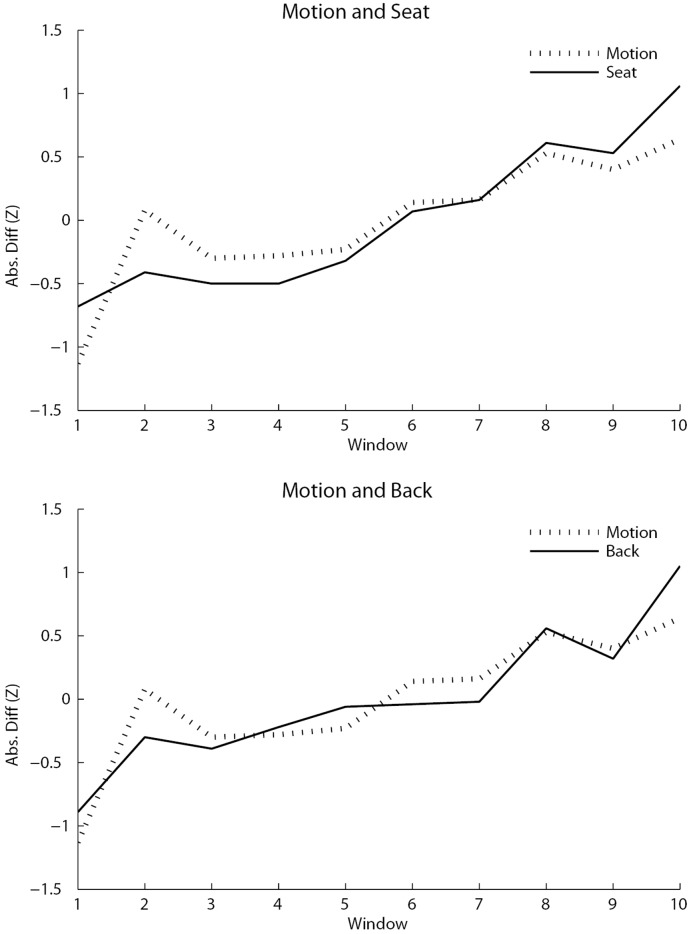
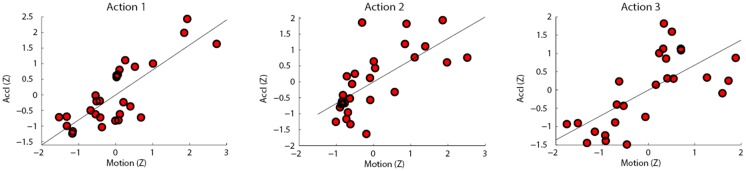
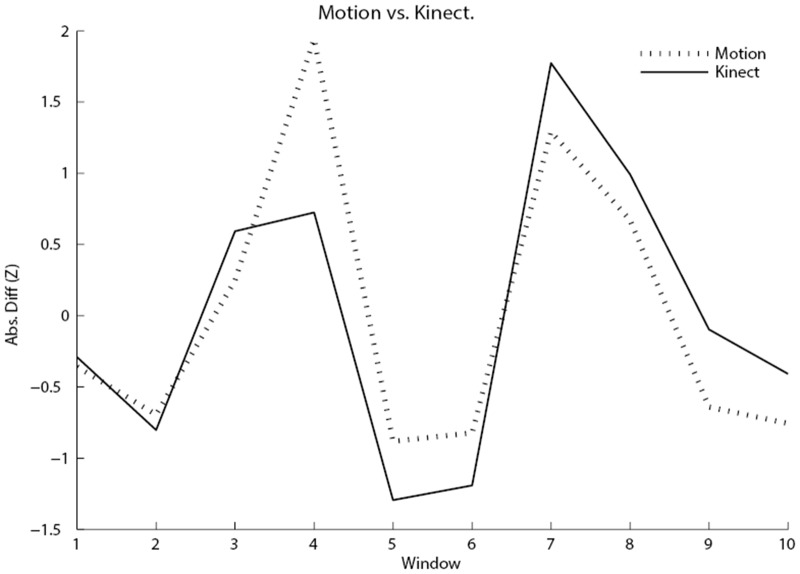
Researchers in the cognitive and affective sciences investigate how thoughts and feelings are reflected in the bodily response systems including peripheral physiology, facial features, and body movements. One specific question along this line of research is how cognition and affect are manifested in the dynamics of general body movements. Progress in this area can be accelerated by inexpensive, non-intrusive, portable, scalable, and easy to calibrate movement tracking systems. Towards this end, this paper presents and validates Motion Tracker, a simple yet effective software program that uses established computer vision techniques to estimate the amount a person moves from a video of the person engaged in a task (available for download from http://jakory.com/motion-tracker/). The system works with any commercially available camera and with existing videos, thereby affording inexpensive, non-intrusive, and potentially portable and scalable estimation of body movement. Strong between-subject correlations were obtained between Motion Tracker's estimates of movement and body movements recorded from the seat (r =.720) and back (r = .695 for participants with higher back movement) of a chair affixed with pressure-sensors while completing a 32-minute computerized task (Study 1). Within-subject cross-correlations were also strong for both the seat (r =.606) and back (r = .507). In Study 2, between-subject correlations between Motion Tracker's movement estimates and movements recorded from an accelerometer worn on the wrist were also strong (rs = .801, .679, and .681) while people performed three brief actions (e.g., waving). Finally, in Study 3 the within-subject cross-correlation was high (r = .855) when Motion Tracker's estimates were correlated with the movement of a person's head as tracked with a Kinect while the person was seated at a desk (Study 3). Best-practice recommendations, limitations, and planned extensions of the system are discussed.
Conflict of interest statement
Figures
Similar articles
-
MBT3D: Deep learning based multi-object tracker for bumblebee 3D flight path estimation.PLoS One. 2023 Sep 22;18(9):e0291415. doi: 10.1371/journal.pone.0291415. eCollection 2023. PLoS One. 2023. PMID: 37738269 Free PMC article.
-
A robust likelihood function for 3D human pose tracking.IEEE Trans Image Process. 2014 Dec;23(12):5374-89. doi: 10.1109/TIP.2014.2364113. IEEE Trans Image Process. 2014. PMID: 25347879
-
Video-based quantification of human movement frequency using pose estimation: A pilot study.PLoS One. 2021 Dec 20;16(12):e0261450. doi: 10.1371/journal.pone.0261450. eCollection 2021. PLoS One. 2021. PMID: 34929012 Free PMC article.
-
A review of vision-based motion analysis in sport.Sports Med. 2008;38(12):1025-43. doi: 10.2165/00007256-200838120-00006. Sports Med. 2008. PMID: 19026019 Review.
-
Video-Based Automatic Baby Motion Analysis for Early Neurological Disorder Diagnosis: State of the Art and Future Directions.Sensors (Basel). 2022 Jan 24;22(3):866. doi: 10.3390/s22030866. Sensors (Basel). 2022. PMID: 35161612 Free PMC article. Review.
Cited by
-
Quantitative Analysis of Multimodal Speech Data.J Phon. 2018 Nov;71:268-283. doi: 10.1016/j.wocn.2018.09.007. Epub 2018 Oct 19. J Phon. 2018. PMID: 30618477 Free PMC article.
-
Machine learning-based classification of the movements of children with profound or severe intellectual or multiple disabilities using environment data features.PLoS One. 2022 Jun 30;17(6):e0269472. doi: 10.1371/journal.pone.0269472. eCollection 2022. PLoS One. 2022. PMID: 35771797 Free PMC article.
-
Sit still and pay attention: Using the Wii Balance-Board to detect lapses in concentration in children during psychophysical testing.Behav Res Methods. 2019 Feb;51(1):28-39. doi: 10.3758/s13428-018-1045-4. Behav Res Methods. 2019. PMID: 29770907 Free PMC article.
-
A Self-Powered Portable Flexible Sensor of Monitoring Speed Skating Techniques.Biosensors (Basel). 2021 Apr 7;11(4):108. doi: 10.3390/bios11040108. Biosensors (Basel). 2021. PMID: 33916920 Free PMC article.
-
Correction: Motion Tracker: Camera-Based Monitoring of Bodily Movements Using Motion Silhouettes.PLoS One. 2015 Sep 17;10(9):e0138636. doi: 10.1371/journal.pone.0138636. eCollection 2015. PLoS One. 2015. PMID: 26378932 Free PMC article. No abstract available.
References
-
- Ramenzoni VC, Riley MA, Shockley K, Chiu CY. Postural responses to specific types of working memory tasks. Gait Posture. 2006;25: 368–373. - PubMed
-
- Pellecchia G. Dual-task training reduces impact of cognitive task on postural sway. J Mot Behav. 2007;37: 239–246. - PubMed
-
- Swan L, Otani H, Loubert P. Reducing postural sway by manipulating the difficulty levels of a cognitive task and a balance task. Gait Posture. 2007;26: 470–474. - PubMed
MeSH terms
Associated data
Grants and funding
LinkOut - more resources
Full Text Sources
Other Literature Sources
