

Regions outside of conserved PxxPxR motifs drive the high affinity interaction of GRB2 with SH3 domain ligands
- PMID: 26079855
- PMCID: PMC4558342
- DOI: 10.1016/j.bbamcr.2015.06.002
Regions outside of conserved PxxPxR motifs drive the high affinity interaction of GRB2 with SH3 domain ligands
Abstract
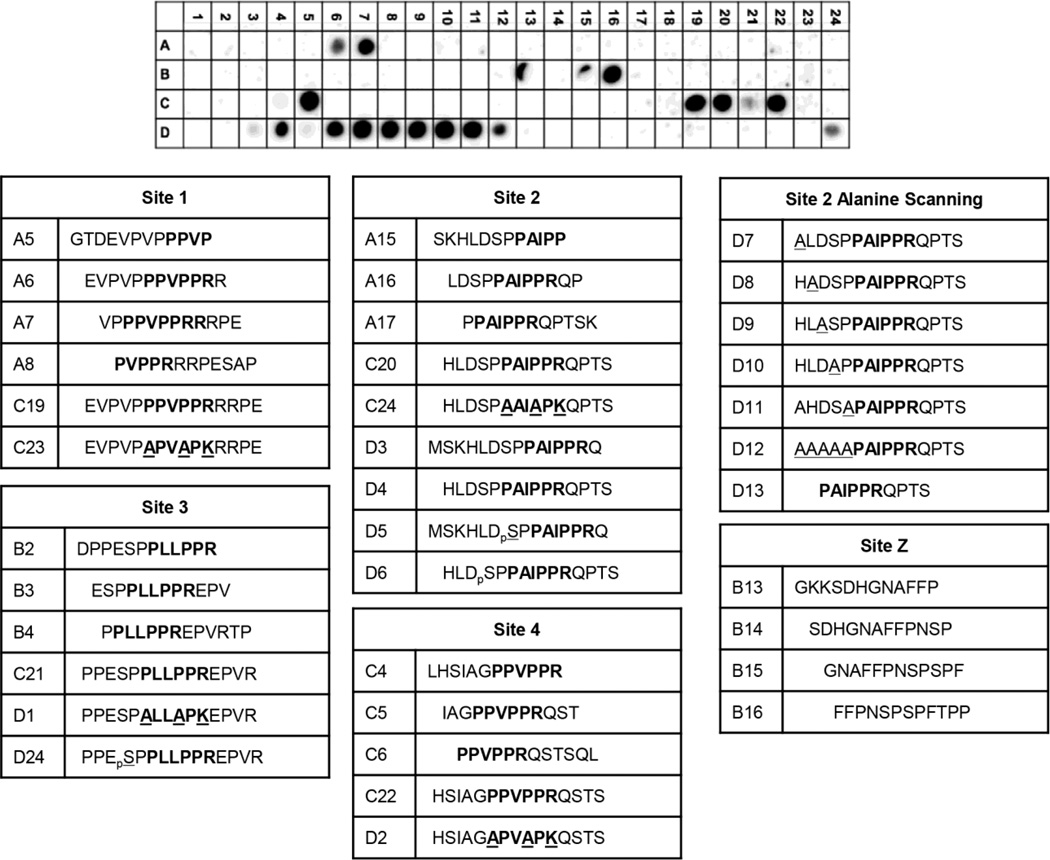
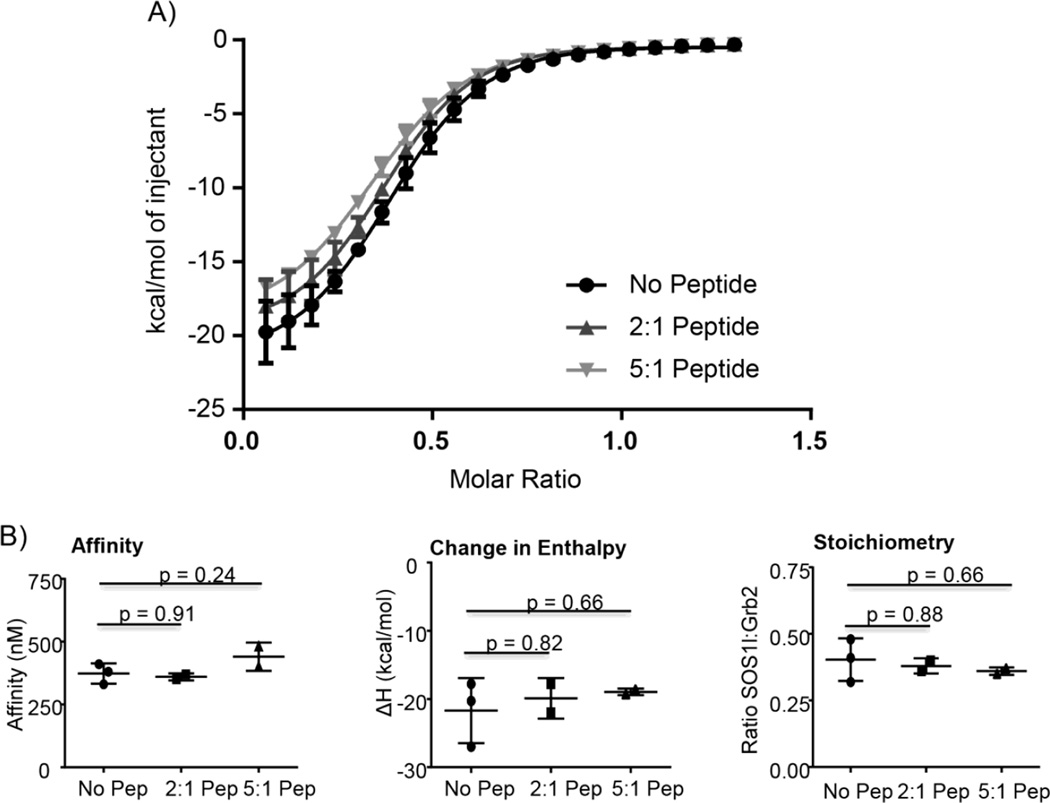
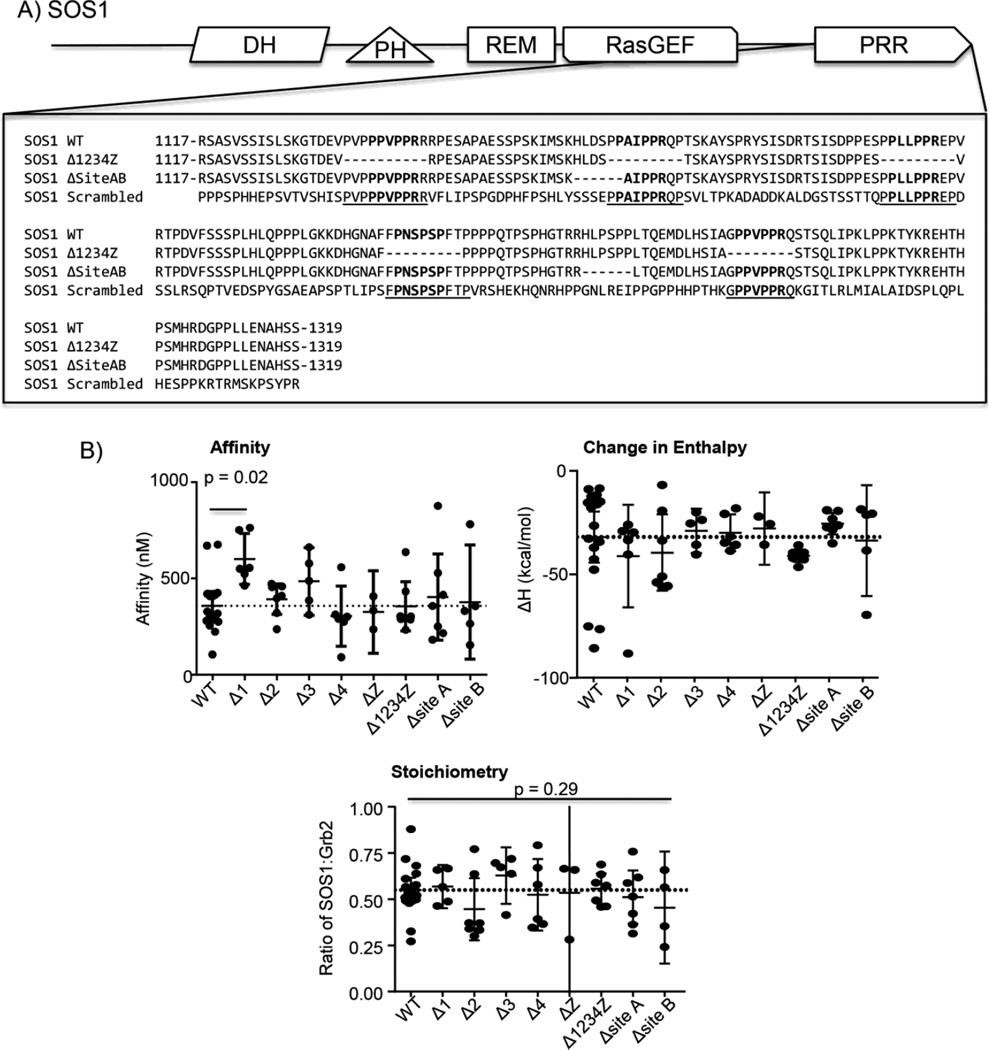
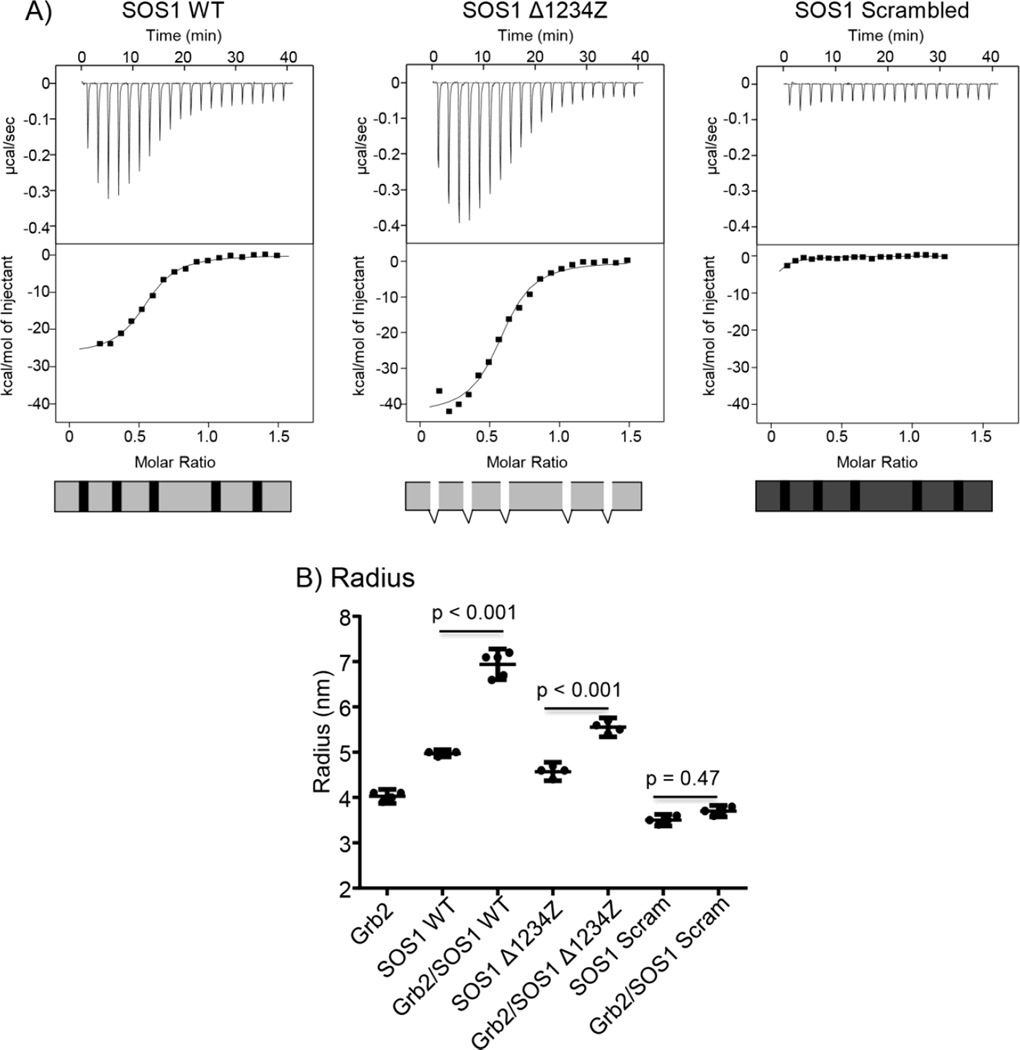
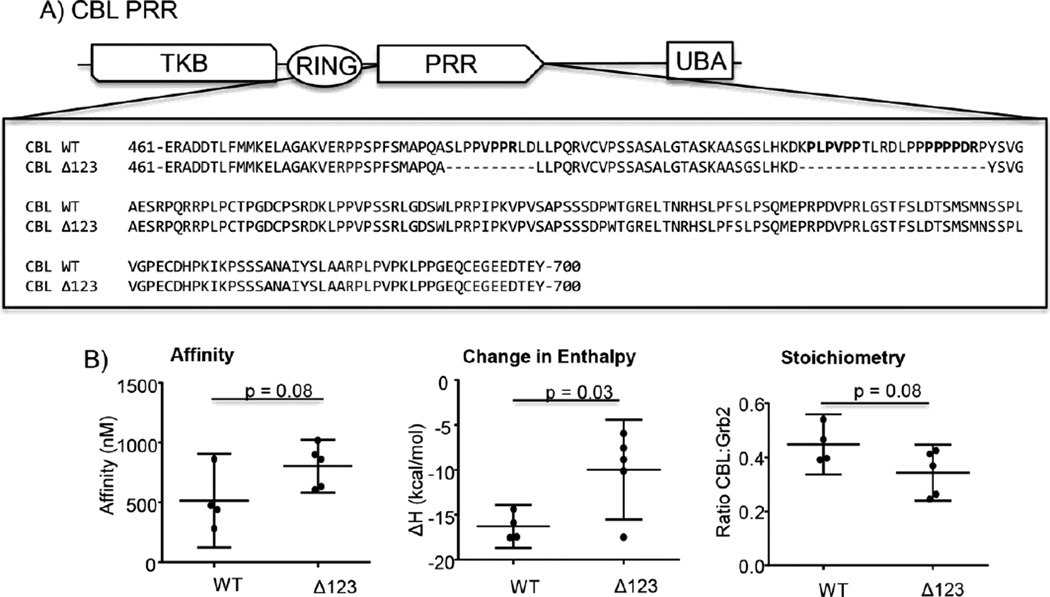
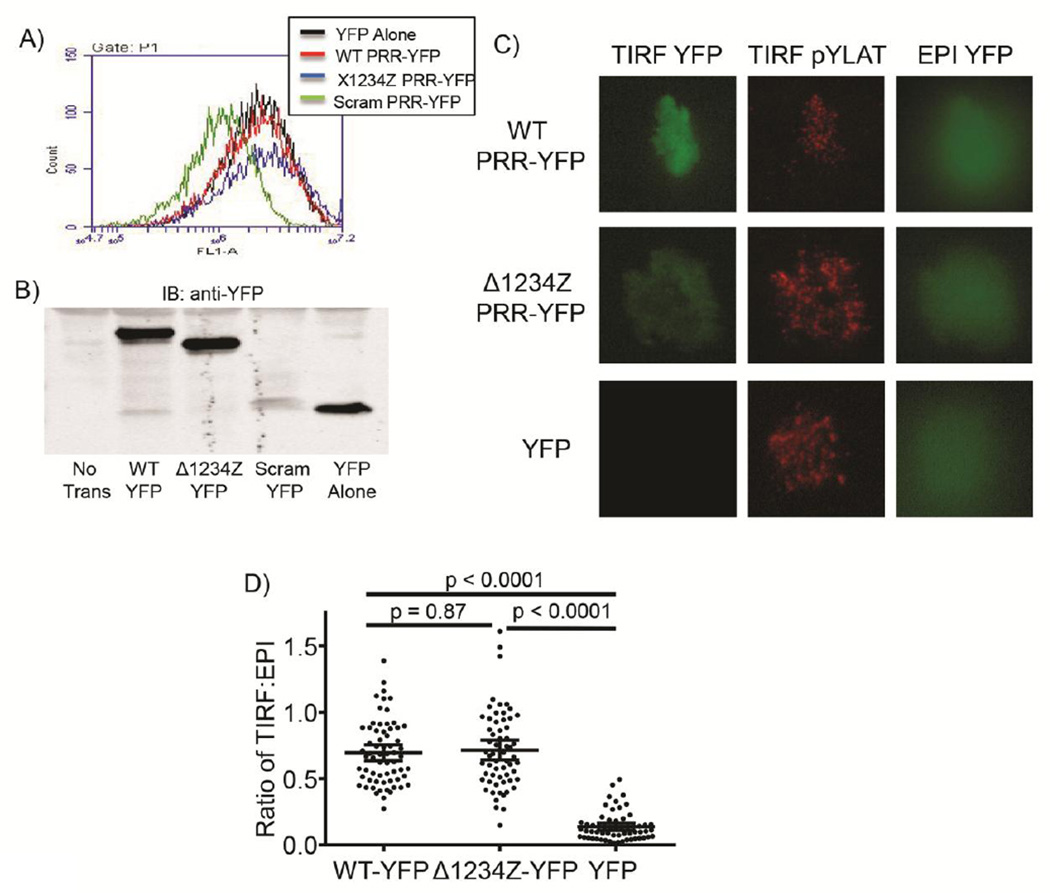
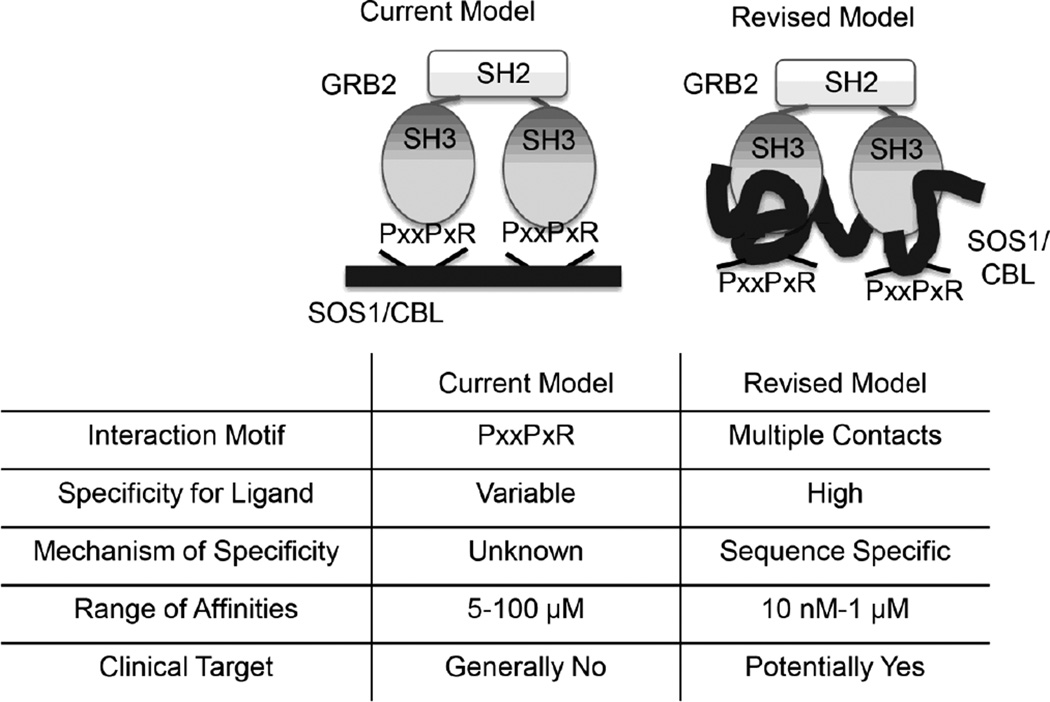
SH3 domains are evolutionarily conserved protein interaction domains that control nearly all cellular processes in eukaryotes. The current model is that most SH3 domains bind discreet PxxPxR motifs with weak affinity and relatively low selectivity. However, the interactions of full-length SH3 domain-containing proteins with ligands are highly specific and have much stronger affinity. This suggests that regions outside of PxxPxR motifs drive these interactions. In this study, we observed that PxxPxR motifs were required for the binding of the adaptor protein GRB2 to short peptides from its ligand SOS1. Surprisingly, PxxPxR motifs from the proline rich region of SOS1 or CBL were neither necessary nor sufficient for the in vitro or in vivo interaction with full-length GRB2. Together, our findings show that regions outside of the consensus PxxPxR sites drive the high affinity association of GRB2 with SH3 domain ligands, suggesting that the binding mechanism for this and other SH3 domain interactions may be more complex than originally thought.
Keywords: CBL; GRB2; SH3 domains; SOS1; Signal transduction.
Copyright © 2015 Elsevier B.V. All rights reserved.
Figures
Similar articles
-
High-Affinity Interactions of the nSH3/cSH3 Domains of Grb2 with the C-Terminal Proline-Rich Domain of SOS1.J Am Chem Soc. 2020 Feb 19;142(7):3401-3411. doi: 10.1021/jacs.9b10710. Epub 2020 Feb 4. J Am Chem Soc. 2020. PMID: 31970984 Free PMC article.
-
Structural basis of the differential binding of the SH3 domains of Grb2 adaptor to the guanine nucleotide exchange factor Sos1.Arch Biochem Biophys. 2008 Nov 1;479(1):52-62. doi: 10.1016/j.abb.2008.08.012. Epub 2008 Aug 26. Arch Biochem Biophys. 2008. PMID: 18778683
-
SH3 domains of Grb2 adaptor bind to PXpsiPXR motifs within the Sos1 nucleotide exchange factor in a discriminate manner.Biochemistry. 2009 May 19;48(19):4074-85. doi: 10.1021/bi802291y. Biochemistry. 2009. PMID: 19323566 Free PMC article.
-
The Role of Grb2 in Cancer and Peptides as Grb2 Antagonists.Protein Pept Lett. 2018 Feb 8;24(12):1084-1095. doi: 10.2174/0929866525666171123213148. Protein Pept Lett. 2018. PMID: 29173143 Review.
-
GRB2: A dynamic adaptor protein orchestrating cellular signaling in health and disease.Biochem Biophys Rep. 2024 Jul 29;39:101803. doi: 10.1016/j.bbrep.2024.101803. eCollection 2024 Sep. Biochem Biophys Rep. 2024. PMID: 39175664 Free PMC article. Review.
Cited by
-
SOS1 interacts with Grb2 through regions that induce closed nSH3 conformations.J Chem Phys. 2020 Jul 28;153(4):045106. doi: 10.1063/5.0013926. J Chem Phys. 2020. PMID: 32752665 Free PMC article.
-
High-Affinity Interactions of the nSH3/cSH3 Domains of Grb2 with the C-Terminal Proline-Rich Domain of SOS1.J Am Chem Soc. 2020 Feb 19;142(7):3401-3411. doi: 10.1021/jacs.9b10710. Epub 2020 Feb 4. J Am Chem Soc. 2020. PMID: 31970984 Free PMC article.
-
GRB2 dimerization mediated by SH2 domain-swapping is critical for T cell signaling and cytokine production.Sci Rep. 2023 Mar 2;13(1):3505. doi: 10.1038/s41598-023-30562-7. Sci Rep. 2023. PMID: 36864087 Free PMC article.
-
Molecular Dynamics model of peptide-protein conjugation: case study of covalent complex between Sos1 peptide and N-terminal SH3 domain from Grb2.Sci Rep. 2019 Dec 27;9(1):20219. doi: 10.1038/s41598-019-56078-7. Sci Rep. 2019. PMID: 31882608 Free PMC article.
-
Uncovering the BIN1-SH3 interactome underpinning centronuclear myopathy.Elife. 2024 Jul 12;13:RP95397. doi: 10.7554/eLife.95397. Elife. 2024. PMID: 38995680 Free PMC article.
References
-
- Kaneko T, Li L, Li SS. The SH3 domain--a family of versatile peptide- and protein-recognition module. Front Biosci. 2008;13:4938–4952. - PubMed
-
- Saksela K, Permi P. SH3 domain ligand binding: What's the consensus and where's the specificity? FEBS Lett. 2012;586:2609–2614. - PubMed
-
- Ladbury JE, Arold S. Searching for specificity in SH domains. Chem Biol. 2000;7:R3–R8. - PubMed
-
- Berry D, Nash P, Liu S, Pawson T, McGlade CJ. A high-affinity Arg-X-X-Lys SH3 binding motif confers specificity for the interaction between Gads and SLP-76 in T Cell signaling. Curr Biol. 2002;12:1336. - PubMed
Publication types
MeSH terms
Substances
Grants and funding
LinkOut - more resources
Full Text Sources
Other Literature Sources
Research Materials
Miscellaneous
