. 2015 Jun 16:6:7415.
doi: 10.1038/ncomms8415.

DJ-1 links muscle ROS production with metabolic reprogramming and systemic energy homeostasis in mice

Affiliations

DJ-1 links muscle ROS production with metabolic reprogramming and systemic energy homeostasis in mice

Sally Yu Shi et al. Nat Commun. .

Abstract

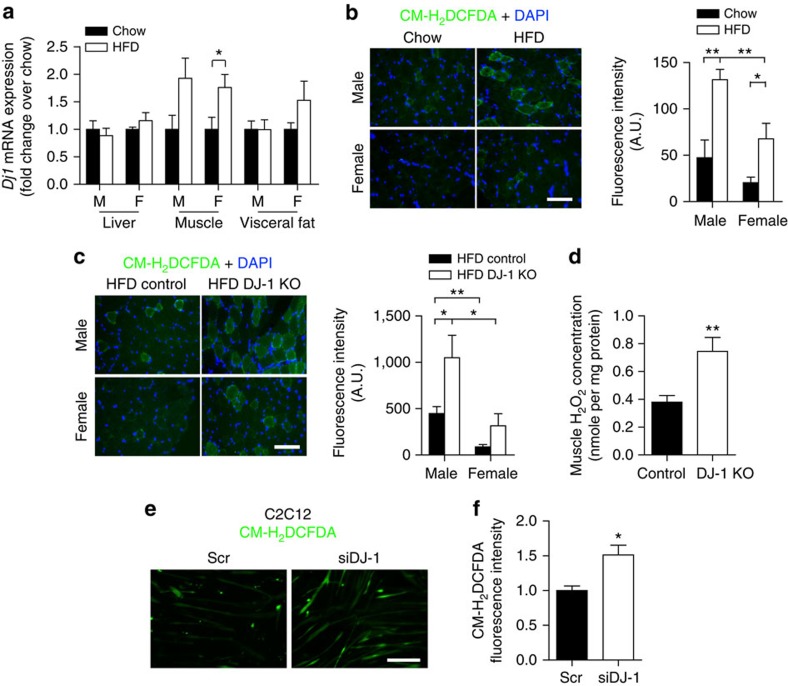
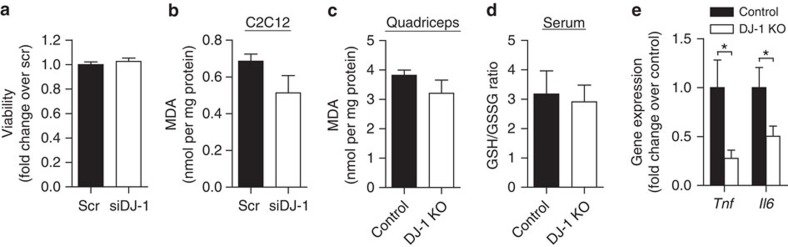
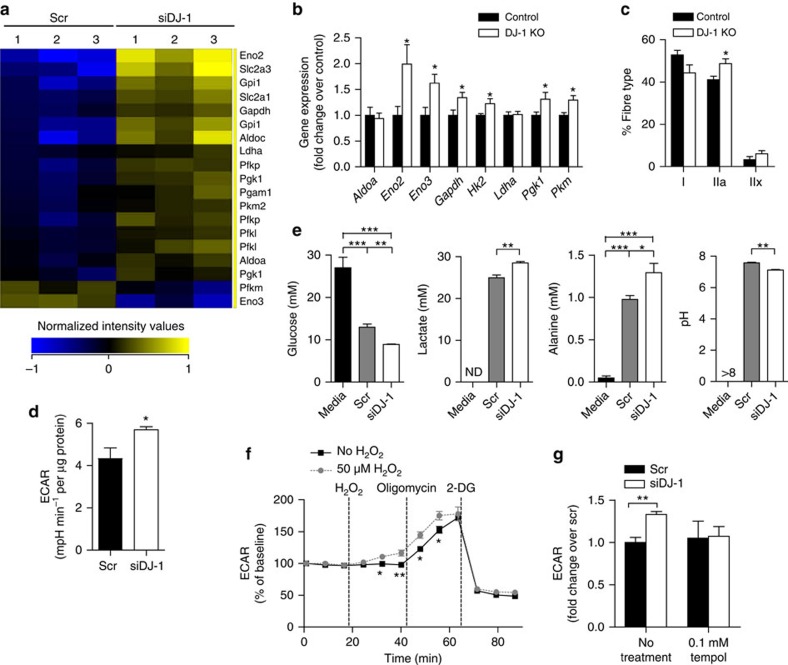
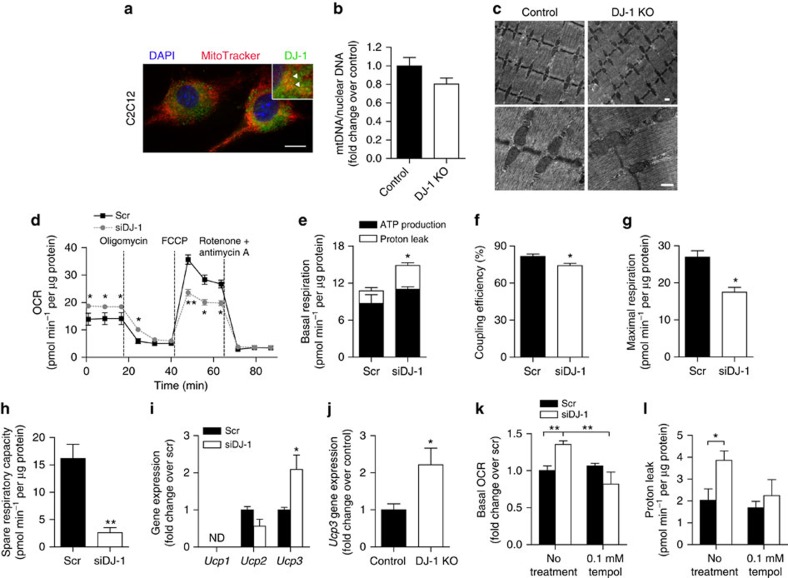
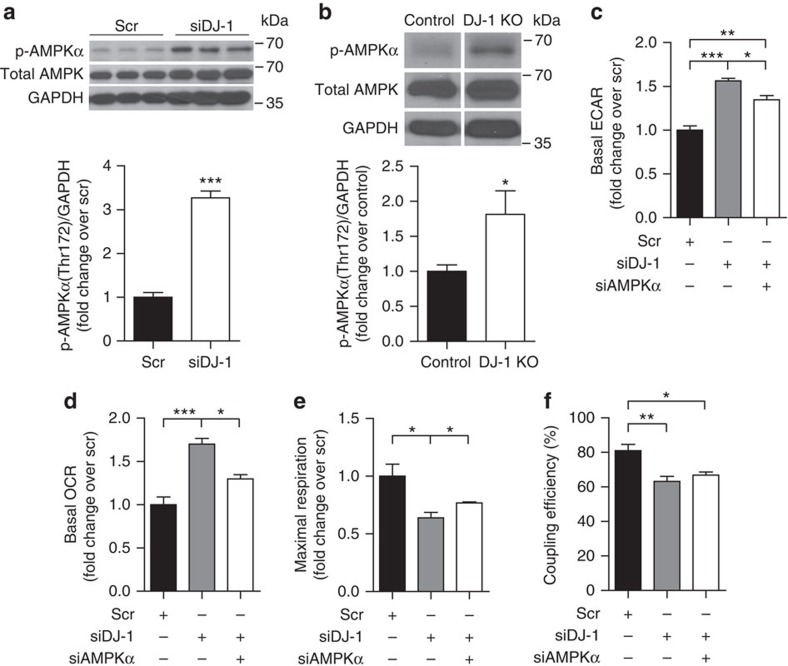
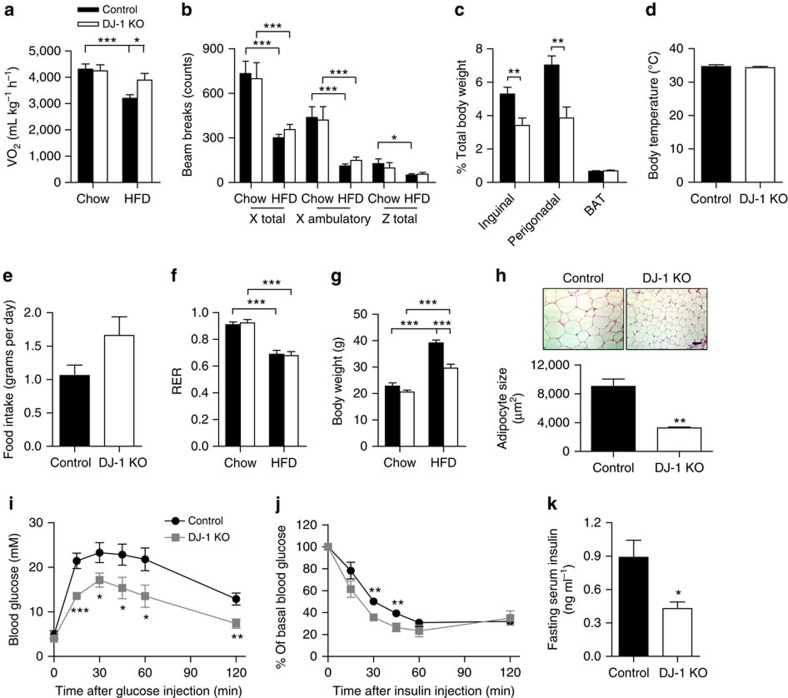
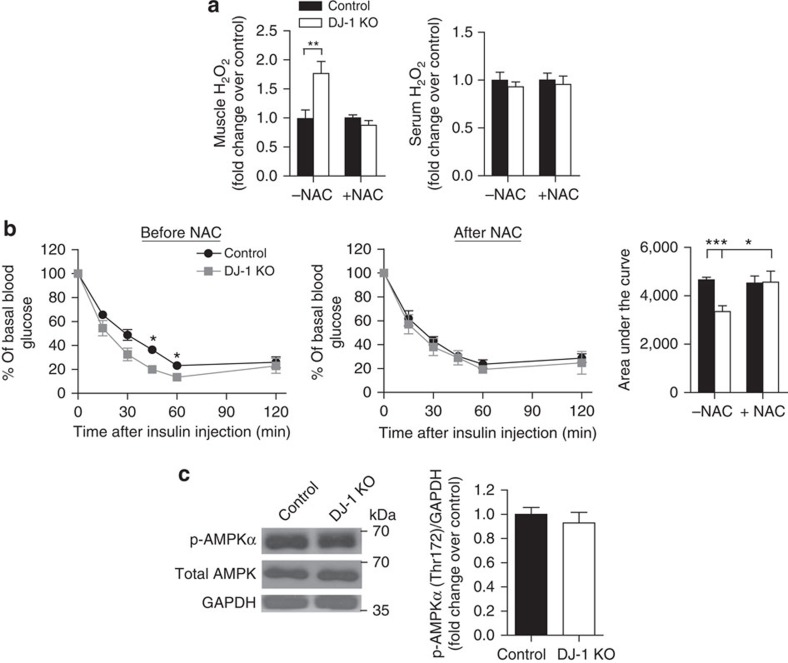
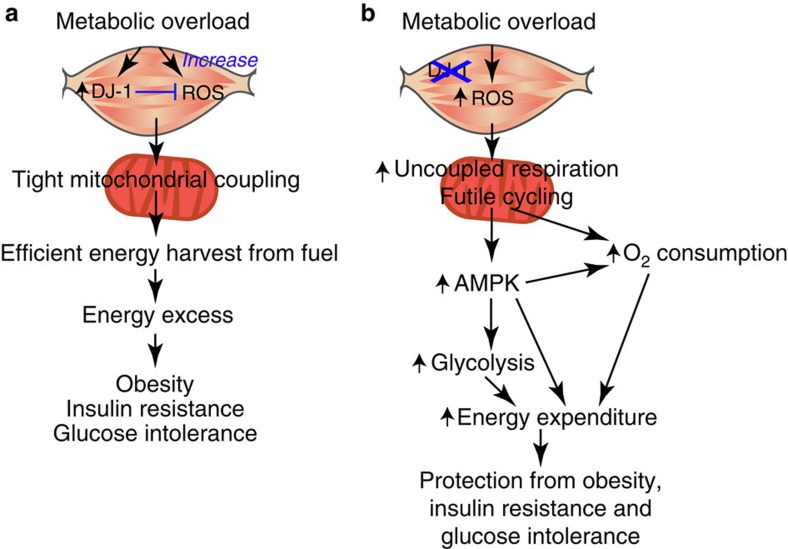
Reactive oxygen species (ROS) have been linked to a wide variety of pathologies, including obesity and diabetes, but ROS also act as endogenous signalling molecules, regulating numerous biological processes. DJ-1 is one of the most evolutionarily conserved proteins across species, and mutations in DJ-1 have been linked to some cases of Parkinson's disease. Here we show that DJ-1 maintains cellular metabolic homeostasis via modulating ROS levels in murine skeletal muscles, revealing a role of DJ-1 in maintaining efficient fuel utilization. We demonstrate that, in the absence of DJ-1, ROS uncouple mitochondrial respiration and activate AMP-activated protein kinase, which triggers Warburg-like metabolic reprogramming in muscle cells. Accordingly, DJ-1 knockout mice exhibit higher energy expenditure and are protected from obesity, insulin resistance and diabetes in the setting of fuel surplus. Our data suggest that promoting mitochondrial uncoupling may be a potential strategy for the treatment of obesity-associated metabolic disorders.


Figures

Figure 1
Figure 1. DJ-1 modulates ROS levels in mouse skeletal muscle.
(a) mRNA levels of Dj1 measured by quantitative RT–PCR in liver, quadriceps and perigonadal adipose tissue from C57BL/6 mice maintained on standard chow or fed a HFD for 3 months starting at 2 months of age (n=4–6 per group). F, females; M, males. (b,c) Representative micrographs of quadriceps cross-sections showing ROS levels assessed using CM-H2DCFDA and quantification of fluorescence intensity in (b) chow- and HFD-fed C57BL/6 mice and (c) HFD-fed control and DJ-1 KO mice (n=4–6 per group). Scale bar, 80 μm. (d) H2O2 levels measured using the Amplex Red reagent in quadriceps tissue from HFD-fed female mice and normalized to sample protein content (n=7 per group). (e) Representative micrographs showing ROS levels assessed using CM-H2DCFDA in C2C12 myotubes. Scr, scramble siRNA. Scale bar, 80 μm. (f) ROS levels assessed using CM-H2DCFDA in C2C12 myotubes measured using a fluorescence microplate reader. Results are presented as fold change relative to the scramble group from three independent experiments in triplicate. Results are presented as mean±s.e.m. according to the two-tailed unpaired Student's t-test. *P<0.05; **P<0.01.
Figure 2
Figure 2. DJ-1 deficiency does not induce overt oxidative stress in muscle.
(a) About 96 h after differentiation induction, C2C12 cell survival was assessed using an MTT assay. Results are from two independent experiments in five replicates. (b,c) Malondialdehyde (MDA) levels measured using a thiobarbituric acid reactive substances (TBARS) assay kit in (b) C2C12 myotubes after Dj1 knockdown (n=3 per group) and (c) quadriceps tissue from female mice fed a HFD for 3 months starting at 2 months of age (n=4 per group). Results are normalized to sample protein content. (d) Reduced glutathione (GSH) to oxidized glutathione (GSSG) ratio in serum from HFD-fed female mice (n=7 for control and 8 for DJ-1 KO). (e) mRNA expression of inflammatory cytokines in quadriceps from HFD-fed female mice measured by quantitative RT–PCR (n=9 per group). Results are presented as mean±s.e.m. according to the two-tailed unpaired Student's t-test. *P<0.05.
Figure 3
Figure 3. DJ-1 deficiency activates glycolysis in the skeletal muscle via ROS.
(a) Heat map representation of normalized signal intensity values for genes involved in glycolysis with a P value<0.05. Gene expression was analysed by microarray in C2C12 myotubes after Dj1 knockdown. Statistical significance was calculated using moderated student t-test followed by Benjamini–Hochberg false discovery rate correction in GeneSpring GX12.6 software. (b) mRNA expression of genes involved in glycolysis measured by quantitative RT–PCR in quadriceps from female mice fed a HFD for 3 months starting at 2 months of age (n=4–8 per group). (c) Fibre type distribution of soleus muscle from HFD-fed female mice (n=5 for control and 4 for DJ-1 KO). (d) Basal ECAR in C2C12 myotubes measured using the Seahorse flux analyzer and normalized to protein content (n=6 per group). Experiments were repeated at least three times. (e) Glucose, lactate, alanine and pH level in conditioned media from C2C12 myotubes (n=3 per group). ND, not detected. pH was >8 for the media group and was beyond the detection limit of the assay. (f) ECAR in C2C12 myotubes in response to 50 μM H2O2, 1 μM oligomycin and 100 mM 2-deoxyglucose (2-DG) (n=3 per group). (g) Basal ECAR in myotubes treated with 0.1 mM tempol (n=3 per group). Results are presented as mean±s.e.m. according to the two-tailed unpaired Student's t-test for bd,f,g, and one-way analysis of variance followed by Tukey's post-hoc test for (e). *P<0.05; **P<0.01; ***P<0.001.
Figure 4
Figure 4. DJ-1 deficiency induces muscle mitochondrial uncoupling via ROS.
(a) Representative micrograph of C2C12 myoblasts stained with MitoTracker and antibody against DJ-1. Scale bar, 10 μm. Inset: higher magnification image. Arrowhead, co-localization of DJ-1 with MitoTracker. (b) mtDNA copy number calculated as the ratio of Cox2 to Ppia levels measured by real-time quantitative PCR in quadriceps tissue. Female mice were fed a HFD for 3 months starting at 2 months of age (n=5 per group). (c) Transmission electron microscopy images from quadriceps tissue of HFD-fed female mice. Scale bar, 500 nm. (d) OCR in C2C12 myotubes measured using the Seahorse flux analyzer in response to 1 μM rotenone, 0.5 μM FCCP, and 1 μM rotenone and antimycin A (n=3 per group). Experiments were repeated at least three times. (e–h) ATP production, proton leak, coupling efficiency, maximal respiration and spare respiratory capacity calculated from (d). (i,j) mRNA expression of uncoupling proteins measured by quantitative RT–PCR in (i) C2C12 myotubes (n=3–6 per group) and (j) quadriceps tissue of HFD-fed female mice (n=6 per group). ND, not detected. (k) Basal OCR and (l) proton leak in myotubes treated with 0.1 mM tempol (n=3 per group). Results are presented as mean±s.e.m. according to the two-tailed unpaired Student's t-test. *P<0.05; **P<0.01.
Figure 5
Figure 5. Increased glycolytic activation in DJ-1-deficient cells is dependent on AMPK.
(a,b) Immunoblot analysis of phospho-AMPKα(Thr172) protein levels in (a) C2C12 myotubes (n=3 per group) and (b) quadriceps lysates from female mice fed a HFD for 3 months from 2 months of age (n=6 per group). For b, protein bands shown are from non-adjacent lanes on the same gel. Full scan images of immunoblots are shown in Supplementary Fig. 6e,f. (c) Basal ECAR, (d) basal OCR, (e) maximal respiration and (f) coupling efficiency measured using the Seahorse flux analyzer in C2C12 cells co-transfected with Dj1 and Prkaa2 siRNA (n=4 per group). Results are presented as mean±s.e.m. according to the two-tailed unpaired Student's t-test for (a) and (b), and one-way analysis of variance followed by Tukey's post-hoc test for cf. *P<0.05; **P<0.01; ***P<0.001.
Figure 6
Figure 6. DJ-1 deficiency confers metabolic protection in dietary and genetic models of obesity.
(a) Oxygen consumption (VO2) measured by indirect calorimetry, and (b) physical activity in chow- or HFD-fed female mice at 5 months of age (n=6 per group for chow-fed mice; n=13 per group for HFD-fed mice). HFD feeding was started at 2 months of age. (c) Relative weight of inguinal, perigonadal and interscapular brown (BAT) fat pads in HFD-fed female mice (n=11 for control and 8 for DJ-1 KO). (d) Rectal body temperature in HFD-fed female mice (n=6 for control and 4 for DJ-1 KO). (e) Food intake in HFD-fed mice, and (f) respiratory exchange ratio (RER) (n=6 per group for chow-fed mice; n=13 per group for HFD-fed mice). (g) Body weight in female mice (n=6 per group for chow-fed mice; n=12 per group for HFD-fed mice). (h) Haematoxylin and eosin staining of perigonadal fat sections from HFD-fed female mice and quantification of adipocyte size (n=5 per group). Scale bar, 80 μm. (i) Glucose tolerance test (GTT) (1 g kg−1; n=10 per group), (j) Insulin tolerance test (ITT) (1.5 U kg−1; n=12 per group) and (k) fasting serum insulin levels (n=9 per group) in HFD-fed female mice. Results are presented as mean±s.e.m. according to the two-tailed unpaired Student's t-test. *P<0.05; **P<0.01; ***P<0.001.
Figure 7
Figure 7. Attenuation of metabolic protection by NAC.
Two-month-old female DJ-1 KO mice and littermate controls were fed a HFD for 3 months and administered NAC in drinking water for 7 days (n=6 for control and 4 for DJ-1 KO). (a) H2O2 levels measured using the Amplex Red reagent in quadriceps homogenates or serum with and without NAC treatment. (b) ITT (1.5 U kg−1) and the corresponding area under the curve. (c) Immunoblot analysis of phospho-AMPKα(Thr172) protein levels in quadriceps lysates from NAC-treated mice. Full scan images of immunoblots are shown in Supplementary Fig. 9i. Results are presented as mean±s.e.m. according to the two-tailed unpaired Student's t-test. *P<0.05; **P<0.01; ***P<0.001.
Figure 8
Figure 8. Proposed role of skeletal muscle DJ-1 in metabolic regulation.
(a) In response to metabolic overload in the skeletal muscle, DJ-1 expression is upregulated. This prevents ROS overproduction and maintains tight coupling of mitochondrial respiration and ATP generation. Consequently, energy is harvested efficiently from nutrient sources, leading to energy excess and development of obesity and related metabolic complications. (b) Elevated ROS induced by DJ-1 deficiency increase uncoupled respiration and mitochondrial oxidation, thereby promoting futile cycle activity. This leads to the activation of AMPK, which enhances glycolysis and glucose utilization. These metabolic effects together increase energy expenditure in the skeletal muscle and confer resistance to obesity and type 2 diabetes.

Similar articles

Cited by

References

    1. Castresana J. & Saraste M. Evolution of energetic metabolism: the respiration-early hypothesis. Trends Biochem. Sci. 20, 443–448 (1995). - PubMed
    1. Neel J. V. Diabetes mellitus: a "thrifty" genotype rendered detrimental by "progress"? Am. J. Hum. Genet. 14, 353–362 (1962). - PMC - PubMed
    1. Zimmet P. & Thomas C. R. Genotype, obesity and cardiovascular disease--has technical and social advancement outstripped evolution? J. Intern. Med. 254, 114–125 (2003). - PubMed
    1. Rhee S. G. Cell signaling. H2O2, a necessay evil for cell signaling. Science 312, 1882–1883 (2006). - PubMed
    1. Powers S. K. & Jackson M. J. Exercise-induced oxidative stress: cellular mechanisms and impact on muscle force production. Physiol. Rev. 88, 1243–1276 (2008). - PMC - PubMed

Publication types

MeSH terms

Associated data