. 2015 Jun 15:6:7159.
doi: 10.1038/ncomms8159.

The tethering of chromatin to the nuclear envelope supports nuclear mechanics

Affiliations

The tethering of chromatin to the nuclear envelope supports nuclear mechanics

Sarah M Schreiner et al. Nat Commun. .

Abstract

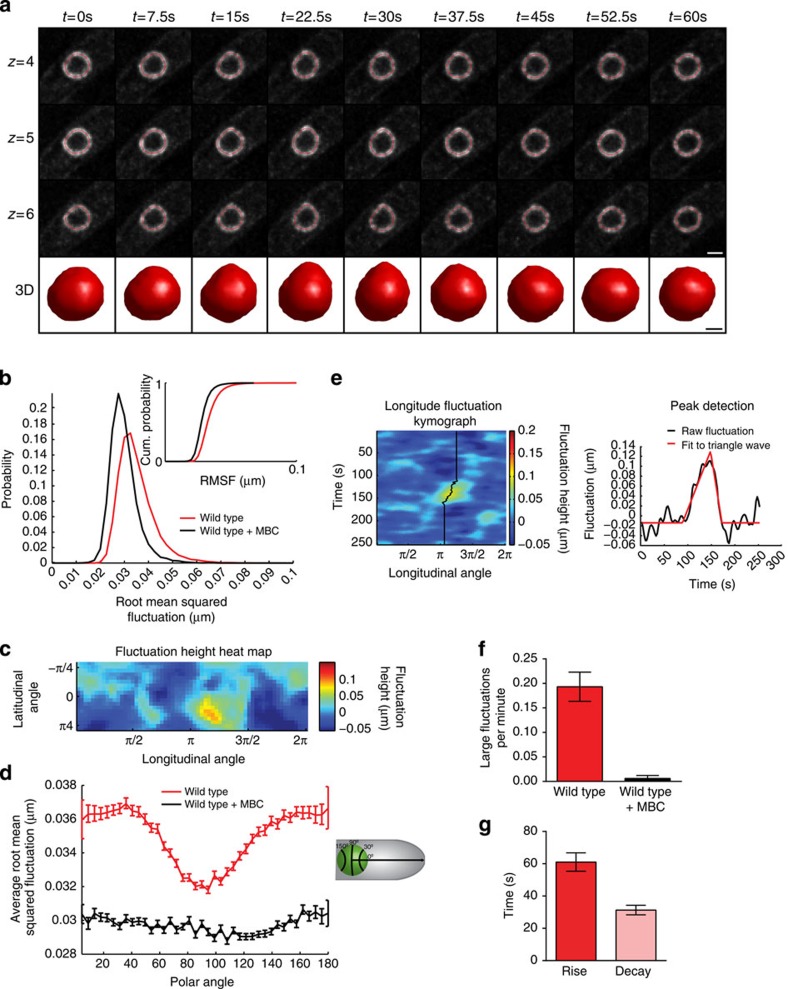
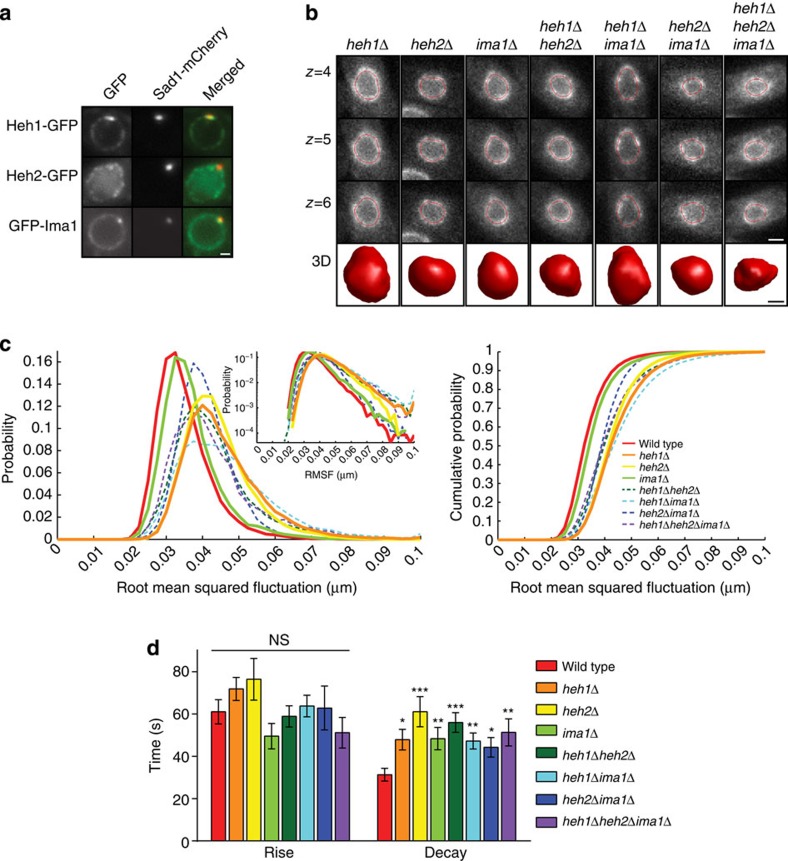
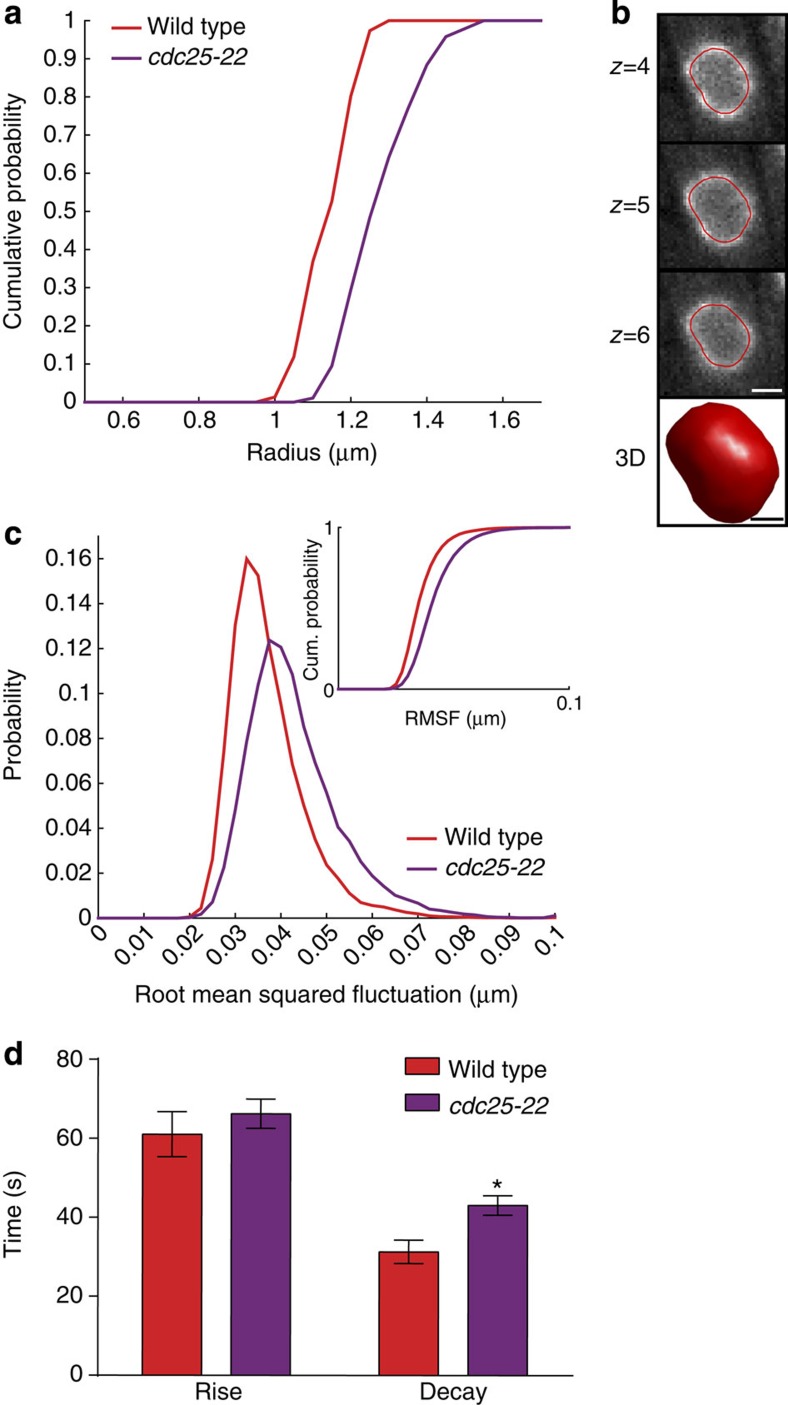
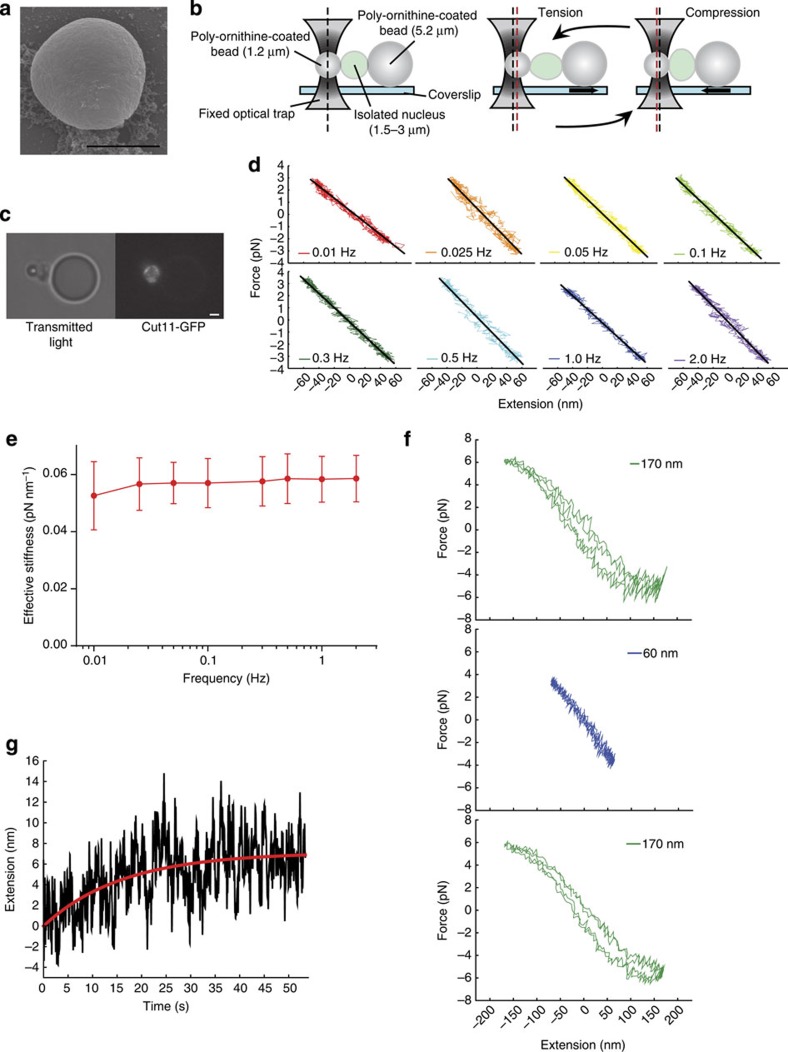
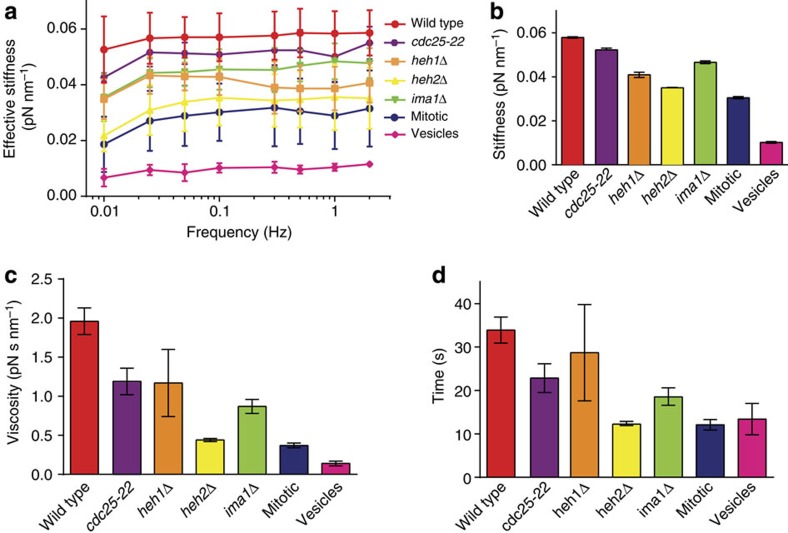
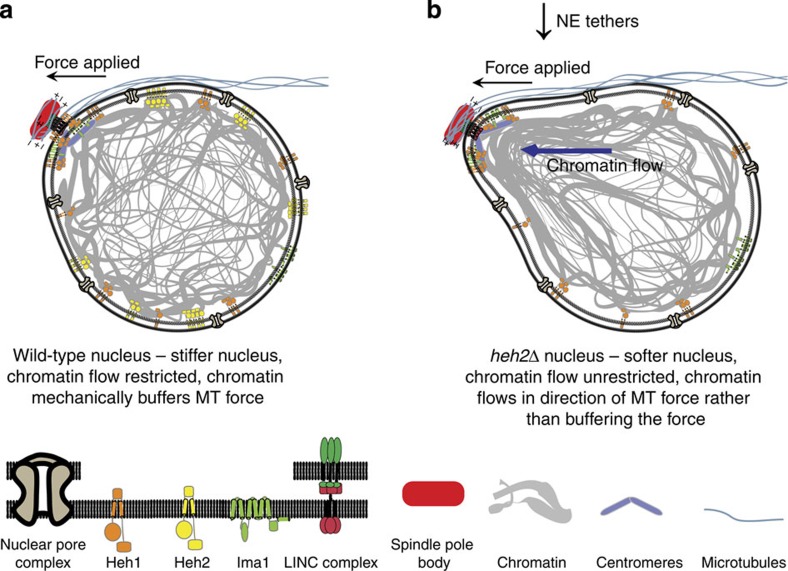
The nuclear lamina is thought to be the primary mechanical defence of the nucleus. However, the lamina is integrated within a network of lipids, proteins and chromatin; the interdependence of this network poses a challenge to defining the individual mechanical contributions of these components. Here, we isolate the role of chromatin in nuclear mechanics by using a system lacking lamins. Using novel imaging analyses, we observe that untethering chromatin from the inner nuclear membrane results in highly deformable nuclei in vivo, particularly in response to cytoskeletal forces. Using optical tweezers, we find that isolated nuclei lacking inner nuclear membrane tethers are less stiff than wild-type nuclei and exhibit increased chromatin flow, particularly in frequency ranges that recapitulate the kinetics of cytoskeletal dynamics. We suggest that modulating chromatin flow can define both transient and long-lived changes in nuclear shape that are biologically important and may be altered in disease.


Figures

Figure 1
Figure 1. Microtubules drive large nuclear envelope fluctuations in vivo.
(a) Contour surface of a representative wild-type nucleus. The 3D contour of the nucleus was determined at each time point. The 3D contour is projected onto three z-slice images separated by 0.4 μm about the centre of the nucleus over a 60-s time course (top). The fitted 3D contour at each time point is shown below. Scale bars, 1.6 μm (top) and 0.6 μm (bottom). (b) Probability distribution of the root mean square fluctuations (RMSF) for wild-type cells (red, n=77) and cells treated for 10 min with MBC to depolymerize microtubules (black, n=79). Inset: cumulative (cum.) probability distribution of the RMSF. (c) The 2D projection map of the 3D NE fluctuations for a representative wild-type nucleus at a given time point. Each pixel represents a fluctuation at each equally spaced angular position along the contour, π/4 latitudinal (polar) angles above and below the centre of the nucleus (y axis) and 2π longitudinal (azimuthal) angles around the contour (x axis). Fluctuation height is displayed as a heat map, with larger fluctuations in red and smaller fluctuations in dark blue. (d) The angular distribution of RMSF averaged over polar angles defined by the cell length in wild-type and wild-type+MBC cells. The coordinate map shows that a zero angle is defined in the direction of the cell length and 90° is in the direction of the cell width (right). (e) A kymograph was generated by concatenating the longitudinal pixel line at a fixed latitudinal angle about the centre of a fluctuation at each time point from the 2D fluctuation projection map series (left). The magnitude of the tracked fluctuation at each time point plotted over time (black) is fit with a single asymmetric triangle waveform to determine the rise and decay time (right). (f) Quantification of the number of large fluctuations per nuclei per minute in wild-type and wild-type+MBC nuclei. (g) Timescales of the rise and decay of microtubule-dependent fluctuations (n=31). Plots in d, f and g display mean±s.e.m. Data are from a minimum of three biological replicates.
Figure 2
Figure 2. Untethering chromatin from the nuclear envelope affects the nuclear response in vivo.
(a) Representative images of cells expressing Sad1-mCherry and either Heh1-GFP, Heh2-GFP or GFP-Ima1. Scale bar, 0.64 μm. (b) Representative 3D contours for each of the INM protein knockout strains as in Fig. 1a. Scale bars, 1.6 μm (top) and 0.6 μm (bottom). (c) Comparison of RMSF probability distribution (left) and cumulative probability distribution (right) between wild-type (n=77), heh1Δ (n=61), heh2Δ (n=58), ima1Δ (n=80), heh1Δheh2Δ (n=71), heh1Δima1Δ (n=44), heh2Δima1Δ (n=53) and heh1Δheh2Δima1Δ (n=34) nuclei. Wild-type and single mutants are plotted with solid lines and combinations of mutants are shown with dashed lines. Inset—RMSF probability distributions plotted on a log scale to emphasize the tail behaviour of each distribution. (d) The average rise time and decay time of microtubule-dependent fluctuations for all strains, measured as in Fig. 1g and plotted as the mean±s.e.m. Wild-type (n=31), heh1Δ (n=52), heh2Δ (n=28), ima1Δ (n=25), heh1Δheh2Δ (n=57), heh1Δima1Δ (n=50), heh2Δima1Δ (n=18) and heh1Δheh2Δima1Δ (n=31). NS, not significant, *P<0.05, **P<0.01, ***P<0.001 by Student's t-test. Data are from a minimum of three biological replicates.
Figure 3
Figure 3. Diluting chromatin tethers at the nuclear envelope moderately affects the nuclear response in vivo.
(a) Cumulative probability plot of nuclear radius for wild-type (red) and cdc25-22 (purple) cells. (b) Representative 3D contour for a cdc25-22 nucleus as in Fig. 1a. Scale bars, 1.6 μm (top) and 0.6 μm (bottom). (c) Comparison of RMSF probability distribution (top) and cumulative (cum.) probability distribution (inset) between wild-type (n=77) and cdc25-22 (n=95) nuclei. (d) The average rise time and decay time of large fluctuations for wild-type (n=31) and cdc25-22 (n=87) nuclei. Plotted as the mean±s.e.m. *P<0.05 by Student's t-test. Data are from a minimum of three biological replicates.
Figure 4
Figure 4. Wild-type nuclei are elastic with a minor viscous component.
(a) SEM image of an isolated, wild-type nucleus. Scale bar, 2.0 μm. (b) Diagram of the in vitro optical tweezers assay. An isolated nucleus is adhered to the side of a large (5.2 μm), poly-ornithine-coated bead immobilized on a coverslip. A small (1.2 μm), poly-ornithine-coated bead trapped within a stationary optical trap is attached to the nucleus on the other side. Rounds of tension and compression can be applied to the nucleus by moving the coverslip back and forth sinusoidally. The magnitude of the force applied to the nucleus is measured by the displacement (red vertical dashed line) of the small bead from the centre of the optical trap (black vertical dashed line). (c) Representative transmitted light image (left) and wide-field fluorescence image (right) of an isolated, wild-type nucleus expressing Cut11-GFP that is electrostatically attached between a large (5.2 μm) and small (1.2 μm) poly-ornithine-coated bead. Scale bar, 1.1 μm. (d) Representative force versus extension relationships and linear fits from one set of 50 nm amplitude oscillation frequencies on a wild-type nucleus. (e) Nuclear stiffness of wild-type nuclei from 50 nm (red, n=13) amplitude oscillations for a range of frequencies. Two rounds of oscillatory forces were applied at each frequency of a frequency series for each nucleus. Error bars represent s.d. (f) Force versus extension relationships for a single nucleus subjected to a set of 170 nm amplitude oscillations (top), followed by 60 nm amplitude oscillations (middle) and another set of 170 nm amplitude oscillations (bottom). (g) Representative creep response of a wild-type nucleus acquired via a force clamp, where the extension of the nucleus is constantly adjusted in a feedback loop to maintain a constant 4 pN tensile force. The creep response was fit to Δx(1−exp (−t/τ)). The best fit parameters for the trace shown are Δx=8.2±0.3 nm and τ=16±1.0 s, where the errors represent the square root of the inverse observed Fisher Information. See also Supplementary Fig. 4e.
Figure 5
Figure 5. Tethering of chromatin to the nuclear envelope defines nuclear stiffness and viscosity.
(a) Average nuclear stiffness of wild-type (red, n=13), cdc25-22 (purple, n=3), heh1Δ (orange, n=8), heh2Δ (yellow, n=7), ima1Δ (green, n=5) and mitotic nuclei (blue, n=4) or vesicles (pink, n=3) from 50 nm oscillations over the frequency series. (b) Stiffness of the nuclei derived from a viscoelastic fit of the frequency series in a. (c) Viscosity of the nuclei derived from the viscoelastic fit. (d) τ derived from the viscoelastic fit. Error bars in all panels represent s.d.
Figure 6
Figure 6. Chromatin tethering to the nuclear periphery impacts stiffness and attenuates chromatin flow.
(a,b) Biological model of the mechanical response of a wild-type nucleus (a) and a heh2Δ nucleus (b) to microtubule forces applied to the spindle pole body. In wild-type nuclei, tethering of chromatin to the nuclear envelope defines nuclear stiffness, preventing large fluctuations and attenuating chromatin flow into the fluctuation. In heh2Δ nuclei, the decrease in chromatin tethers leads to a softer nucleus and unrestricted chromatin flow into the fluctuation, leading to larger, longer-lived changes in nuclear shape.

Similar articles

Cited by

References

    1. Maniotis A. J., Chen C. S. & Ingber D. E. Demonstration of mechanical connections between integrins, cytoskeletal filaments, and nucleoplasm that stabilize nuclear structure. Proc. Natl Acad. Sci. USA 94, 849–854 (1997). - PMC - PubMed
    1. Graumann K., Irons S. L., Runions J. & Evans D. E. Retention and mobility of the mammalian lamin B receptor in the plant nuclear envelope. Biol. Cell 99, 553–562 (2007). - PubMed
    1. Rowat A. C. et al. Nuclear envelope composition determines the ability of neutrophil-type cells to passage through micron-scale constrictions. J. Biol. Chem. 288, 8610–8618 (2013). - PMC - PubMed
    1. Harada T. et al. Nuclear lamin stiffness is a barrier to 3D migration, but softness can limit survival. J. Cell Biol. 204, 669–682 (2014). - PMC - PubMed
    1. Isermann P. & Lammerding J. Nuclear mechanics and mechanotransduction in health and disease. Curr. Biol. 23, R1113–R1121 (2013). - PMC - PubMed

Publication types

LinkOut - more resources