DCIR2+ cDC2 DCs and Zbtb32 Restore CD4+ T-Cell Tolerance and Inhibit Diabetes
- PMID: 26070317
- PMCID: PMC4587633
- DOI: 10.2337/db14-1880
DCIR2+ cDC2 DCs and Zbtb32 Restore CD4+ T-Cell Tolerance and Inhibit Diabetes
Abstract
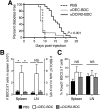
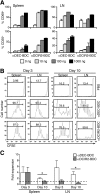
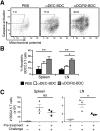
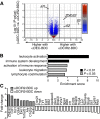
During autoimmunity, the normal ability of dendritic cells (DCs) to induce T-cell tolerance is disrupted; therefore, autoimmune disease therapies based on cell types and molecular pathways that elicit tolerance in the steady state may not be effective. To determine which DC subsets induce tolerance in the context of chronic autoimmunity, we used chimeric antibodies specific for DC inhibitory receptor 2 (DCIR2) or DEC-205 to target self-antigen to CD11b(+) (cDC2) DCs and CD8(+) (cDC1) DCs, respectively, in autoimmune-prone nonobese diabetic (NOD) mice. Antigen presentation by DCIR2(+) DCs but not DEC-205(+) DCs elicited tolerogenic CD4(+) T-cell responses in NOD mice. β-Cell antigen delivered to DCIR2(+) DCs delayed diabetes induction and induced increased T-cell apoptosis without interferon-γ (IFN-γ) or sustained expansion of autoreactive CD4(+) T cells. These divergent responses were preceded by differential gene expression in T cells early after in vivo stimulation. Zbtb32 was higher in T cells stimulated with DCIR2(+) DCs, and overexpression of Zbtb32 in T cells inhibited diabetes development, T-cell expansion, and IFN-γ production. Therefore, we have identified DCIR2(+) DCs as capable of inducing antigen-specific tolerance in the face of ongoing autoimmunity and have also identified Zbtb32 as a suppressive transcription factor that controls T cell-mediated autoimmunity.
© 2015 by the American Diabetes Association. Readers may use this article as long as the work is properly cited, the use is educational and not for profit, and the work is not altered.
Figures


Similar articles
-
CD8+ dendritic cell-mediated tolerance of autoreactive CD4+ T cells is deficient in NOD mice and can be corrected by blocking CD40L.J Leukoc Biol. 2014 Feb;95(2):325-36. doi: 10.1189/jlb.0113013. Epub 2013 Sep 30. J Leukoc Biol. 2014. PMID: 24082013 Free PMC article.
-
Targeting DEC-205-DCIR2+ dendritic cells promotes immunological tolerance in proteolipid protein-induced experimental autoimmune encephalomyelitis.Mol Med. 2018 May 3;24(1):17. doi: 10.1186/s10020-018-0017-6. Mol Med. 2018. PMID: 30134798 Free PMC article.
-
Loss of Zbtb32 in NOD mice does not significantly alter T cell responses.F1000Res. 2018 Mar 14;7:318. doi: 10.12688/f1000research.13864.2. eCollection 2018. F1000Res. 2018. PMID: 29707204 Free PMC article.
-
Targeted antigen delivery to DEC-205⁺ dendritic cells for tolerogenic vaccination.Rev Diabet Stud. 2012 Winter;9(4):305-18. doi: 10.1900/RDS.2012.9.305. Epub 2012 Dec 28. Rev Diabet Stud. 2012. PMID: 23804268 Free PMC article. Review.
-
Tolerogenic dendritic cells.Annu Rev Immunol. 2003;21:685-711. doi: 10.1146/annurev.immunol.21.120601.141040. Epub 2001 Dec 19. Annu Rev Immunol. 2003. PMID: 12615891 Review.
Cited by
-
Targeting Dendritic Cells with Antigen-Delivering Antibodies for Amelioration of Autoimmunity in Animal Models of Multiple Sclerosis and Other Autoimmune Diseases.Antibodies (Basel). 2020 Jun 15;9(2):23. doi: 10.3390/antib9020023. Antibodies (Basel). 2020. PMID: 32549343 Free PMC article. Review.
-
Dendritic cell immunoreceptor 2 (DCIR2) deficiency decreases hepatic conventional dendritic cell content but not the progression of diet-induced obesity.Immun Inflamm Dis. 2023 Oct;11(10):e1024. doi: 10.1002/iid3.1024. Immun Inflamm Dis. 2023. PMID: 37904682 Free PMC article.
-
Flow cytometric gating for spleen monocyte and DC subsets: differences in autoimmune NOD mice and with acute inflammation.J Immunol Methods. 2016 May;432:4-12. doi: 10.1016/j.jim.2015.08.015. Epub 2015 Sep 5. J Immunol Methods. 2016. PMID: 26344574 Free PMC article.
-
Natural and Induced Tolerogenic Dendritic Cells.J Immunol. 2020 Feb 15;204(4):733-744. doi: 10.4049/jimmunol.1901121. J Immunol. 2020. PMID: 32015076 Free PMC article. Review.
-
Tolerogenic dendritic cells in type 1 diabetes: no longer a concept.Front Immunol. 2023 Jun 14;14:1212641. doi: 10.3389/fimmu.2023.1212641. eCollection 2023. Front Immunol. 2023. PMID: 37388741 Free PMC article. Review.
References
-
- Ben-Nun A, Kaushansky N, Kawakami N, et al. From classic to spontaneous and humanized models of multiple sclerosis: Impact on understanding pathogenesis and drug development. J Autoimmun 2014;54:33–50 - PubMed
-
- Jayasimhan A, Mansour KP, Slattery RM. Advances in our understanding of the pathophysiology of type 1 diabetes: lessons from the NOD mouse. Clin Sci (Lond) 2014;126:1–18 - PubMed
-
- Price JD, Tarbell KV. The role of dendritic cell subsets and innate immunity in the pathogenesis of type 1 diabetes and other autoimmune diseases [article online], 2015. Front Immunol. Available from http://dx.doi.org/10.3389/fimmu.2015.00288. Accessed 15 June 2015 - DOI - PMC - PubMed
Publication types
MeSH terms
Substances
Grants and funding
LinkOut - more resources
Full Text Sources
Other Literature Sources
Medical
Molecular Biology Databases
Research Materials
Miscellaneous

