Comparative Study
. 2015 Aug;56(8):1434-48.
doi: 10.1194/jlr.M056580. Epub 2015 Jun 10.

Ganglioside accumulation in activated glia in the developing brain: comparison between WT and GalNAcT KO mice

Affiliations
Comparative Study

Ganglioside accumulation in activated glia in the developing brain: comparison between WT and GalNAcT KO mice

Mariko Saito et al. J Lipid Res. 2015 Aug.

Abstract

Our previous studies have shown accumulation of GM2 ganglioside during ethanol-induced neurodegeneration in the developing brain, and GM2 elevation has also been reported in other brain injuries and neurodegenerative diseases. Using GM2/GD2 synthase KO mice lacking GM2/GD2 and downstream gangliosides, the current study explored the significance of GM2 elevation in WT mice. Immunohistochemical studies indicated that ethanol-induced acute neurodegeneration in postnatal day 7 (P7) WT mice was associated with GM2 accumulation in the late endosomes/lysosomes of both phagocytic microglia and increased glial fibrillary acidic protein (GFAP)-positive astrocytes. However, in KO mice, although ethanol induced robust neurodegeneration and accumulation of GD3 and GM3 in the late endosomes/lysosomes of phagocytic microglia, it did not increase the number of GFAP-positive astrocytes, and the accumulation of GD3/GM3 in astrocytes was minimal. Not only ethanol, but also DMSO, induced GM2 elevation in activated microglia and astrocytes along with neurodegeneration in P7 WT mice, while lipopolysaccharide, which did not induce significant neurodegeneration, caused GM2 accumulation mainly in lysosomes of activated astrocytes. Thus, GM2 elevation is associated with activation of microglia and astrocytes in the injured developing brain, and GM2, GD2, or other downstream gangliosides may regulate astroglial responses in ethanol-induced neurodegeneration.

Keywords: GM2/GD2 synthase knockout mice; activated microglia; astrocyte; brain lipids; ceramide; ethanol; inflammation; lipopolysaccharide; triglycerides; wild-type mice.


Figures

Fig. 1.
Fig. 1.
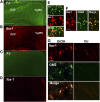
Ethanol-induced neurodegeneration is associated with GM2 elevation in activated microglia. A: Twenty-four hours after ethanol exposure in P7 C57BL/6By mice, brains were removed and the sections were stained with FJ. A representative image shows the localization pattern of FJ+ degenerating neurons in the cortex. Cg/RS, cingulate/retrosplenial cortex. Scale bar = 500 μm. B: Brain sections prepared as described in (A) were immunolabeled with anti-Iba-1 antibody. A brain section adjacent to the one used for FJ staining shows that the distribution of morphologically activated microglia is similar to that of FJ+ cells. On the other hand, FJ+ cells were hardly detected in saline-treated control brain sections (C), and Iba-1+ microglia with small cell bodies were evenly distributed (D). E: Brain sections prepared as described in (A) were dual-labeled with FJ and anti-Iba-1 antibody. FJ staining was frequently localized in activated microglia. Scale bar = 20 μm. F: Brain sections prepared as described in (A) were dual-labeled with anti-Iba-1 antibody and anti-CD68 antibody. A representative image shows that microglia with an activated morphology were positive for both anti-Iba-1 and anti-CD68 immunolabeling. Scale bar = 50 μm. G: Twenty-four hours after ethanol (EtOH) or saline (Ctr) exposure in P7 C57BL/6By mice, brains were removed and the sections were dual-labeled with anti-Iba-1 and anti-GM2 antibody. Activated microglia observed in ethanol-treated brain sections were positive for GM2, while GM2 immunostaining was hardly detected in the control brain. Scale bar = 20 μm.
Fig. 2.
Fig. 2.
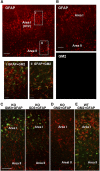
Time course of GM2 expression in microglia and astrocytes, and colocalization of GM2 with LAMP1 and CatD in astrocytes. A: After ethanol exposure in P7 C57BL/6By mice (8, 24, 32, and 48 h), brains were removed and the sections were dual-labeled with anti-GM2 (green) and anti-Iba-1 (red) antibodies, or anti-GM2 (green) and anti-GFAP (red) antibodies. GM2, which was abundant in microglia 24 h after ethanol treatment, almost disappeared from these cells by 32 h, and GM2 was subsequently found in astrocytes. Scale bar = 20 μm. B: The percentage of Iba-1+ and GFAP+ cells that were GM2+ was determined in Area I [indicated in (D)] 8, 24, 32, and 48 h after ethanol exposure, as described in the Materials and Methods. C: Thirty-two hours after ethanol exposure in P7 C57BL/6By mice, brains were removed and the sections were dual-labeled with anti-GM2 and anti-LAMP1 antibodies, or anti-GM2 and anti-CatD antibodies. The images indicate partial colocalization of GM2 with LAMP1 and CatD, lysosomal markers. Scale bar = 5 μm. D: Brain sections from P7 C57BL/6By mice perfusion-fixed 24 h after ethanol (EtOH) or saline (Ctr) exposure were immunostained with anti-GFAP antibody. The images show the cortex area: Area I corresponds to layers IV/V of the primary somatosensory cortex in Fig. 1A, and Area II corresponds to the deep cortical layer/white matter near the cingulum and external capsule. Ethanol treatment increased GFAP+ astrocytes in Areas I and II. Scale bar = 100 μm. E: Brain sections prepared as described in (D) were dual stained with anti-GM2 (green) and anti-GFAP (red) antibody. The images are taken from the Area II region and show evidence of GM2 in astrocytes. Scale bar = 20 μm.
Fig. 3.
Fig. 3.
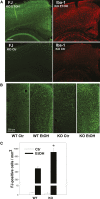
Ethanol-induced neurodegeneration and microglial activation in GalNAcT KO mice. A: Twenty-four hours after P7 KO mice were treated with ethanol (EtOH) or saline (Ctr), brains were taken and the sections were stained with FJ or anti-Iba-1 antibody. Scale bar = 200 μm. B: Twenty-four hours after P7 KO mice and littermate WT mice were treated with saline (Ctr) or ethanol (EtOH), brains were taken and the sections were stained with FJ. The images show the cingulate cortex area. Scale bar = 200 μm. C: FJ+ cells labeled as described above (B) were counted in the cingulate cortex, as described in the Materials and Methods. Two-way ANOVA indicated that there was a significant effect of genotype; F(1,13) = 16.2, P < 0.001, and Student’s t-test (*) showed a significant difference (P = 0.0035) between ethanol-treated WT and KO mice.
Fig. 4.
Fig. 4.
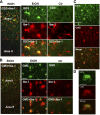
Ethanol-induced aggregated or punctate immunostaining of GD3 and GM3 in activated microglia in the KO mice. A: Twenty-four hours after P7 KO mice were treated with ethanol (EtOH) or saline (Ctr), brains were taken and the sections were dual-labeled using anti-GD3 (green) and anti-Iba-1 (red) antibody. Punctate or aggregated GD3, only observed in the ethanol-treated brain, was detected mainly in activated microglia. Scale bar = 20 μm. B: Under the same experimental conditions, punctate or aggregated GM3 was also found in activated microglia in ethanol-treated KO mice, while aggregated or punctate GM3 staining was rarely detected in control KO mice. Scale bar = 20 μm. C: Brain sections taken from KO mice 24 h after ethanol exposure were dual-labeled with anti-GD3 (green) and anti-CatD (red) antibody. Punctate or aggregated GD3 was frequently colocalized with CatD. Scale bar = 50 μm. D: A sample cell dual-labeled with anti-GD3 and anti-CatD antibody, as described in (C), examined with a higher magnification objective. Scale bar = 10 μm.
Fig. 5.
Fig. 5.
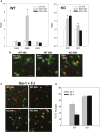
Accumulation of GM3 and FJ staining in microglia 48 h after ethanol treatment. A: Twenty-four or 48 h after P7 WT and KO mice were exposed to saline/ethanol, brain gangliosides were analyzed, as described in the Materials and Methods. The amounts of gangliosides (GM3, GM2, and GD3) in WT or KO mice 48 h after ethanol exposure are expressed as ratios to the amounts of 24 h control (Ctr) samples. *P < 0.05, the value is significantly different from the 24 h control group by one-way ANOVA with Bonferroni’s post hoc test. B: Forty-eight hours after P7 WT and KO mice were treated with ethanol, brains were taken, and the sections were dual-labeled with anti-Iba-1 (green) and anti-GM3 (red) or anti-GM2 (red) antibody. Many microglia are GM3+ in layers IV/V of the S1 cortex in the KO brain. Scale bar = 20 μm. C: Brain sections taken from WT and KO mice 24 or 48 h after ethanol exposure were dual-labeled with anti-Iba-1 (red) antibody and FJ (green) staining. Many microglia are FJ+ in layers IV/V of the S1 cortex in KO mice 48 h after ethanol treatment. Scale bar = 20 μm. D: The percentages of FJ+ cells among Iba-1+ cells in layers IV/V of the S1 cortex were calculated using images including those shown in (C). Two-way ANOVA indicated that there was a significant interaction between the effects of genotype (WT versus KO) and time (24 h versus 48 h) [F(1,17) = 18.4, P < 0.001], a significant main effect of genotype [F(1,17) = 102.9, P < 0.001], and a significant main effect of time [F(1,17) = 11.8, P = 0.003].
Fig. 6.
Fig. 6.
The comparison of distribution of accumulated GM2 in WT mice and accumulated GM3/GD3 in KO mice. A: Twenty-four hours after WT mice were treated with ethanol, brains were taken and the sections were dual-labeled with anti-GFAP (red) and anti-GM2 (green) antibodies. Only GFAP staining is shown in the upper panel. Accumulation of GM2 was detected not only in Area I, where degenerating neurons were abundant, but also in Area II, where GM2 was localized in GFAP+ astrocytes. The lower panels show the brain areas indicated as boxes I and II in the upper panel. The scale bar in the upper panel is 100 μm, and 20 μm in lower panels. B: Panels show examples of a brain section from control mice dual-labeled with anti-GFAP (upper) and anti-GM2 (lower) antibodies. GM2 was hardly detected in the control brain in both Area I and Area II. Scale bar = 100 μm. C: Twenty-four hours after P7 KO mice were exposed to ethanol, brains were harvested and the sections were dual-labeled with anti-GFAP (red) antibody and anti-GM3 or anti-GD3 (green) antibody. GM3 and GD3 immunostaining was hardly detected in Area II. Scale bar = 100 μm. D: Twenty-four hours after P7 KO mice were exposed to ethanol, brains were removed and the sections were dual-labeled with anti-GM2 (green) and anti-GFAP antibody (red). As expected, GM2 was not stained in KO mice. E: Twenty-four hours after P7 WT mice were exposed to ethanol, brains were removed and the sections were dual-labeled with anti-GM2 (green) and anti-GFAP (red) antibody. GM2 staining was detected in astrocytes in both Area I and Area II.
Fig. 7.
Fig. 7.
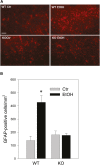
The effects of ethanol on the number of GFAP+ cells in WT and KO mice. A: Brains were harvested 24 h after WT and KO mice were exposed to saline (Ctr) or ethanol (EtOH) at P7, and brain sections were immunostained with anti-GFAP antibody. Scale bar = 100 μm. B: The density of GFAP+ cells in layers IV/V of the S1 cortex were calculated, as described in the Materials and Methods, using brain sections including those shown in (A).
Fig. 8.
Fig. 8.
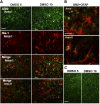
GM2 accumulation in microglia and astrocytes in the brain of mice exposed to DMSO. A: P7 C57BL/6By mice were injected with DMSO (5 ml/kg or 10 ml/kg) intraperitoneally, and the brain was perfusion-fixed 24 h after the injection. Brain sections were dual-labeled with anti-GM2 (green) and anti-Iba-1 (red) antibody. GM2 was observed in most of the activated microglia in Area I. Scale bar = 50 μm. B: The sections from brains treated with 10 ml/kg of DMSO were dual-labeled with anti-GM2 (green) and anti-GFAP (red) antibody. GM2 was localized also in astrocytes, especially in Area II. Scale bar = 20 μm. C: The sections from brains treated with 5 or 10 ml/kg of DMSO were stained with FJ. The images show the cingulate cortex region. Scale bar = 50 μm.
Fig. 9.
Fig. 9.
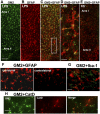
LPS-induced GM2 accumulation in astrocytes. Twenty-four hours after injection of LPS intracerebrally into P7 C57BL/6By mice, brains were perfusion-fixed and the sections were dual-labeled with anti-GM2 (green) and anti-GFAP (red) (A–F), anti-GM2 (green) and anti-Iba-1 (red) (G), or anti-GM2 (green) and anti-CatD antibody (H). Panel (C) is a merged image of (A) and (B), and (D) is an enlarged image of the area of a square shown in (C). Panel (E) is a merged image (GM2 and GFAP) of a section from the control (saline-treated) brain, showing limited GM2 staining. LPS-induced GM2 elevation was observed mostly in the ipsilateral brain (F), and the presence of GM2 in microglia was scant (G), and some of the punctate GM2 staining was colocalized with CatD (H). The scale bar in (A) indicates 100 μm, and the magnification of images of (B), (C), and (E) is the same as that of (A). Scale bars in (D), (F), and (G) indicate 20 μm, and the scale bar in (H) indicates 5 μm.

Similar articles

Cited by

References

    1. Guerri C., Bazinet A., Riley E. P. 2009. Foetal alcohol spectrum disorders and alterations in brain and behaviour. Alcohol Alcohol. 44: 108–114. - PMC - PubMed
    1. Ikonomidou C., Bittigau P., Ishimaru M. J., Wozniak D. F., Koch C., Genz K., Price M. T., Stefovska V., Horster F., Tenkova T., et al. 2000. Ethanol-induced apoptotic neurodegeneration and fetal alcohol syndrome. Science. 287: 1056–1060. - PubMed
    1. Goodlett C. R., Leo J. T., O’Callaghan J. P., Mahoney J. C., West J. R. 1993. Transient cortical astrogliosis induced by alcohol exposure during the neonatal brain growth spurt in rats. Brain Res. Dev. Brain Res. 72: 85–97. - PubMed
    1. Kane C. J., Phelan K. D., Han L., Smith R. R., Xie J., Douglas J. C., Drew P. D. 2011. Protection of neurons and microglia against ethanol in a mouse model of fetal alcohol spectrum disorders by peroxisome proliferator-activated receptor-gamma agonists. Brain Behav. Immun. 25(Suppl 1): S137–S145. - PMC - PubMed
    1. Kane C. J., Phelan K. D., Drew P. D. 2012. Neuroimmune mechanisms in fetal alcohol spectrum disorder. Dev. Neurobiol. 72: 1302–1316. - PMC - PubMed

Publication types

MeSH terms