. 2015 Aug;138(Pt 8):2399-422.
doi: 10.1093/brain/awv150. Epub 2015 Jun 6.

Therapeutic effects of glatiramer acetate and grafted CD115⁺ monocytes in a mouse model of Alzheimer's disease

Affiliations

Therapeutic effects of glatiramer acetate and grafted CD115⁺ monocytes in a mouse model of Alzheimer's disease

Yosef Koronyo et al. Brain. 2015 Aug.

Abstract

Weekly glatiramer acetate immunization of transgenic mice modelling Alzheimer's disease resulted in retained cognition (Morris water maze test), decreased amyloid-β plaque burden, and regulation of local inflammation through a mechanism involving enhanced recruitment of monocytes. Ablation of bone marrow-derived myeloid cells exacerbated plaque pathology, whereas weekly administration of glatiramer acetate enhanced cerebral recruitment of innate immune cells, which dampened the pathology. Here, we assessed the therapeutic potential of grafted CD115(+) monocytes, injected once monthly into the peripheral blood of transgenic APPSWE/PS1ΔE9 Alzheimer's disease mouse models, with and without weekly immunization of glatiramer acetate, as compared to glatiramer acetate alone. All immune-modulation treatment groups were compared with age-matched phosphate-buffered saline-injected control transgenic and untreated non-transgenic mouse groups. Two independent cohorts of mice were assessed for behavioural performance (6-8 mice/group); treatments started in 10-month-old symptomatic mice and spanned a total of 2 months. For all three treatments, our data suggest a substantial decrease in cognitive deficit as assessed by the Barnes maze test (P < 0.0001-0.001). Improved cognitive function was associated with synaptic preservation and reduction in cerebral amyloid-β protein levels and astrogliosis (P < 0.001 and P < 0.0001), with no apparent additive effects for the combined treatment. The peripherally grafted, green fluorescent protein-labelled and endogenous monocytes, homed to cerebral amyloid plaques and directly engulfed amyloid-β; their recruitment was further enhanced by glatiramer acetate. In glatiramer acetate-immunized mice and, moreover, in the combined treatment group, monocyte recruitment to the brain was coupled with greater elevation of the regulatory cytokine IL10 surrounding amyloid-β plaques. All treated transgenic mice had increased cerebral levels of MMP9 protein (P < 0.05), an enzyme capable of degrading amyloid-β, which was highly expressed by the infiltrating monocytes. In vitro studies using primary cultures of bone marrow monocyte-derived macrophages, demonstrated that glatiramer acetate enhanced the ability of macrophages to phagocytose preformed fibrillar amyloid-β1-42 (P < 0.0001). These glatiramer acetate-treated macrophages exhibited increased expression of the scavenger receptors CD36 and SCARA1 (encoded by MSR1), which can facilitate amyloid-β phagocytosis, and the amyloid-β-degrading enzyme MMP9 (P < 0.0001-0.001). Overall, our studies indicate that increased cerebral infiltration of monocytes, either by enrichment of their levels in the circulation or by weekly immunization with glatiramer acetate, resulted in substantial attenuation of disease progression in murine Alzheimer's models by mechanisms that involved enhanced cellular uptake and enzymatic degradation of toxic amyloid-β as well as regulation of brain inflammation.

Keywords: Alzheimer’s disease; behavioural neurology; dementia; neuroinflammation; neuroprotection.


Figures

None
Infiltrating monocyte-derived macrophages contribute to the clearance of amyloid-beta in the brain. Koronyo et al. show that monthly injection of a subset of bone marrow monocytes into the peripheral blood of symptomatic Alzheimer’s disease mouse models, and/or weekly immunization with glatiramer acetate, substantially reduces cognitive decline. The improved cognition is associated with synaptic preservation.
Figure 1
Figure 1
Scheme of the experimental procedure and immunization timeline. (A) Experimental procedure demonstrating the adoptive transfer of monocytes to the peripheral blood of ADtg mice. CD115+ monocytes (MoBM) were isolated from the bone marrow of young (8- to 10-week-old) wild-type mice and enriched (∼95%, see Supplementary Fig. 4A) by MACS microbeads and an anti-CD115 antibody column sorting procedure. MoBM were then intravenously (i.v.) injected into the tail vein of older (10-month-old) ADtg mice. Additional experimental groups included ADtg mice that were subcutaneously (s.c.) immunized with GA or received combined GA and MoBM treatment. Age- and sex-matched controls are also indicated. (B) Experimental timeline. At 10 months of age, mice received immunization regimens of either weekly injections of GA and/or monthly injections of MoBM or PBS over a 2-month period. After completion of the treatment period, the mice (now 12 months old) underwent behavioural testing (Barnes maze hippocampus-dependent learning and memory test). The brain tissues at 13 months were harvested for subsequent analysis. BM = bone marrow; AD+ = ADtg; WT = wild-type.
Figure 2
Figure 2
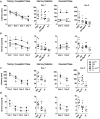
Reduced spatial learning and memory deficits in treated ADtg mice as assessed using the Barnes maze test. (A and B) The first cohort of PBS-injected, GA-immunized, and GA plus MoBM–treated ADtg mice were assessed for cognitive function when the animals were 12.5 months old (n = 7 mice/group). An additional control group composed of age- and sex-matched untreated non-transgenic (wild-type, wt) mice (n = 7) was also tested. During the training/acquisition phase, all mouse groups became more efficient in finding the escape box, resulting in a reduced escape latency (Latency; A) and fewer incorrect entries (Errors; B). A two-way ANOVA showed no significant difference in mean latency between the treatment groups but a highly significant difference (P < 0.0001) between Days 1 and 4 (A, left). The same analysis indicated significant differences in the mean number of errors: P < 0.0001 between treatment groups and P = 0.0191 between Days 1 and 4 days (B, left). An analysis of individual days (Days 1–4) by one-way ANOVA showed no significant differences for latency (A), but indicated a significant reduction in the number of errors (B) in the treated groups compared to the PBS control group. A memory retention test was performed after a 2-day break (on Day 7). No significant differences were observed between the treatment groups in mean latencies (A, middle left). However, the mean number of errors was significantly lower in both the GA- and GA+MoBM-treated ADtg mouse groups than in the PBS control group (B, middle left). During the reversal phase (Days 8 and 9), the location of the escape box was altered and the escape latency and errors were measured. Data analysis performed using a two-way ANOVA showed significant differences between the treatment groups and the PBS control group (P < 0.0001 for both latency and errors). A one-way ANOVA of mean latency on Days 8 and 9 demonstrated significant differences between the PBS group and both the GA and GA+MoBM groups. A highly significant reduction in latency was observed in the combined treatment group (GA+MoBM), which is essentially indistinguishable from the wild-type group (A, right graphs). However, the reduction in the number of mean errors reached significance only for the GA group, which was not significantly different from the wild-type control group (B, right). (C and D) The second cohort, which consisted of PBS control and MoBM-treated ADtg mice as well as naïve wild-type mice, was also assessed by performing the Barnes maze test when the animals were 12.5 months old (n = 6–8 mice/group). The data indicated that the adoptive transfer of MoBM to the peripheral blood in ADtg mice significantly reduced cognitive deficits (as shown by mean errors) for Days 4, 7 and 9. The data from individual mice as well as the group means and SEMs are shown. *P < 0.05, **P < 0.001, ***P < 0.0001.
Figure 3
Figure 3
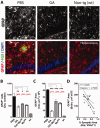
Decreased cerebral amyloid-β levels and increased synaptic preservation. (A) Representative microscopic images of coronal brain sections from 13-month-old ADtg mice from all treated groups display a reduced hippocampal plaque burden when compared to those from the PBS control group. Sections were immunolabelled with the anti-human amyloid-β monoclonal antibody 4G8 (red) and counterstained with DAPI (blue) to detect nuclei. (B) Quantitative immunohistochemical analyses of brain sections were assessed for 4G8-positive amyloid-β plaque area. (C) Quantitative analyses of brain sections assessed for thioflavin-S (Thio-S)-positive amyloid-β plaque area. In B and C all treatment groups show substantial decreases in amyloid-β plaque burden in brain regions covering the hippocampus (Hip) and cortex (Ctx). (D) ELISA analyses of insoluble human amyloid-β1–40 and amyloid-β1–42 in the brain indicate significant reductions in mean levels across all treatment groups compared to the PBS control group. The trend of reduction in insoluble amyloid-β1–40 in the MoBM did not reach statistical significance. (E) ELISA analyses of soluble human amyloid-β1–40 and amyloid-β1–42 in the brain. Compared to the PBS control group, all treatment groups show significant reductions in mean levels of soluble amyloid-β1–40, and the GA-immunized group displays a substantial reduction in soluble amyloid-β1–42 levels in the brain. (F) Illustration of the presynaptic marker VGluT1 area measurement in the hippocampus. Fifteen fields were precisely selected in the hippocampus, and for each field, 15 optical section images were acquired and analysed. (G) A representative high-magnification Z-stack micrograph was obtained from the molecular layer of the dentate gyrus, which was immunostained with VGluT1 in the GA treatment group. (H) Quantification of total hippocampal synaptic areas obtained from animals in the PBS, GA, GA+MoBM, MoBM, and wild-type mouse groups. At the age of 10 months PBS-treated ADtg mice had a mild but significant loss of synaptic area (25%) compared to matched wild-type controls. In 13-month-old ADtg mice a substantial 55% synaptic area loss was observed. Significant synaptic preservation was seen for all treatment groups (39–61%) at the age of 13 months. The mean synaptic area in the GA group reached the level observed in 10-month-old PBS control ADtg mice. No significant differences were found between any of the treatment groups. (I) A negative correlation was noticed between the synaptic area in the hippocampus and the Barnes maze scores, specifically with respect to the number of incorrect entries in the memory retention test (Errors Day 7). A larger synaptic area in the hippocampus correlated with fewer errors indicating less cognitive deficit. (J) Negative correlation was found between the per cent synaptic area and the Thio-S amyloid-β plaque area in the hippocampus. Increased Thio-S+ plaque was associated with synapse loss. Correlation analyses were performed using the Pearson’s test. Data from individual mouse as well as group means and SEMs are shown. The per cent reductions or elevations in mean values, as compared with PBS controls, are indicated in red. n = 6–8 mice per group. *P < 0.05, **P < 0.001, ***P < 0.0001. Aβ = amyloid-β.
Figure 4
Figure 4
Reduction in cerebral GFAP+ astrogliosis. Brain coronal sections from 13-month-old ADtg and non-transgenic (non-tg, wild-type, wt) mice were co-labelled with the anti-human amyloid-β antibody (4G8; green) and the astrocyte-specific GFAP antibody (red). Sections were counterstained with DAPI (blue) to detect nuclei. (A) Representative fluorescence micrographs of hippocampal regions depict reduced staining for GFAP in GA-immunized ADtg mice compared to PBS controls; staining in the treated group is similar to that in tissue from the wild-type brain. For simplicity of viewing, the upper portion of A shows the single GFAP channel as greyscale. (B and C) Quantitative immunohistochemical analysis of GFAP+ cell number and area across all experimental groups. (B) The three types of immune-modulation treatment were found to substantially reduce cortical astrocytosis levels (P < 0.001–0.05), and there is no significant difference in the astrocyte cell count between the treatment groups. (C) GA therapy appears to have the largest effect on reducing the mean cortical GFAP+ area (P < 0.0001 between GA and either the MoBM or GA+MoBM groups). Cortical astrogliosis levels in all treatment groups are significantly higher than levels found in the wild-type group. (D) Negative correlations were perceived between the per cent synaptic area and cerebral GFAP+ immunoreactivity in the brain. Correlation analyses were performed using the Pearson’s test. Group means and SEMs are shown. The percentage reductions in mean astrocyte number and total area in GA, MoBM, and combined GA+MoBM-treated animals, compared to PBS control mice, are indicated in red. n = 3–5 mice per group. *P < 0.05, **P < 0.001, ***P < 0.0001.
Figure 5
Figure 5
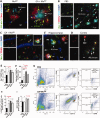
Enhanced infiltration of blood-borne phagocytic monocyte-derived macrophages associated with amyloid-β plaque clearance. GFP-labelled bone marrow-derived CD11b+CD115+ cells were isolated from young (8- to 10-week-old) donor wild-type mice and injected into the tail vein of symptomatic 10-month-old ADtg mice, with or without GA immunization, once a month over a period of 2 months. (A) Fluorescence micrographs of hippocampal coronal sections from 13-month-old ADtg mice that were immunolabelled for anti-GFP (green), CD45 (red), human amyloid-β (4G8; cyan), and nuclei (DAPI, blue). Spontaneous recruitment of GFP-labelled monocyte-derived macrophages from the peripheral blood to amyloid-β deposition sites was found in both GA-immunized and non-immunized ADtg mice in which adoptive transfer of MoBM occurred. An additional increase in recruitment of GFP-labelled monocytes to the brain was observed in the combined GA+MoBM group compared to the non-immunized MoBM group. (B–D) Additional immunolabelling distinguishes between resident microglia (Iba1+/CD45int/low) and monocyte-derived macrophage (Iba1+/CD45high). Composite pictures and images from individual colour channels are presented. In PBS control brains (B), the amyloid-β plaques are larger, highly aggregated, and mostly associated with activated microglial cells (Iba1+/CD45int/low; green). In GA+MoBM-treated brains (C), the amyloid-β plaques are generally smaller, more diffused, and highly associated with Iba1+/CD45high infiltrating monocyte-derived macrophage (red). Inset: an arrow showing co-localization of amyloid-β in macrophage in white spots. A higher-magnification image of the area depicted in C is seen in C′. Both microglia (MG) and macrophages (MФ) are found at amyloid-β plaque sites in the hippocampus of GA+MoBM-treated brains. There is co-localization of Iba1+/CD45high cells and intracellular amyloid-β immunoreactivity, indicating cellular uptake of amyloid-β. Cellular uptake of amyloid-β is more frequently observed among macrophage than among microglia cells (C and C′). A similar increase in infiltrating Iba1+/CD45high macrophages in the treated groups was also found in cortical regions (D). (E and F) Quantitation of the Iba1+CD45high-macrophage immunoreactive area (E), the ratio of infiltrating macrophage area per 4G8+-amyloid-β plaque area (F), and a table presenting a manual count of Iba1+CD45high-macrophage cells and their ratio to plaque number (Table 1) in brain regions covering the hippocampus and cortex in all treatment groups. All treatment groups showed increases in cerebral macrophage recruitment associated with amyloid-β plaques; especially, the GA+MoBM-treated brains, which showed a marked increase in macrophage recruitment to the hippocampal and cortical regions (E) and association with plaque lesion sites (F). Similar results are observed by a manual count of infiltrating cells and individual plaque numbers (Table 1). (G and H) An additional cohort of 10-month-old ADtg mice received GA-immunizations, with or without an injection of MoBM, or PBS injections (n = 4–6 mice/group) for a month. Thirty-six hours after completion of the treatment period, the brains were perfused before harvest and mononuclear cells from whole brains were enriched on a Percoll® gradient. (G) Representative graphs of flow cytometric analysis from PBS (top) and GA+MoBM-treated (bottom) groups. Infiltrating cells were defined as CD11b+CD45high. The CD11b+CD45high cells were further gated for Ly6Chigh for quantification of infiltrating inflammatory monocytes. (H) Quantitative flow data showing the percentage of total CD11b+ cells that are also CD45highLy6Chigh. These data indicate that more inflammatory monocytes (CD45highLy6ChighCD11b+) are present in the brains of all treated ADtg mouse groups than in the PBS group. This trend is especially significant for the GA+MoBM-treated group. (I) ELISA measurements of soluble MCP1 (CCL2) in the brains of all mouse groups. Group means and SEMs are shown, and the mean fold increase is indicated in red. n = 6–7 mice per each group for the first cohort and n = 4–6 mice per group for the second mouse cohort. *P < 0.05, **P < 0.001, ***P < 0.0001, ANOVA and Bonferroni’s post-test, while the smaller asterisks in parentheses signify a two-group comparison using the unpaired two-tailed Student t-test. Aβ = amyloid-β.
Figure 6
Figure 6
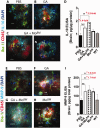
GA induces IL10 and MMP9 surrounding cerebral plaque. Coronal brain sections from 13-month-old ADtg mice, either treated or given PBS, were co-labelled with a combination of the markers Iba1 (green) and CD45 (red), to detect resident microglia (Iba1+/CD45int/l°w) and monocyte-derived macrophage (Iba1+/CD45high), and with the anti-IL10 antibody (cyan). Sections were counterstained with DAPI to detect nuclei (blue). (A–C) Representative fluorescence micrographs indicate low levels of IL10 expression in PBS control brains, whereas elevated IL10 levels (expressed by microglia and monocytes) are observed in GA- and GA+MoBM–treated brains. IL10 was found to be concentrated around plaque lesion sites (data not shown). Note: In the GA and GA+MoBM groups (C, right image), IL10 was also found to be highly expressed by non-myelomonocytic CD45/Iba1 cells (possibly astrocytes and oligodendrocytes). (D) Quantitative ELISA analysis of IL10 levels in brain samples showed a substantial increase in IL10 in GA+MoBM-treated ADtg mice (2.2-fold increase in mean levels) compared to control animals given PBS. The GA group had a 1.4-fold increase in IL10, compared to the PBS group, reaching significance only with the Student t-test. This trend did not reach significance for the MoBM group. There were no significant differences between treated groups and the untreated wild-type group. (E–H) Coronal brain sections from all mouse groups were co-labelled with a combination of the markers Iba1 (green), CD45 (red), MMP9 (cyan), and DAPI (blue) for nuclei. (E) Representative fluorescent micrograph indicates basal MMP9 levels in the brains of PBS control ADtg mice, whereas increased amounts of MMP9 were frequently found in the brains of GA-, MoBM-, and GA+MoBM-treated animals (F–H). This finding was accompanied by an increase in infiltrating monocyte-derived macrophages (Iba1+/CD45high) highly expressing MMP-9 in the vicinity of the plaques. (I) Quantitative ELISA analysis of MMP9 levels in brain samples indicated similar basal levels of cerebral MMP9 in both PBS-injected ADtg mice and naïve wild-type controls. In contrast, the brains of ADtg mice treated with MoBM or GA+MoBM had a significant increase (1.6- and 1.7-fold, respectively) in soluble MMP9 levels, compared to the brains of control animals given PBS. Although the GA group displayed a trend toward elevated MMP9 levels, compared to the PBS control group, this did not reach statistical significance (NS). The intravariability in MMP9 values was very high in all treated groups and in the wild-type mouse group, compared to the relatively low variability in the PBS group. Group means and SEMs are shown. Fold increases in mean IL10 and MMP9 are indicated in red. n = 4–8 mice per each group. *P < 0.05.
Figure 7
Figure 7
Enhanced fibrillar amyloid-β1-42 uptake by GA-treated macrophage in vitro is associated with increased expression of scavenger receptors and MMP9. (A) Illustration of experimental procedure: bone marrow was isolated from the long bones of young (8- to 10-week-old) wild-type mice and then cultured for 7 days in MCSF-enriched media providing differentiation into macrophages (MФBM). Upon differentiation, the cells were used in a set of experiments involving treatment with GA for different exposure times and stimulation with fibrillar amyloid-β1–42 (fAβ1–42), as indicated in the amyloid-β-phagocytosis assay design. (B and C) Representative fluorescence micrographs of MФBM either (B) untreated or (C) pretreated with GA for 24 h (GA-MФBM) and both stimulated with fibrillar amyloid-β1–42 for 60 min. Cells were co-labelled with the phagocytic cell marker CD68 and anti-human amyloid-β mAb (6E10), and counterstained with DAPI. (C’) Higher-magnification image depicting the large extent of fibrillar amyloid-β1–42 uptake in GA-treated MФBM. (D) Image from a parallel in vitro experiment, using fluorescence-labelled (HiLyte Fluor 647) preformed fibrillar amyloid-β1–42. (E–G) Quantitative immunocytochemistry of intracellular amyloid-β in GA-treated and untreated MФBM primary cultures. (E) MФBM were treated with GA for 24 h, exposed to fibrillar amyloid-β1–42 for 60 min, and intracellular amyloid-β staining was measured for each cell separately. Group means of individual cell fluorescent areas are indicated (n = 50 cells/group). (F) A parallel experiment, in which there was an analysis of overall amyloid-β-immunoreactive area divided by total cell count. Group means of n = 9–11 images of MФBM cell cultures (average 170 cells/image) are presented. (G) An additional representative experiment, in which GA treatment was given for a shorter duration (3 h) and a shorter fibrillar amyloid-β1–42 phagocytosis assay (30 min). Group means of individual cell fluorescent areas are indicated (n = 70–100 cells/group). (H–Q) In the next set of experiments, MФBM were pretreated for 1 or 24 h with GA and stimulated with fibrillar amyloid-β1–42 for 30 min. (H and I) Representative fluorescence micrographs of MФBM either (H) untreated or (I) pretreated with 24 h GA and co-labelled with antibodies against CD36, an innate immunity scavenger receptor involved in amyloid-β binding and trafficking, human amyloid-β (6E10), and DAPI nuclei stain. (I′) Higher magnification Z-stack image depicting the large extent of fibrillar amyloid-β1–42 uptake in GA-MФBM associated with elevated CD36 and co-expression of another monocytic scavenger surface receptor, CD163. (J–K) Quantitative analysis of intracellular 6E10 (J) and CD36 (K) in the GA-MФBM group versus the control MФBM group. (L–M) Representative micrographs of MФBM either untreated (L) or pretreated with 24 h with GA (M) and co-labelled with anti-CD204, an innate immune scavenger receptor known to facilitate amyloid-β phagocytosis (SCARA1), anti-MMP9, anti-human amyloid-β (6E10), and DAPI nuclei counterstaining. (N) Quantitative analysis of SCARA1 immunoreactive area per cell. (O and P) Enlarged images demonstrate MMP9 expression in the GA-MФBM group (P) as compared to those from the MФBM group (O). (Q) Quantitative analysis of cellular MMP9 in the GA-MФBM group versus the control MФBM group. Group means and SEM are shown, and fold increases in amyloid-β1–42 uptake by macrophage are indicated in red. **P < 0.001, ***P < 0.0001.

Similar articles

Cited by

References

    1. Aharoni R, Sonego H, Brenner O, Eilam R, Arnon R. The therapeutic effect of glatiramer acetate in a murine model of inflammatory bowel disease is mediated by anti-inflammatory T-cells. Immunol Lett 2007; 112: 110–9. - PubMed
    1. Akiyama H, Arai T, Kondo H, Tanno E, Haga C, Ikeda K. Cell mediators of inflammation in the Alzheimer disease brain. Alzheimer Dis Assoc Disord 2000a; 14 Suppl 1: S47–53. - PubMed
    1. Akiyama H, Barger S, Barnum S, Bradt B, Bauer J, Cole GM, et al. Inflammation and Alzheimer's disease. Neurobiol Aging 2000b; 21: 383–421. - PMC - PubMed
    1. Arnon R, Aharoni R. Mechanism of action of glatiramer acetate in multiple sclerosis and its potential for the development of new applications. Proc Natl Acad Sci USA 2004; 101 (Suppl 2): 14593–8. - PMC - PubMed
    1. Bakalash S, Pham M, Koronyo Y, Salumbides BC, Kramerov A, Seidenberg H, et al. Egr1 expression is induced following glatiramer acetate immunotherapy in rodent models of glaucoma and Alzheimer's disease. Invest Ophthalmol Vis Sci 2011; 52: 9033–46. - PubMed

Publication types

MeSH terms

Substances