. 2015 Jun 3;7(290):290ra92.
doi: 10.1126/scitranslmed.3010228.

Drug-induced regeneration in adult mice

Affiliations

Drug-induced regeneration in adult mice

Yong Zhang et al. Sci Transl Med. .

Abstract

Whereas amphibians regenerate lost appendages spontaneously, mammals generally form scars over the injury site through the process of wound repair. The MRL mouse strain is an exception among mammals because it shows a spontaneous regenerative healing trait and so can be used to investigate proregenerative interventions in mammals. We report that hypoxia-inducible factor 1α (HIF-1α) is a central molecule in the process of regeneration in adult MRL mice. The degradation of HIF-1α protein, which occurs under normoxic conditions, is mediated by prolyl hydroxylases (PHDs). We used the drug 1,4-dihydrophenonthrolin-4-one-3-carboxylic acid (1,4-DPCA), a PHD inhibitor, to stabilize constitutive expression of HIF-1α protein. A locally injectable hydrogel containing 1,4-DPCA was designed to achieve controlled delivery of the drug over 4 to 10 days. Subcutaneous injection of the 1,4-DPCA/hydrogel into Swiss Webster mice that do not show a regenerative phenotype increased stable expression of HIF-1α protein over 5 days, providing a functional measure of drug release in vivo. Multiple peripheral subcutaneous injections of the 1,4-DPCA/hydrogel over a 10-day period led to regenerative wound healing in Swiss Webster mice after ear hole punch injury. Increased expression of the HIF-1α protein may provide a starting point for future studies on regeneration in mammals.


Figures

Fig. 1
Fig. 1. HIF-1α protein is required for the regenerative response of the MRL mouse
(A) Schematic shows ear punch injury, and images show resulting histological sections and processed tissue samples. (B to F) HIF-1α protein expression in MRL and B6 mice before and after ear wounding. (B) Pooled ear hole donuts (n = 4) were processed for HIF-1α Western blot analysis with Coomassie blue–stained protein (seen as red with the Odyssey Classic Infrared Imaging System) as a loading control; N = 2 experiments. (C) Ear tissue was used for HIF-1α immunostaining (green; arrows show epidermal HIF-1α expression and arrowheads show dermal HIF-1α expression). Scale bar, 0.1 mm. (D) Multiple ear tissue samples for each time point after injury (n = 3 to 7 samples, N = 2 experiments) were quantitatively analyzed for MRL and B6 mice on day 7 (*P < 0.05) and on days 3 and 10 (**P < 0.01). (E) Further confirmation of HIF-1α expression was carried out in MRL and B6 mice backcrossed (BC4) to transgenic HIF-1α peptide–luciferase reporter mice. MRL.HIF-luc and B6.HIF-luc mice showed luciferase activity as measured by bioluminescence. This is seen as red for the highest bioluminescent activity and blue for the lowest activity. Arrowheads indicate ear bioluminescence; asterisks indicate body bioluminescence. (F) IVIS (in vivo imaging system, Perkin Elmer), a small animal bioluminescence detector, measured photon number in steradians (a unit of measure based on a solid angle) on days 0 and 7 in the healing ear and whole MRL cross mouse (red) and in the wounded ear and whole B6 cross mouse (blue); data are expressed as photons per second per square centimeter per steradian (p−1 s−1 cm−2 sr−1). Panel (E) shows one representative mouse per group as an example of a set of multiple experiments with n = 5 mice per group. In (F), the total number of photons detected in each of the mice from (E) is shown. (G and H) HIF-1α expression is required during MRL ear hole closure. (G) Treatment with Hif1a siRNA (siHif1a) blocked Hif1a mRNA expression in vitro in MRL mouse ear fibroblasts (n = 3 replicates); Gapdh is the loading control (N = 2 experiments). (H) Treatment of MRL.HIF-luc mice after ear punching with siHif1a_3 in vivo. Mice were injected subcutaneously with either JETPEI-siHif1a_3 mixture at days 0 to 20 after injury (15 μg per mouse; green) or phosphate-buffered saline (PBS; red). (a) Ear hole closure was blocked on day 28; **P < 0.001, Student's t test (n = 4 ears per group, N = 2 experiments). (b) HIF-1α was determined by bioluminescence (dorsal and ventral) in reporter mice treated with siHif1a_3. (c) Number of photons detected on day 14 in the whole mouse (n = 2) or injured ear; *P < 0.05, Student's t test (n = 4 ear samples per group) for siHif1a_3 compared to control (N = 2 experiments).
Fig. 2
Fig. 2. The drug 1,4-DPCA, an inhibitor of PHDs, is encapsulated in an injectable polymer hydrogel and released over several days
(A) Diagram showing that blockade of PHDs by 1,4-DPCA slows degradation of HIF-1α. (B) Chemical structures of the drug delivery components include the drug1,4-DPCA; Pluronic F127, which coats drug crystals; and P8NHS and P8Cys, which react to form the polymer hydrogel that contains the drug. (C) The presence of drug microcrystals does not interfere with the gelation kinetics of the hydrogel. (D) The drug was encapsulated in the hydrogel, yielding a white, opaque cylindrical hydrogel (left), which when incubated with PBS released the drug, leaving behind a clear hydrogel (right). (E) In vitro experiments showed that drug release occurred over several days for hydrogels containing 119 to 477 μg of the 1,4-DPCA drug. Colored lines represent total drug loading for each formulation. Panels (C) and (E) show data from replicate samples (n = 3).
Fig. 3
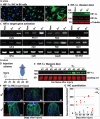
Fig. 3. 1,4-DPCA drug/gel stabilizes HIF-1α, but not HIF-2α, in vitro and in vivo
(A) Ear fibroblasts from B6 mice were cultured with normal medium (Nor.), gel alone (G0), or drug (2 mg/ml)/gel (Gd) in 100-μl total volume, which formed a solid disc in 24-well plates. Addition of 1,4-DPCA drug/gel (Gd) induced HIF-1α protein expression as determined by immunostaining (green, panel c). Scale bar, 50 μm. (B) Cell lysates (n = 3 per lane) from (A) were used for Western blot analysis for HIF-1α protein (green) and HIF-2α (red) compared to control protein α-tubulin (red) (N = 4). (C) Activation of HIF-1α target gene transcription. RT-PCR was used to analyze mRNA extracted from drug-treated mouse B6 cells (n = 3) from (A). The expression of multiple genes was increased by the 1,4 DPCA/gel treatment, including proangiogenic target genes Vegf and Hmox1, and proglycolytic targets Ldh-a, Pgk, Pdk1, and Glut1. Gapdh and 18S ribosomal RNA were used as internal controls for all RT-PCR reactions (N = 3). (D to G) Swiss Webster mice were treated with a single injection of drug/gel on day 0, the day of injury, and ear tissue was harvested everyday for 5 days and was tested for HIF-1α up-regulation. (D) Schematic illustrates the in vivo treatment schedule. Swiss Webster mice were ear-punched and injected several hours later in the back of the neck with either gel alone (G0) or drug/gel (Gd). Ear donut tissue was collected for protein and immunohistochemical (IHC) analysis on days 1 to 5. In (E), hole donuts (n = 6) were processed, and Western blot analysis was carried out using antibody to HIF-1α (green) and Coomassie-stained samples as loading controls (red) (N = 3). (F) Immunostaining of ear tissue with anti–HIF-1α antibody (green) and 4′,6-diamidino-2-phenylindole (DAPI) counterstain (blue). (G) Immunohistochemical quantitation for G0 (blue) and Gd (red) tissue showed nonoverlapping differences at all time points (n = 2 per treatment group, N = 2 experiments).
Fig. 4
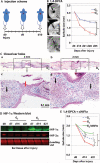
Fig. 4. Sequential injections of 1,4-DPCA drug/gel into mice at 5-day intervals promote ear hole closure
(A) Injection scheme for Swiss Webster mice ear-punched on day 0 and injected with drug/gel on days 0, 5, and 10 into separate locations at the base of the neck (one site every 5 days, indicated by arrows). (B) Mice were injected with either gel alone [G0; drug (0 mg/ml)/gel, blue line] or drug/gel [Gd; drug (2 mg/ml)/gel, red line] and were followed for 35 days. Results of wound healing with three injections of drug (2 mg/ml)/gel were compared to G0 on day 35 (**P < 0.0001; Student's t test; n = 10 ears, N = 4). Images on the left are representative of day 35 ear pinnae (arrows point to ear holes) (a, 0 mg drug/gel; b and c, 2 mg drug/gel). (C) Histological analysis of Alcian blue–stained day 35 ear tissue treated with 1,4-DPCA/gel (a and b) with the 2-mm area of the original hole indicated; (c and d) higher magnification (n = 2). Areas of cartilaginous condensation are shown (black arrows); blue staining indicates the presence of proteoglycans. Panel (c) shows a less complete closure where epithelial cells (red arrow) still persist in the new bridge region. In panel (d), ear hole closure is more complete with the bridge filled with mesenchymal cells. (D) Hole donuts (n = 6) from punched ears treated with gel alone (G0) or drug/gel (Gd) were processed, and Western blot analysis (using the Odyssey Classic Infrared Imaging System) was carried out (N = 3) with anti–HIF-1α (green) or anti–HIF-2α (red) antibodies; Coomassie protein staining is the loading control (red). (E) Treatment of Swiss Webster mice with drug/gel and siHif1a showed inhibition of ear hole closure at day 21 after injury (green line) compared to mice treated with drug/gel only (red line) (**P < 0.001). Drug/gel + siHif1a treatment (green line) compared to gel only (G0) (blue line) showed differences in inhibition of ear hole closure on day 14 (*P < 0.05) but not on day 21 (P = 0.051). Comparing ear hole closure in G0-treated (blue line) and Gd-treated (red line) Swiss Webster mice showed differences at day 21 (*P < 0.05; n = 4 to 7, N = 2). Analysis of variance (ANOVA) statistical analysis was used.
Fig. 5
Fig. 5. HIF-1α stabilization by 1,4-DPCA drug/gel induces stem and progenitor cell marker expression in vitro
(A) Stem and progenitor cell marker expression. Cultured MRL mouse fibroblasts (top row) and B6 mouse fibroblasts (middle row) were grown on coverslips and immunostained with antibodies against HIF-1α, NANOG, OCT3/4, CD133, PAX7, PREF1 (DLK1), NESTIN, von Willebrand factor (vWF), and CD34. B6 mouse fibroblasts were cultured with drug (2 mg/ml)/gel (B6 + Gd,; bottom row) for 24 hours (n = 5 to 10 fields per coverslip, N = 3). (B) Quantitative PCR analysis. Results of qPCR were consistent with immunohistochemistry showing marked changes in mRNA expression for all stem cell markers in the drug-treated cells compared to untreated cells (n = 3, N = 3, see table S6; *P < 0.05, **P < 0.01, Student's t test). (C) NANOG expression. MRL mouse fibroblasts (n = 3 coverslips per group) were treated with either siRNA control (left) or siHif1a (right) for 48 hours and were immunostained with anti-NANOG antibody (N = 2). All scale bars, 50 μm.
Fig. 6
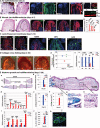
Fig. 6. Major steps in tissue regeneration
(A) Reepithelialization of punched ear tissue (n = 4 per group) was seen on day 2 after punch hole injury of Swiss Webster mice. Ear tissue from mice treated with gel only (G0) or drug/gel (Gd) was stained with hematoxylin and eosin (H&E); black arrows show incomplete (a) versus complete epidermis (b). Immunostaining of ear tissue was done for HIF-1α expression (c and d) and WNT5a expression (e and f) after G0 (c and e) or Gd (d and f) treatment; white arrows indicate epidermis. Immunohistochemistry of WNT5a protein expression in vitro without (g) or with (h) 1,4-DPCA drug/gel treatment; (i) Western blot analysis of pooled tissue (n = 3, N = 2). (B) H&E-immunostained sections of mouse ear tissue (day 4 after injury) show dedifferentiation in the area of the Gd-treated wound site (b, dashed black lines). Gd- and G0-treated ear tissues were immunostained for NESTIN, OCT3/4, neurofilament (NF), and PAX7 (c to f) (n = 4). G0 controls are shown in insets. Results of qPCR for these same genes are seen in (g) (n = 3, N = 3; *P < 0.05, **P < 0.01, Student's t test). (C) Ear tissue from Gd-treated versus G0-treated mice was immunostained to show laminin expression and basement membrane breakdown (white arrows, a and b, inset). (c to e) Expression of MMP9, MPO, and Ly6G protein in Gd-treated versus G0-treated (insets) mice (n = 4, N = 3). (A to C) Blue is DAPI counterstain; red or green color shows specific immunostaining. (D) Picrosirius red staining analysis shows day 14 collagen cross-linking in ear tissue from Swiss Webster mice treated with gel only G0 (a), drug/gel Gd (b), or Gd + siHif1a (c). Quantitated polarized light analysis (d) shows nonoverlapping differences between G0-treated and Gd-treated ear tissue and between Gd-treated and Gd + siHif1a–treated ear tissue (n = 2). (e) qPCR results show early (days 2 to 3 after injury) Loxl4 and Ctgf expression in Gd- and G0-treated ear tissue samples (n = 3 per group, N = 3; **P < 0.01, Student's t test). (E) Blastema growth and redifferentiation into cartilage and hair follicles was seen in Swiss Webster ear tissue after Gd treatment. (a) Low-magnification histological image of ear hole tissue stained with Alcian blue shows chondrogenesis in Gd-treated but not in G0-treated ear tissue. Solid vertical lines indicate ends of cartilage; broken lines show soft tissue borders. (b) Quantitation of soft tissue ear hole diameter at day 35 after injury. (c) A magnified image of Gd-treated mouse ear tissue indicates two new areas of chondrogenesis (g and h) and new hair follicles (k). Results of qPCR show up-regulated chondrogenesis-associated (d) and hair follicle–associated (i) genes on day 21 after injury in Gd-treated but not in G0-treated mouse ear tissue (*P < 0.05, **P < 0.01, Student's t test; n = 3, N = 3). Cartilage hole diameter (e) and cartilage area (f) (a histomorphometric measurement of Alcian blue staining in new growth area) were significantly different between Gd-treated and G0-treated mouse ear tissue (**P < 0.01, Student's t test; n = 4 to 6 ears). (j) Number of keratin 14–positive hair follicles in Gd-treated mouse ear tissue compared to Go-treated and normal mouse ear tissue. **P < 0.0001, ANOVA (n = 4 ears). Scale bars, 0.1 mm for all panels except for panel (Ah) (50 μm).

Similar articles

Cited by

References

    1. Kawasumi A, Sagawa N, Hayashi S, Yokoyama H, Tamura K. Wound healing in mammals and amphibians: Toward limb regeneration in mammals. Curr. Top. Microbiol. Immunol. 2013;367:33–49. - PubMed
    1. Joseph J, Dyson M. Tissue replacement in the rabbit's ear. Br. J. Surg. 1966;53:372–380. - PubMed
    1. Goss RJ, Grimes LN. Tissue interactions in regeneration of rabbit ear holes. Am. Zool. 1972;12:151–157.
    1. Clark LD, Clark RK, Heber-Katz E. A new murine model for mammalian wound repair and regeneration. Clin. Immunol. Immunopathol. 1998;88:35–45. - PubMed
    1. Kench JA, Russell DM, Fadok VA, Young SK, Worthen GS, Jones-Carson J, Henson JE, Nemazee D. Aberrant wound healing and TGF-β production in the autoimmune-prone MRL/+ mouse. Clin. Immunol. 1999;92:300–310. - PubMed

Publication types

Substances