. 2015 Jun 11;522(7555):236-9.
doi: 10.1038/nature14503. Epub 2015 Jun 3.

ESCRT-III controls nuclear envelope reformation

Affiliations

ESCRT-III controls nuclear envelope reformation

Yolanda Olmos et al. Nature. .

Abstract

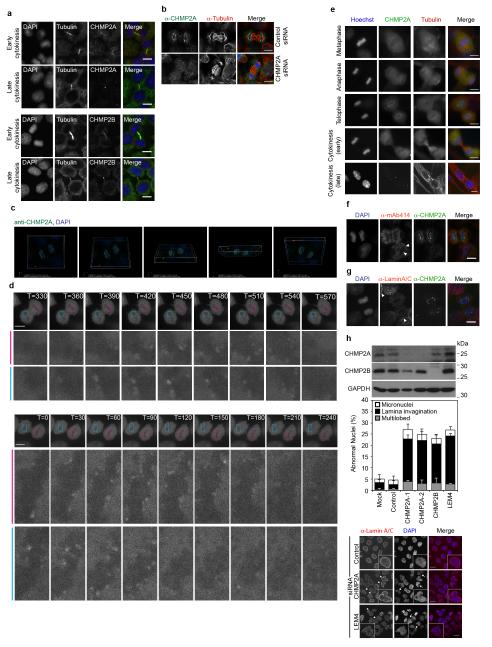
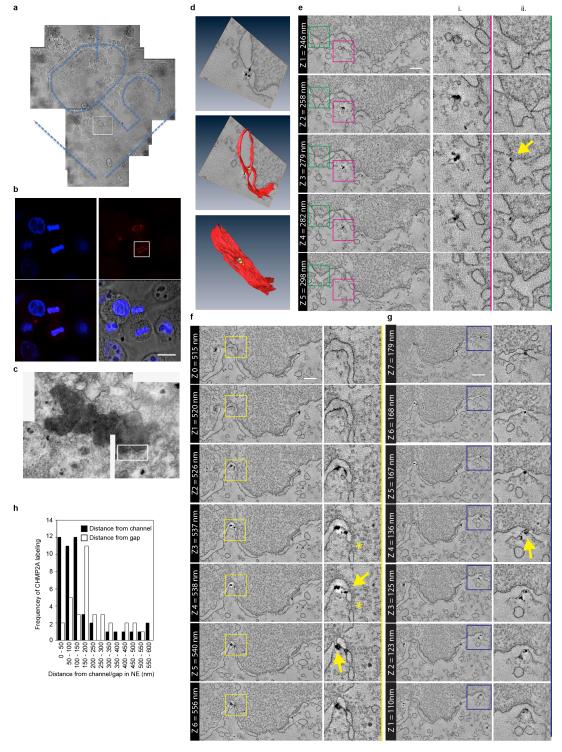
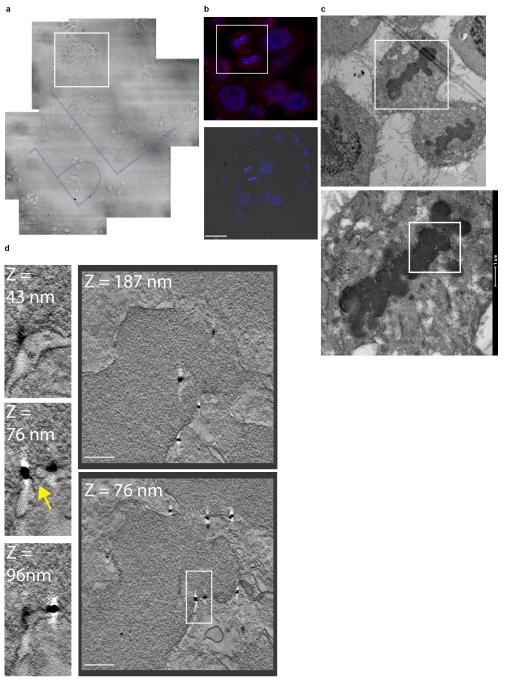
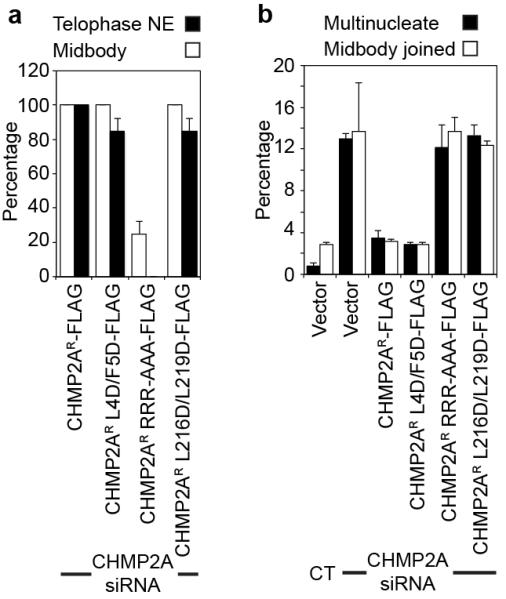
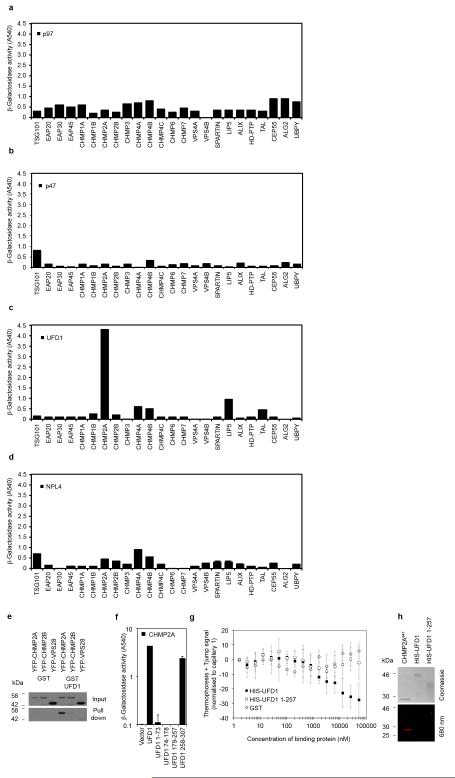
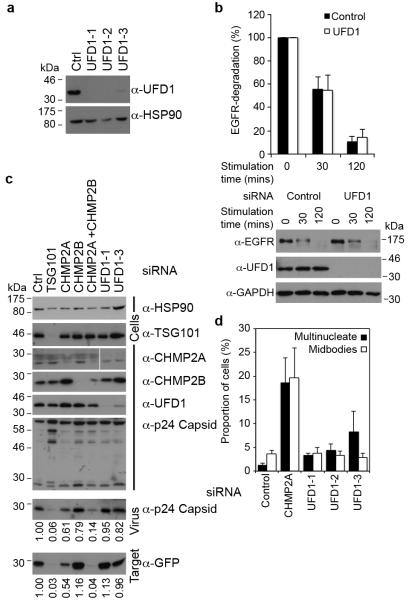
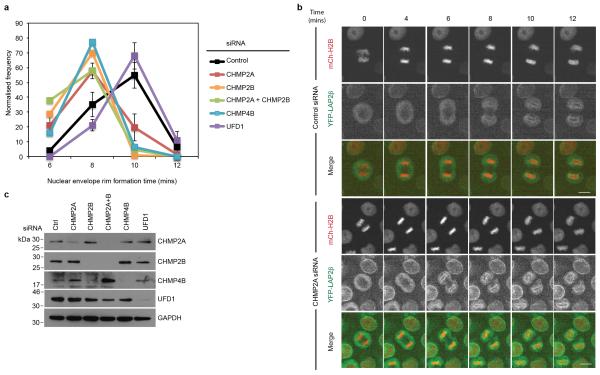
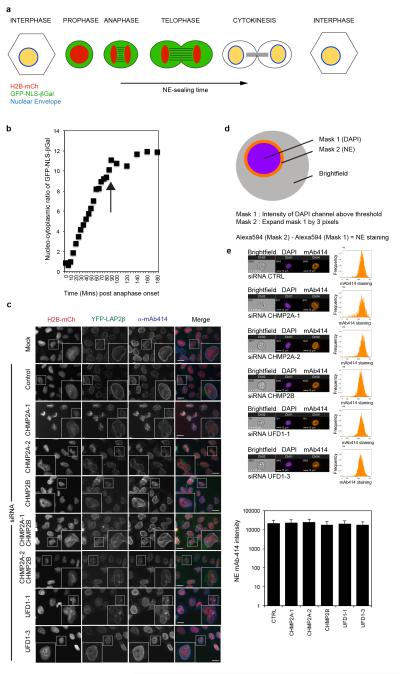
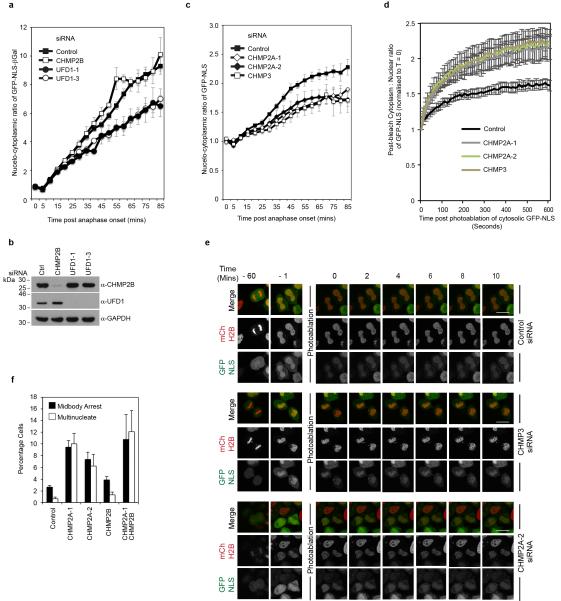
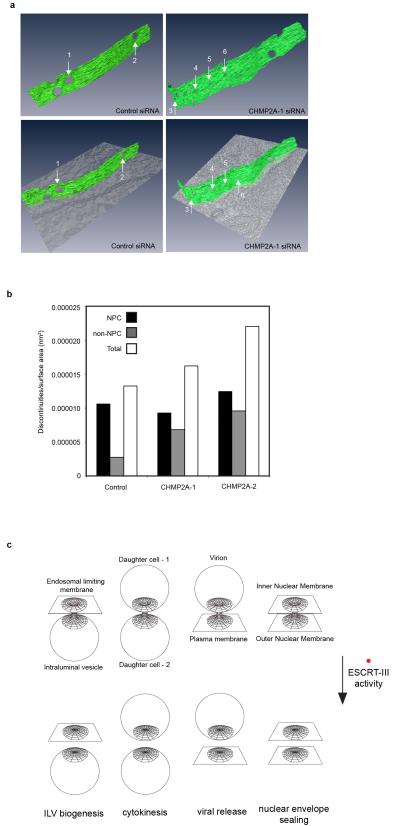
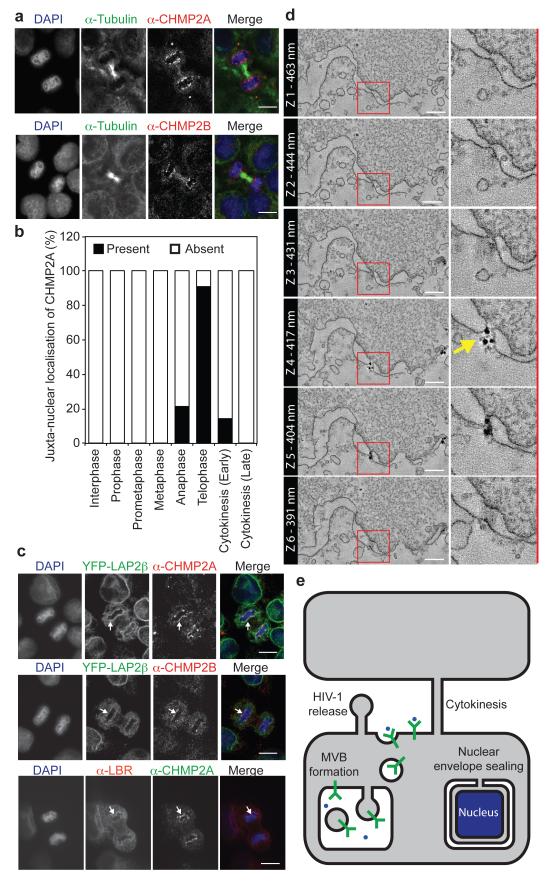
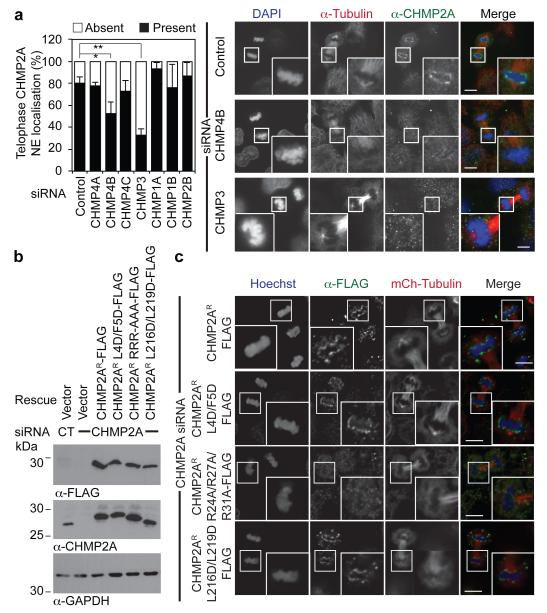
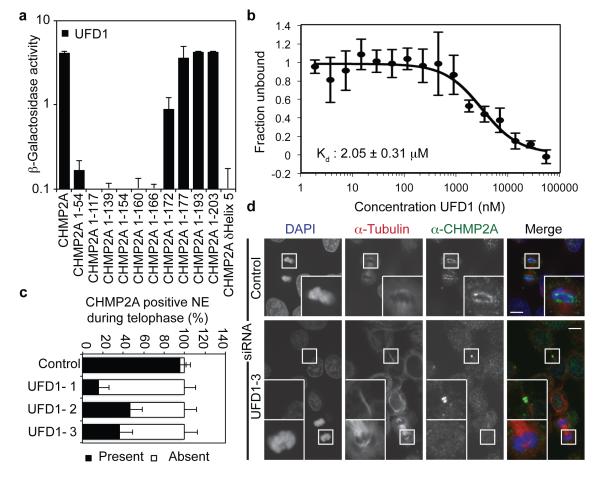
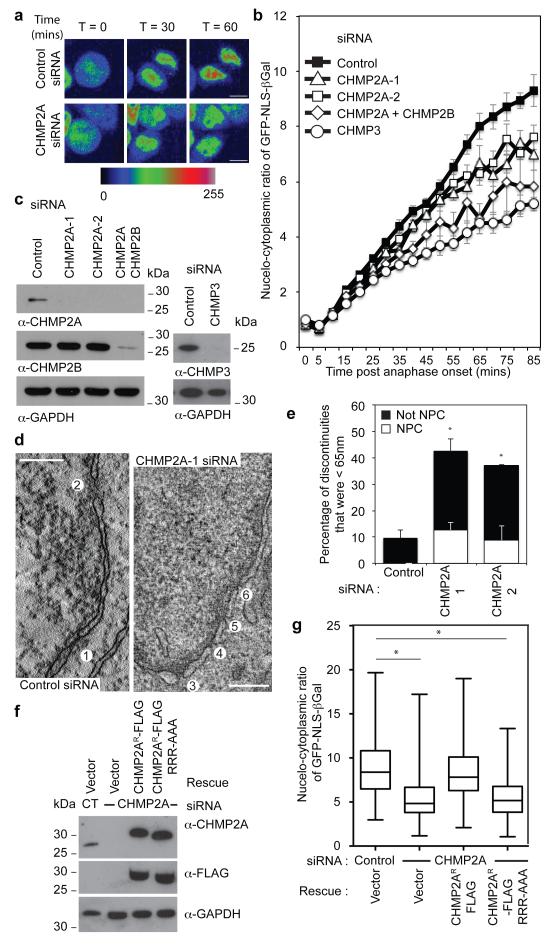
During telophase, the nuclear envelope (NE) reforms around daughter nuclei to ensure proper segregation of nuclear and cytoplasmic contents. NE reformation requires the coating of chromatin by membrane derived from the endoplasmic reticulum, and a subsequent annular fusion step to ensure that the formed envelope is sealed. How annular fusion is accomplished is unknown, but it is thought to involve the p97 AAA-ATPase complex and bears a topological equivalence to the membrane fusion event that occurs during the abscission phase of cytokinesis. Here we show that the endosomal sorting complex required for transport-III (ESCRT-III) machinery localizes to sites of annular fusion in the forming NE in human cells, and is necessary for proper post-mitotic nucleo-cytoplasmic compartmentalization. The ESCRT-III component charged multivesicular body protein 2A (CHMP2A) is directed to the forming NE through binding to CHMP4B, and provides an activity essential for NE reformation. Localization also requires the p97 complex member ubiquitin fusion and degradation 1 (UFD1). Our results describe a novel role for the ESCRT machinery in cell division and demonstrate a conservation of the machineries involved in topologically equivalent mitotic membrane remodelling events.


Figures

Extended Data Figure 1
Extended Data Figure 1. Localisation of ESCRT components during the cell cycle
A, B. Immunofluorescence analysis of HeLa cells stained with anti-tubulin, anti-CHMP2A or -CHMP2B and DAPI (A). Images in A representative of 2 acquired images per field of view. Cells in B were treated with Control or CHMP2A-targeting siRNA, images representative of 4 acquired images (control) or 2 acquired images (CHMP2A siRNA). C. Deconvolved projections of HeLa cells stained with anti-CHMP2A and DAPI, corresponds to stills from Supplemental Video 1, images representative of 2 deconvolved image series. D. HeLa cells stably expressing GFP-CHMP4B were imaged live during the anaphase to telophase transition. Telophase frames at 30 second intervals are presented, corresponding to stills from Supplemental Video 2, images representative of 4 acquisitions. E. Immunofluorescence analysis of human diploid fibroblasts stained with anti-CHMP2A, anti-tubulin and DAPI, images representative of 3 acquired cells per cell cycle phase. F, G. Immunofluorescence analysis of HeLa cells stained with anti-CHMP2A, DAPI and either, anti-mAb414 (F) or anti-LaminA/C (G), images representative of 5 acquired cells. Arrowheads indicate regions of formed nuclear pores or lamina as indicated. H. Quantification of abnormal nuclei (the presence of multiple lobes, micronuclei, lamina ingression or invagination) in HeLa cells transfected with the indicated siRNA and stained with anti-LaminA/C (1300 cells over 5 experiments quantified per treatment ± S.D.). Images representative of 3 (control, CHMP2A siRNA) or 2 (LEM4 siRNA) acquired fields of view and resolved cell lysates were examined by western blotting with anti-CHMP2A, anti-CHMP2B or anti-GAPDH antisera as indicated. In all cases, scale bar is 10 μm.
Extended Data Figure 2
Extended Data Figure 2. Correlative light and electron microscopy of endogenous CHMP2A localisation in telophase NE
A-C. Phase contrast (A), correlative immunofluorescence (B, scale bar is 10 μm) and transmission electron microscopy of HeLa cells stained with anti-CHMP2A, detected by Alexa594-fluoronanogold and DAPI. Boxed region in A is shown in B, boxed region in B is shown in C, in all cases, images representative of 3 cells prepared for CLEM. D. 3D rendering of tomographic reconstruction of forming NE from boxed region in C and Figure 1D, a single example of a nucleocytoplasmic channel was selected for 3D rendering. E-G. Z-slices extracted from tomographic reconstructions of forming NE depicting CHMP2A-localisation to isolated vesicles (Ei) and nucleo-cytoplasmic channels (arrows in Eii, F, G) at the indicated Z-heights, scale bar is 200 nm. Localisation of CHMP2A to nucleocytoplasmic channels was observed in 3 independent cells, data from a second cell are presented in Extended Data Figure 3. Note CHMP2A localisation to nucleocytoplasmic channels is distinct from nuclear pores (asterix in Extended Data Figure 2F). H. Quantification of CHMP2A labeling from 2 independently prepared cells, channels were defined as discontinuities up to 80 nm, and gaps were defined as discontinuities over 80 nm. Distances of the gold-particles from channels or gaps were measured on the tomograms in 3-dimensions and plotted as a histogram. The majority (74.4%) of gold label was found within 150 nm of nucleo-cytoplasmic channels and the majority (70.6 %) of the gold label was found more than 150 nm from the larger gaps in the NE.
Extended Data Figure 3
Extended Data Figure 3. Correlative light and electron microscopy of endogenous CHMP2A localisation in telophase NE
A-C. Phase contrast (A), correlative immunofluorescence (B) and transmission electron microscopy (C) of a second HeLa cell stained with anti-CHMP2A, detected by Alexa594-fluoronanogold and DAPI. Boxed region in A is shown in B, boxed region in B is shown in C. D. Z-slices extracted from tomographic reconstruction of forming NE from boxed region in C depicting CHMP2A-localisation to nucleo-cytoplasmic channels at the indicated Z-heights. Arrow indicates nucleocytoplasmic channel, scale bar is 200 nm, images in all cases representative of 3 cells processed for CLEM, quantification of gold localisation given in Extended Data Figure 2H.
Extended Data Figure 4
Extended Data Figure 4. Mitotic defects in cells reliant on mutated forms of CHMP2A
A. Quantification of CHMP2A recruitment to the telophase NE or the midbody from Figure 2C (n = 3 ± S.D., 10 cells (midbody or telophase) scored per experiment). B. Quantification of cytokinetic failure from cells treated with the indicated siRNA (300 cells were quantified per experiment, from 3 independent experiments ± S.D.).
Extended Data Figure 5
Extended Data Figure 5. Screening for ESCRT : p97 complex interactions
A-D. β-galactosidase activity of yeast co-transformed with the indicated Gal4 (ESCRT) and VP16 fused proteins (n = 2). E. Resolved cell lysates and glutathione-bound fractions from 293T cells transfected with the indicated fusion proteins were examined by western blotting with anti-GFP (n = 3). F. β-galactosidase activity of yeast co-transformed with the indicated Gal4 and VP16 fused proteins (n = 3 ± S.D.). G. MST experiments detailing binding of CHMP2A to GST (n = 4), HIS-UFD1 (n = 5) or HIS-UFD1 1-257 (n = 4, ± S.D.). As no reduction in thermophoresis signal was observed for GST or His-UFD1 1-257 across the concentration range, we present here the average thermophoresis signal change at equivalent protein concentrations for these three proteins, normalized to zero at the concentration in capillary 1. H. CHMP2A647, HIS-UFD1 and HIS-UFD1 1-257 were examined by IR imaging or coomassie staining.
Extended Data Figure 6
Extended Data Figure 6. UFD1 depletion does not effect ESCRT-dependent receptor degradation, lentivirus release or cytokinetic abscission
A. Resolved cell lysates of HeLa cells transfected with the indicated siRNA were examined by western blotting with anti-UFD1 or anti-HSP90 antisera. B. Resolved lysates of human diploid fibroblasts transfected with the indicted siRNA and treated for the indicated times with epidermal growth factor (20 ng/ml) were examined by western blotting with anti-EGFR, anti-UFD1 and anti-GAPDH antisera. EGFR degradation was quantified by densitometry (n = 3, ± S.D.). C. Resolved cell lysates from 293T cells transfected with the indicated HIV-1 based lentiviral plasmids, a virally packaged GFP-plasmid, and the indicted siRNA were examined by western blotting with anti-p24 capsid, -HSP90, -TSG101, -CHMP2A, -CHMP2B and –UFD1 antibodies. Viral supernatants were collected and used to infect target HeLa cells. Resolved virions present in the 293T supernatant were examined by western blotting with anti-p24 capsid. Resolved lysates of infected HeLa cells were examined by western blotting with anti-GFP. Virion release was the ratio of released to cellular p24-capsid, as quantified by densitometry (n = 2); infectivity was quantified as GFP-signal in target cells, as quantified by densitometry (n = 2). D, siRNA-transfected HeLa cells were fixed and stained with anti-Tubulin. Multinucleate cells (n = 5, ± S.D.) or cells connected by midbodies (n = 5, ± S.D.) were scored visually, 300 cells scored per experiment.
Extended Data Figure 7
Extended Data Figure 7. ESCRT-depletion impairs NE-rim formation
A,B. Timelapse microscopy analysis and quantification of NE-rim formation in HeLa cells stably expressing YFP-LAP2β and mCh-H2B and treated with the indicated siRNA Scale bar is 10 μm. Time for rim formation post anaphase onset given (mins) (Ctrl 8.53 ± 0.09, 226 cells analysed over 8 independent experiments; CHMP2A-1, 7.60 ± 0.09, 205 cells analysed over 7 independent experiments; CHMP2A-2, 6.86 ± 0.12, 37 cells analysed over 2 independent experiments; CHMP2B, 6.92 ± 0.09, 79 cells analysed over 4 independent experiments; CHMP2A and CHMP2B, 6.84 ± 0.13, 50 cells analysed over 2 independent experiments; CHMP4B, 7.07 ± 0.14, 44 cells analysed over 2 independent experiments; UFD1 9.2 ± 0.18, 39 cells analysed over 3 independent experiments. All times mean ± S.E.M, in minutes, images representative of the indicated number of cell analysed). C. Resolved cell lysates from A were analysed by western-blotting with the indicated antisera.
Extended Data Figure 8
Extended Data Figure 8. ESCRT-depletion does not impair nuclear pore formation
A. Schematic of nuclear envelope integrity assay. B. Control siRNA treated HeLa cells reporting nucleo-cytoplasmic partitioning using the GFP-NLS-βGal assay, average NE compartmentalisation from 20 cells presented. Nucleo-cytoplasmic partitioning stabilises at 85 minutes (indicated by arrow). C. Immunofluorescence analysis of HeLa cells stably expressing YFP-LAP2β transfected with the indicated siRNA then stained with anti-mAb414 and DAPI (n = 3), Scale bar is 10 μm. D. Mask employed to quantify nuclear pore formation by image-based flowcytometry (Imagestream). E. Imagestream analysis of HeLa cells transfected with the indicated siRNA, then stained with anti-mAb414 and DAPI. Nuclear pore intensity quantified by mask described in D. Representative images from 2 independent experiments, histogram and population averages displayed, graphical quantification of NPC intensity from the indicated number of gated cells (Control, 3045; CHMP2A-1, 1256; CHMP2A-2, 2152; CHMP2B, 5237; UFD1-1, 4146; UFD1-3, 4325; error bars are ± S.D.).
Extended Data Figure 9
Extended Data Figure 9. Requirements for nucleocytoplasmic compartmentalization
A. Quantification of NE-sealing from siRNA treated cells as in Figure 4B, (Ctrl 140 cells from 7 independent experiments; UFD1-1, 60 cells from 3 independent experiments, P = 0.044; UFD1-3, 60 cells from 3 independent experiments, P = 0.021; CHMP2B 40 cells from 2 independent experiments, N.S. All times quoted ± S.E.M. in minutes; 2-tailed student’s T-test was used to assess significance at the 85-minute timepoint). B. Resolved cell lysates from A were analysed by western-blotting with the indicated antisera. C. Nuclear envelope integrity assay as performed with cells stably expressing mCh-H2B and GFP-NLS and transfected with the indicated siRNA. Differences in nucleo-cytoplasmic partitioning was assessed after plateau at the 65 minute timepoint using a 2-tailed Student’s T-test : (Ctrl, 79 cells from 4 independent experiments, CHMP2A-1, 60 cells from 3 independent experiments, P = 0.048; CHMP2A-2, 52 cells from 3 independent experiments, P = 0.011; CHMP3, 28 cells from 3 independent experiments, P = 0.028, error bars represent S.E.M.). D, E. HeLa cells stably expressing mCh-H2B and GFP-NLS were transfected with the indicated siRNA and imaged live. 60 minutes post anaphase onset, cytoplasmic signal was photo-ablated (T = 0) and Recovery of cytoplasmic signal from the nuclear pool was calculated for the indicated conditions (Cytoplasmic : Nuclear ratio of GFP-NLS was normalized to T = 0. Ctrl, 21 cells from 4 independent experiments; CHMP2A-1, 24 cells from 4 independent experiments, P = 0.04; CHMP2A-2, 23 cells from 4 independent experiments, P = 0.05; CHMP3, 15 cells from 3 independent experiments, P = 0.004, 2-tailed Student’s t-test was used to assess significance after 10 minutes. In D, error bars represent S.E.M. in E, scale bar is 10 μm. F. Scoring of multinucleate and midbody-connected HeLa cells transfected with the indicated siRNA and stained with anti-tubulin and DAPI (300 cells analysed per condition, n = 4 ± S.D.).
Extended Data Figure 10
Extended Data Figure 10. Affect of CHMP2A depletion on NE discontinuities
A. Presentation of reconstructed tomograms from Figure 4D. B. CHMP2A-depelted cells exhibited more non-NPC discontinuities per unit area whilst the number of NPC per unit area was constant, tomograms as described in Figure 4E were scored for discontinuities. The internal diameter of NPCs was slightly reduced in CHMP2A-depleted cells (Control 84 ± 7.6 nm, CHMP2A-1, 74 ± 8.8 nm; CHMP2A-2, 74 ± 5.7 nm). C. Schematic depicting topological equivalent of ESCRT-III-dependent membrane fusion events.
Figure 1
Figure 1. ESCRT-III localises to the forming nuclear envelope
A. HeLa cells stained with anti-tubulin, either anti-CHMP2A or anti-CHMP2B and 4′,6-diamidino-2-phenylindole (DAPI). Scale bar is 10 μm, images representative of 3 acquired images in each case. B. Quantification of juxta-nuclear CHMP2A localisation during mitosis from A, quantification from 20 cells in interphase, prophase, pro-metaphase and metaphase, 23 cells in anaphase, 24 cells in telophase, 36 cells in early cytokinesis and 20 cells in late cytokinesis. C. HeLa cells stained with DAPI, anti-CHMP2A or anti-CHMP2B and either stably expressing YFP-LAP2β, or stained with anti-LBR. Arrows indicate regions of colocalisation. Scale bar is 10 μm, images representative of 2 (anti-CHMP2B and YFP-LAP2β, anti-LBR and anti-CHMP2A) or 4 (anti-CHMP2A and YFP-LAP2β) acquired images. D. Tomographic slices of HeLa cells stained with fluoronanogold anti-CHMP2A. Correlation depicted in Extended Data Figure 2A-2C, arrow indicates nucleocytoplasmic channel, scale bar is 200 nm, image representative of 25 gold-decorated nucleocytoplasmic channels and quantified in Extended Data Figure 2H. E. Schematic depicting topological equivalence between annular fusion of the NE and ESCRT-dependent membrane fusion events.
Figure 2
Figure 2. Classical ESCRT-interactions govern CHMP2A telophase-NE localisation
A. Immunofluorescence and quantification of NE localisation in HeLa cells transfected with the indicated siRNA and stained with anti-CHMP2A, anti-tubulin and DAPI (Number of cells scored from 4 independent experiments: Control, 58; CHMP4A, 59; CHMP4B, 55; CHMP4C, 53; CHMP3, 64; CHMP1A, 47; CHMP1B 52; CHMP2B, 44. Percentage NE localisation given ± S.D. * P = 0.014, ** P = 0.0004 (2-tailed Student’s T-test), Scale bar is 10 μm, images representative of 47 cells (Control), 26 cells (CHMP4B siRNA) and 42 cells (CHMP3 siRNA). B. Western blotting of lysates from siRNA-depleted HeLa cells stably expressing mCherry-tubulin and the indicated CHMP2AR-FLAG with anti-FLAG, anti-CHMP2A or anti-GAPDH antisera. C. Immunofluorescence of CHMP2AR-FLAG recruitment to the telophase NE in CHMP2A-depleted cells. Scale bar is 10 μm, quantification in Extended Data Figure 4A, images representative of 30 cells (Control), 26 cells (L4D/F5D), 30 cells (RRR-AAA) and 26 cells (L216D/L219D).
Figure 3
Figure 3. UFD1 directs NE-localisation of CHMP2A
A. β-galactosidase activity of yeast co-transformed with the indicated Gal4 and VP16 fused proteins (n = 3 ± S.D.). B. MST experiments displaying interaction of HIS-UFD1 with CHMP2A (Fraction unbound displayed, n = 5 ± S.D.) C, D. Immunofluorescence (D) and quantification of NE localisation (C: Control, 35 cells; UFD1-1, 42 cells; UFD1-2, 25 cells; UFD1-3, 39 cells; average ± S.D. presented from 4 independent experiments) in HeLa cells transfected with the indicated siRNA and stained with anti-CHMP2A, anti-tubulin and DAPI, scale bar is 10 μm, images representative of 23 cells (Control), 34 cells (UFD1-1) 14 cells (UFD1-2) and 24 cells (UFD1-3).
Figure 4
Figure 4. ESCRT-III depletion disrupts nuclear envelope integrity
A. Timelapse analysis of NE-sealing in siRNA transfected HeLa cells stably expressing H2B-mCh and GFP-NLS-βGal. GFP-signal presented according to pseudocolour scale at the indicated timepoints. Scale bar is 10 μm, a single image was pseudocoloured for demonstrative purposes. B. Quantification of NE-sealing from siRNA treated cells as in A, (Cells were quantified at each time point; Ctrl 140 cells from 7 independent experiments; CHMP2A-1, 98 cells from 5 independent experiments, P = 0.047; CHMP2A-2, 80 cells from 4 independent experiments, P = 0.023; CHMP2A + CHMP2B, 60 cells from 3 independent experiments, P = 0.006; CHMP3, 34 cells from 3 independent experiments, P = 0.002. All values quoted ± S.E.M.; 2-tailed Student’s t-test used to assess significance after 85 minutes). C. Western blotting of cell lysates from B with anti-CHMP2A, anti-CHMP2B anti-CHMP3 or anti-GAPDH antisera. D. Z-slices extracted from a correlative tomographic reconstruction of the NE at 60 minutes post anaphase onset from the indicated siRNA-transfected mCh-Tub HeLa cells. The numbered circles correspond to discontinuities labeled in the 3D reconstructions in Extended Data Figure 10A, scale bar is 200 nm, image representative of 6 (control) and 12 (CHMP2A-1 siRNA) tomographic reconstructions. E. The percentage of discontinuities smaller than 65 nm was scored. Discontinuities in this range that were not NPCs as a percentage of total discontinuities (including NPCs) for n number of reconstructed tomograms: Control 9.4 ± 3.0, n = 6; CHMP2A-1, 29.9 ± 4.7, P = 0.01, n = 12; CHMP2A-2, 28.3 ± 2.0, P = 0.021, n = 2. The increase in the percentage of non-NPC discontinuities was assessed by 2-tailed Student’s T-test (average diameter of non-NPC discontinuities was 38 ± 22 nm (CHMP2A-1) and 58 ± 19 nm (CHMP2A-2)). F. Western blotting of lysates from siRNA-treated HeLa cells stably expressing H2B-mCh, GFP-NLS-βGal and siRNA-resistant CHMP2AR-FLAG with anti-CHMP2A, anti-FLAG or anti-GAPDH antisera. G. Quantification of NE-sealing from cells treated with siRNA as in F and imaged from 4 independent experiments, (Mean nucleo-cytoplasmic ratio given 85 minutes post anaphase onset ± S.D, 2-tailed Student’s T-test was used to assess significance across 4 independent experiments (*); Ctrl, 8.9 ± 3.1, n = 174 ; CHMP2A siRNA 5.4 ± 2.6, n = 171, P = 0.0006; CHMP2A siRNA + CHMP2AR-FLAG 8.4 ± 3.3, n = 132, not-significant; CHMP2A siRNA + CHMP2AR-FLAG RRR-AAA 5.4 ± 2.2, n = 196, P = 0.0001).

Comment in

Similar articles

Cited by

References

    1. Burke B. The nuclear envelope: filling in gaps. Nat. Cell Biol. 2001;3:E273–4. - PubMed
    1. Anderson DJ, Hetzer MW. Shaping the endoplasmic reticulum into the nuclear envelope. J. Cell. Sci. 2008;121:137–142. - PubMed
    1. Schooley A, Vollmer B, Antonin W. Building a nuclear envelope at the end of mitosis: coordinating membrane reorganization, nuclear pore complex assembly, and chromatin decondensation. Chromosoma. 2012;121:539–554. - PMC - PubMed
    1. Burke B, Ellenberg J. Remodelling the walls of the nucleus. Nat. Rev. Mol. Cell Biol. 2002;3:487–497. - PubMed
    1. Lu L, Ladinsky MS, Kirchhausen T. Formation of the postmitotic nuclear envelope from extended ER cisternae precedes nuclear pore assembly. J. Cell Biol. 2011;194:425–440. - PMC - PubMed

Publication types

MeSH terms

Substances