. 2015 Jun 1:5:10739.
doi: 10.1038/srep10739.

3, 4-dihydroxyl-phenyl lactic acid restores NADH dehydrogenase 1 α subunit 10 to ameliorate cardiac reperfusion injury

Affiliations

3, 4-dihydroxyl-phenyl lactic acid restores NADH dehydrogenase 1 α subunit 10 to ameliorate cardiac reperfusion injury

Xiao-Yuan Yang et al. Sci Rep. .

Abstract

The present study aimed to detect the role of 3, 4-dihydroxyl-phenyl lactic acid (DLA) during ischemia/reperfusion (I/R) induced myocardial injury with emphasis on the underlying mechanism of DLA antioxidant. Male Spragu-Dawley (SD) rats were subjected to left descending artery occlusion followed by reperfusion. Treatment with DLA ameliorated myocardial structure and function disorder, blunted the impairment of Complex I activity and mitochondrial function after I/R. The results of 2-D fluorescence difference gel electrophoresis revealed that DLA prevented the decrease in NDUFA10 expression, one of the subunits of Complex I. To find the target of DLA, the binding affinity of Sirtuin 1 (SIRT1) to DLA and DLA derivatives with replaced two phenolic hydroxyls was detected using surface plasmon resonance and bilayer interferometry. The results showed that DLA could activate SIRT1 after I/R probably by binding to this protein, depending on phenolic hydroxyl. Moreover, the importance of SIRT1 to DLA effectiveness was confirmed through siRNA transfection in vitro. These results demonstrated that DLA was able to prevent I/R induced decrease in NDUFA10 expression, improve Complex I activity and mitochondrial function, eventually attenuate cardiac structure and function injury after I/R, which was possibly related to its ability of binding to and activating SIRT1.


Conflict of interest statement

The authors declare no competing financial interests.

Figures

Figure 1
Figure 1. DLA administration diminishes I/R-induced infarct.
A, Representative images of myocardial tissue sections stained with TTC and Evans blue. The rats in I/R groups were subjected to 30 min ischemia and 90 min reperfusion with intravenous injection of normal saline (NS) or DLA (dose ranging from 1.25 mg/kg to 20 mg/kg). The non-ischemic area is indicated by blue, the AAR by red and the IA by white. B and C, Quantitative analysis of infarct size of myocardial tissues. The ratios of IA to AAR and AAR to LA are shown. Results are presented as mean ± S.E.M (n = 6) * p < 0.05 vs. SHAM+NS group, # p < 0.05 vs. I/R+NS group, † p < 0.05 vs I/R+DLA 1.25 mg/kg, & p<0.05 vs I/R+DLA 2.5 mg/kg.
Figure 2
Figure 2. DLA administration attenuates I/R-induced morphological alterations and leukocyte infiltration.
A, Representative photographs of myocardial tissues stained with hematoxylin and eosin. Rats were subjected to sham operation and administrated with normal saline (SHAM+NS) or DLA (5 mg/kg, SHAM+DLA), or to I/R with normal saline (I/R+NS) or DLA (5 mg/kg, I/R+DLA). Bar = 100 μm. a: disordered and disrupted myocardial fiber. b: interstitial edema. c: inflammatory cell infiltration. B, Representative myocardial tissue sections stained for F-actin and nuclei (red and blue, respectively, in overlays). F-actin is labeled by rhodamine phalloidin. Bar = 25 μm. d: disordered and disrupted myocardial F-actin. C, Photomicrographs of immunohistochemistry staining for myeloperoxidase (MPO) in myocardium of each group, respectively. Bar = 100 μm. e: MPO-positive cells in myocardium. D, Quantitative evaluation of MPO-positive cells infiltrating into myocardial tissue in different groups. Results are presented as mean ± S.E.M (n = 6) * p < 0.05 vs. SHAM+NS group, # p < 0.05 vs. I/R+NS group.
Figure 3
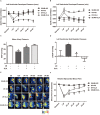
Figure 3. DLA administration results in better recovery of LV function and MBF.
A and B, Results of left ventricular developed pressure (max) and left ventricular developed pressure (min) before ischemia (baseline), after 30 min of ischemia (I 30’), and after 10 min (I/R 10’), 30 min (I/R 30’), 60 min (I/R 60’) and 90 min of reperfusion (I/R 90’) in four groups, respectively. C and D, Effect of DLA administration on MAP and LVEDP at the end of reperfusion in various groups. E, Representative MBF pictures acquired by Laser Doppler Perfusion Imager at different time points in 4 different groups. Color scale illustrates MBF with dark blue through red representing low to high flow. F, Statistical results of MBF. MBF is expressed as a percentage of baseline MBF. Three images were acquired and evaluated for each rats at each time point. Results are presented as mean ± S.E.M (n = 6) * p < 0.05 vs. SHAM+NS group, # p < 0.05 vs. I/R+NS group.
Figure 4
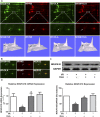
Figure 4. DLA administration restores I/R induced reduction in NDUFA10 expression.
A, Representative 2D-DIGE images of heart lysates from ischemic region in various groups. Selected and enlarged regions of 2D-DIGE images displaying NDUFA10 are shown in the middle panel, while three-dimensional views of the selected regions displaying NDUFA10 expression alterations shown in the lower panel. Arrows indicate NDUFA10. B, The overlay images with yellow spots indicating proteins that have equal expression levels in both groups, green spots indicating proteins down-regulated in I/R+NS group. Arrows indicate NDUFA10. C, Western blot and statistical analysis of NDUFA10 based on the data of 3 independent experiments normalized to GAPDH. The gels have been run under the same experimental conditions. D, NDUFA10 mRNA levels determined by reverse transcription real-time PCR. Quantitative results of mRNA expression were derived from 5 independent experiments and normalized to GAPDH. Results are presented as mean ± S.E.M. * p < 0.05 vs. SHAM+NS group, # p < 0.05 vs. I/R+NS group.
Figure 5
Figure 5
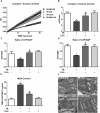
DLA administration restores Complex I activity and mitochondrial function after I/R. A, Time course of OD at 450 nm, the slope being proportional to Complex I activity. B, Complex I activity based on the slope of increase in OD at 450 nm. C and D, Quantitative results of ratios of ATP/ADP and ATP/AMP in ischemic heart homogenates in various groups after I/R, respectively. E, Statistical analyses of MDA of ischemic heart homogenates in various groups after I/R. F, Representative electron micrographs of myocardial tissues of rats from 4 groups. a: mitochondrial swelling. b: disarranged and obscure crista. c: vacuoles among crista. d: disrupted myofilament and sarcomere. Results are presented as mean ± S.E.M (n = 6) * p < 0.05 vs. SHAM+NS group, # p < 0.05 vs. I/R+NS group.
Figure 6
Figure 6
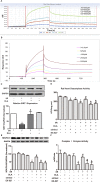
DLA binds to and activates SIRT1. A, Sensorgram binding curves of four different concentrations of DLA (2500, 5000, 10000, and 20000 μM, curves from bottom to top) measured by BLI. B, Representative sensorgrams obtained from the injections of DLA at concentrations of 312.5, 625, 1250, 2500, and 5000 μM (curves from bottom to top) using SPR. C, Representative western blot bands of SIRT1 in various groups shown above and quantitative results below. The gels have been run under the same experimental conditions. D, The deacetylase activity of rats myocardial tissue (n = 6) in various groups with or without SIRT1 inhibitor sirtinol and EX-527. E, The representative western blot bands and the quantitative results of NDUFA10 in various groups with or without sirtinol and EX-527. The gels have been run under the same experimental conditions. Quantification results for NDUFA10 band intensities were normalized to GAPDH from 3 independent experiments. F, Complex I activity based on the slope of increase in OD at 450 nm in all groups with or without sirtinol and EX-527. Results are presented as mean ± S.E.M. * p < 0.05 vs. SHAM+NS group, # p < 0.05 vs. I/R+NS group, & p < 0.05 vs. I/R+DLA group.
Figure 7
Figure 7
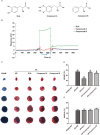
DLA derivatives exhibit lower affinity for SIRT1 and impaired ability for reducing infarct size after I/R. A, The structures of DLA, Compound A and Compound B. B, SPR binding curves of DLA, Compound A and Compound B to SIRT1, subtracting non-specific binding to bovine serum albumin (BSA), at the same concentration of 1250 μM. C, Representative images of myocardial tissues stained with TTC and Evans blue in rats of SHAM group and rats subjected to I/R with or without injection of DLA (5 mg/kg), Compound A (5 mg/kg) and Compound B (5 mg/kg). D to E, Quantitative analyses of infarct size in myocardial tissues. The ratios of IA to AAR (D), and AAR to LA (E) are shown. Results are presented as mean ± S.E.M (n = 6) * p < 0.05 vs. sham group, # p < 0.05 vs. I/R group, & p < 0.05 vs. I/R+DLA group.
Figure 8
Figure 8
Knockdown of SIRT1 in H9c2 cells reduces the protective role of DLA after H/R. A, Western blot bands and statistical analysis of SIRT1 in H9c2 cells treated with control siRNA or SIRT1 siRNA. The quantification was based on the data of 4 independent experiments and normalized to GAPDH. B and C, Representative western blot bands of SIRT1 and NDUFA10 expression in various groups of H9c2 cells after DLA treatment with or without SIRT1 siRNA (n = 6). D, Complex I activity in H9c2 cells from various groups based on the slope of increase in OD at 450 nm. E, Mitochondrial ROS estimated by DHR123 fluorescence in H9c2 cells of various groups. F, CCK-8 assay of H9c2 cells showing the cell viability in different groups. Results are presented as mean ± S.E.M (n = 6) * p < 0.05 vs. control group, # p < 0.05 vs. H/R group, & p < 0.05 vs. H/R+DLA group.

Similar articles

Cited by

References

    1. Yellon DM, H. D. Myocardial reperfusion injury. N Engl. J. Med. 357, 1121–1135 (2007). - PubMed
    1. Boden W. E. et al. Optimal medical therapy with or without PCI for stable coronary disease. N Engl J Med 356, 1503–1516, 10.1056/NEJMoa070829 (2007). - DOI - PubMed
    1. Fan Q. et al. Inhibition of Fas-associated death domain-containing protein (FADD) protects against myocardial ischemia/reperfusion injury in a heart failure mouse model. PLoS One 8, e73537, 10.1371/journal.pone.0073537 (2013). - DOI - PMC - PubMed
    1. Katz M. Y. et al. Three-dimensional myocardial scarring along myofibers after coronary ischemia-reperfusion revealed by computerized images of histological assays. Physiol Rep 2, 10.14814/phy2.12072 (2014). - DOI - PMC - PubMed
    1. Borutaite V., Jekabsone A., Morkuniene R. & Brown G. C. Inhibition of mitochondrial permeability transition prevents mitochondrial dysfunction, cytochrome c release and apoptosis induced by heart ischemia. J Mol Cell Cardiol 35, 357–366 (2003). - PubMed

Publication types

MeSH terms

LinkOut - more resources