. 2015 Jun 1:6:7140.
doi: 10.1038/ncomms8140.

Prmt5 is a regulator of muscle stem cell expansion in adult mice

Affiliations

Prmt5 is a regulator of muscle stem cell expansion in adult mice

Ting Zhang et al. Nat Commun. .

Abstract

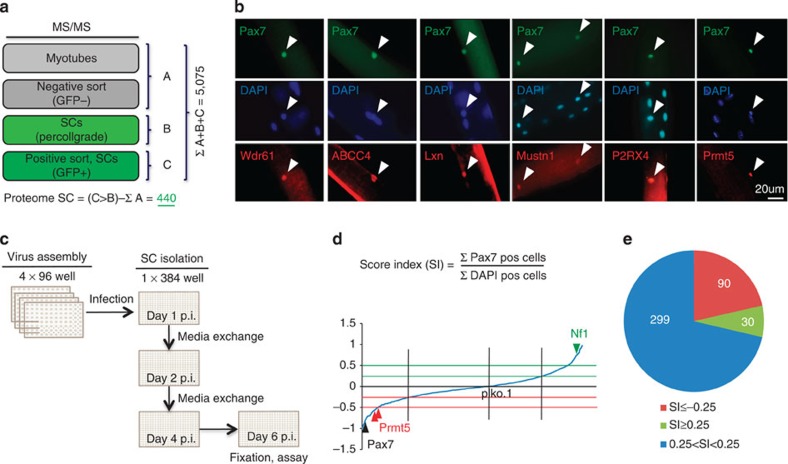
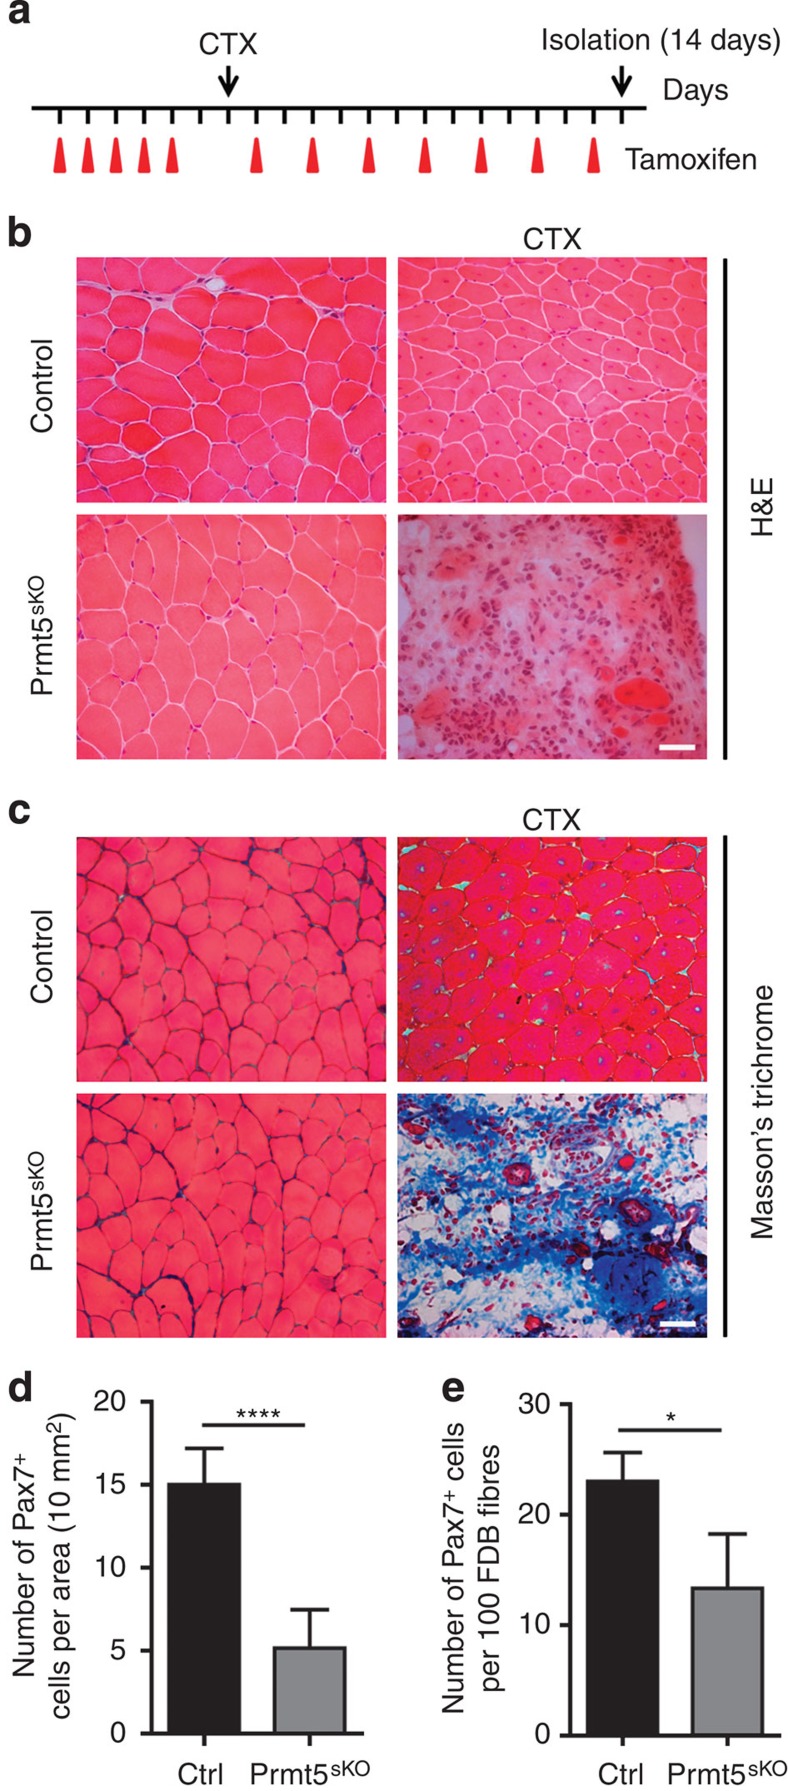
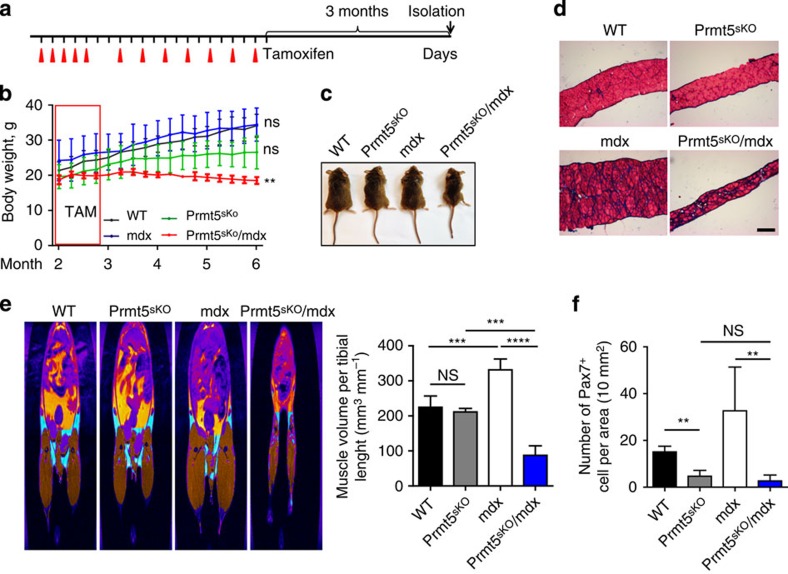
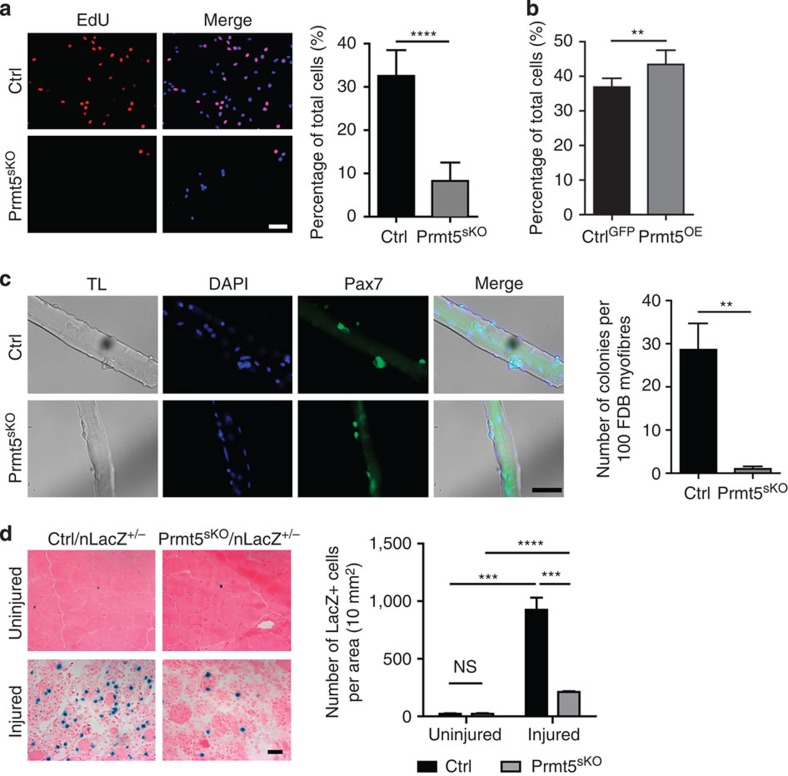
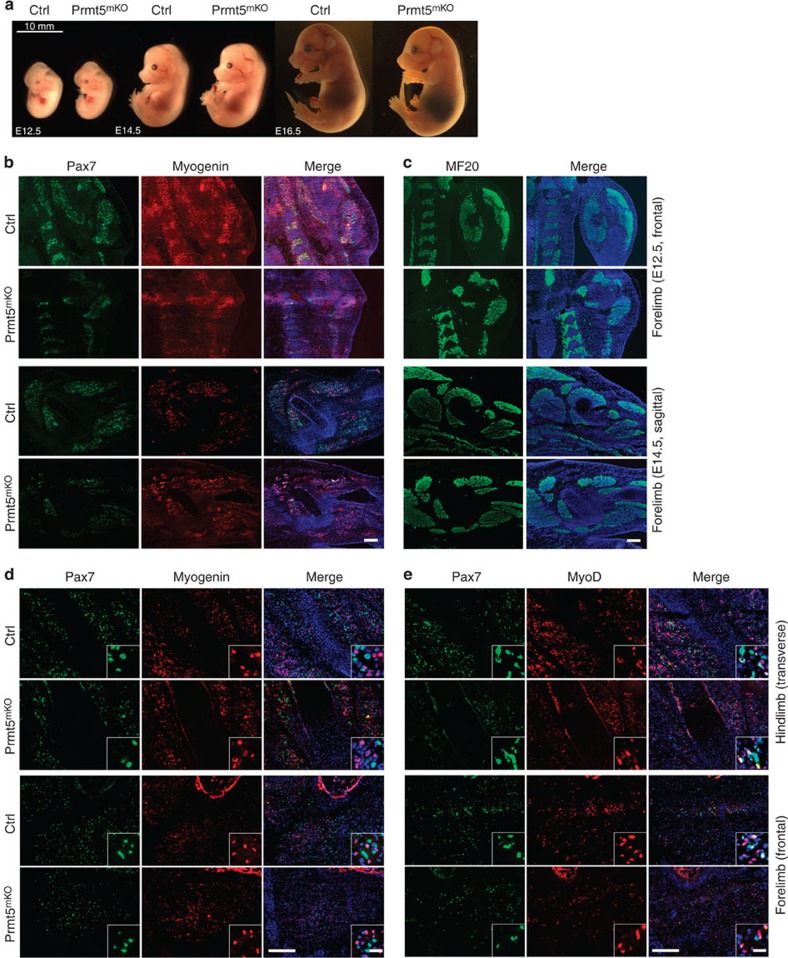
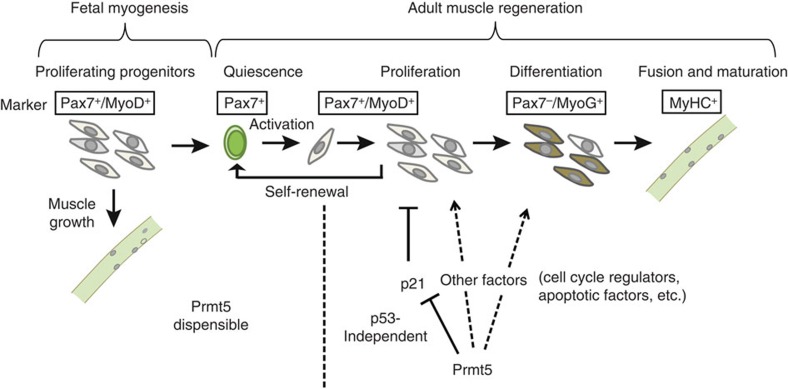
Skeletal muscle stem cells (MuSC), also called satellite cells, are indispensable for maintenance and regeneration of adult skeletal muscles. Yet, a comprehensive picture of the regulatory events controlling the fate of MuSC is missing. Here, we determine the proteome of MuSC to design a loss-of-function screen, and identify 120 genes important for MuSC function including the arginine methyltransferase Prmt5. MuSC-specific inactivation of Prmt5 in adult mice prevents expansion of MuSC, abolishes long-term MuSC maintenance and abrogates skeletal muscle regeneration. Interestingly, Prmt5 is dispensable for proliferation and differentiation of Pax7(+) myogenic progenitor cells during mouse embryonic development, indicating significant differences between embryonic and adult myogenesis. Mechanistic studies reveal that Prmt5 controls proliferation of adult MuSC by direct epigenetic silencing of the cell cycle inhibitor p21. We reason that Prmt5 generates a poised state that keeps MuSC in a standby mode, thus allowing rapid MuSC amplification under disease conditions.


Figures

Figure 1
Figure 1. Identification of regulators of stem cell homeostasis in a MuSC proteome-based shRNA screen.
(a) Mass spectrometry (MS)-based identification of MuSC-enriched proteins (Proteome SC) using samples from fractionated skeletal muscles including purified myotubes, Pax7-GFP mononuclear cells, percoll-gradient purified and Pax7-GFP+ MuSC. (b) Immunofluorescence validation of identified proteins (red) counterstained with Pax7 antibody (green) and DAPI (blue; scale bar, 20 μm). (c) Schematic outline of the shRNA screen against corresponding genes of the satellite cell proteome. Phenotypic scores are calculated as ratios of Pax7+/DAPI+ nuclei for each well. (d) Poisson distribution of relative Pax7 expression for all 2,226 shRNAs targeting 419 genes. Red and green lines indicate phenotypic scores lower or higher than 0.25 percentiles normalized to plko.1 empty vector control. Knockdown of Pax7 reduces proliferation and enhances differentiation of MuSC, whereas knockdown of Nf1 increases the numbers of Pax7 expressing cells. (e) shRNA knockdown identifies 90 and 30 candidate genes causing down- and upregulation of Pax7+/DAPI+ ratios, respectively. P.i., post infection; Pos, positive.
Figure 2
Figure 2. Prmt5 is required for muscle regeneration and long-term maintenance of MuSC.
(a) Schematic outline of CTX injection in TAM-treated control and Prmt5sKO mutant littermates at the age of 8–9 weeks. (b) Haematoxylin and eosin (H&E) and (c) Masson's Trichrome staining of injured or uninjured TA muscles of Prmt5sKO mice and control littermates (n=3, each) 14 days after CTX injection. Scale bar, 20 μm. (d,e) Number of Pax7+ cells 4 months after TAM administration on TA cryosections (n=6, each; d) and freshly isolated FDB myofibres (n=3, each; e) of Prmt5sKO and control mice. The number of Pax7+ cell per 10 mm2 (d) or per 100 fibres (e) was counted. Error bars represent s.d.'s of the mean (t-test: ****P<0.0001, *P<0.05; n=3). Control (Ctrl): Pax7CreERT2+/−/Prmt5+/loxP; Prm5sKO: Pax7CreERT2+/−/Prmt5loxP/loxP.
Figure 3
Figure 3. Continuous muscle regeneration depletes the MuSC pool of Prmt5sKO mice.
(a) Schematic outline of the TAM administration and analysis of wild-type (WT), Prmt5sKO, mdx and Prmt5sKO/mdx mice (n=3, each). (b–d) Prmt5sKO/mdx mice (n=3) show lower body weight (b,c) and thinner diaphragm (d) compared with WT (n=3), mdx (n=3) and Prmt5sKO (n=3) littermates 3 months after TAM administration. Scale bar, 100 μm (d). (e) MRI measurements of decreased and increased muscle volume (brown colour) in Prmt5sKO/mdx and mdx mice, respectively, 3 months after TAM administration (WT and mdx, n=5 each; Prmt5sKO, n=3; Prmt5sKO/mdx, n=4). Quantification of muscle volume normalized to tibia length is shown on the right. Error bars represent s.d.'s of the mean (t-test: ****P<0.0001; ***P<0.001; NS, P>0.05). (f) Decreased numbers of Pax7+ cells in TA muscles of Prmt5sKO/mdx mice (n=5) compared with WT (n=5 and mdx (n=3) littermates. The number of Pax7+ cells per 10 mm2 area was counted on cryosections. Error bars represent s.d.'s of the mean (t-test: **P<0.01; NS, P>0.05). Control (Ctrl): Pax7CreERT2+/−/Prmt5+/loxP; Prm5sKO: Pax7CreERT2+/−/Prmt5loxP/loxP. NS, not significant.
Figure 4
Figure 4. Prmt5 is required for proliferation of MuSC.
(a) Representative immunofluorescence images of cultured MuSC from control and Prmt5sKO mice (n=6, each) after EdU incorporation. Quantification of EdU+ cells is shown on the right. Error bars represent s.d.'s of the mean (t-test: ****P<0.0001). (b) Percentage of EdU+/MuSC relative to all Pax7+ cells after infection with lentiviruses overexpressing Prmt5 (n=6) or GFP (n=8). Error bars represent s.d.'s of the mean (t-test: **P<0.01). (c) Immunofluorescence analyses of Pax7+-colonies on isolated FDB myofibres of control and Prmt5sKO mice after 3-day culture (n=3, each). Scale bar, 50 μm. Total numbers of Pax7+ colonies from 100 myofibres are counted. Quantifications are shown on the right. Error bars represent s.d.'s of the mean (t-test: **P<0.01). (d) Nuclear LacZ (nLacZ) staining for identification of MuSC in normal and regenerating TA muscle sections from Prmt5sKO mice and control littermates 3 days after CTX injection (n=3, each). Scale bar, 20 μm. The numbers of LacZ+ MuSC per 10 mm2 section area are displayed. Error bars represent s.d.'s of the mean (t-test: ****P<0.0001; ***P<0.001; NS, P>0.05; n=3). Control (Ctrl): Pax7CreERT2+/−/Prmt5+/loxP; Prmt5sKO: Pax7CreERT2+/−/Prmt5loxP/loxP. NS, not significant; TL, transmitted light.
Figure 5
Figure 5. Prmt5 is required for differentiation of MuSC.
(a,c) Immunofluorescence analysis of double YFP+/MyoD+ cells (a) and double YFP+ and MyoG+ cells (c) on isolated FDB myofibres of control and Prmt5sKO mice after 3-day culture (n=3, each). Scale bar, 50 μm. Total numbers of Pax7+ colonies from 100 myofibres are counted. Quantifications are shown on the right. Error bars represent s.d.'s of the mean (t-test: **P<0.01, ***P<0.001). (b) Immunofluorescence staining of FACS-purified YFP+ cells cultured for 3 days in proliferation medium for MyoD (n=3, each). Scale bar, 50 μm. The percentage of MyoD+ cells is shown on the right. Error bars represent s.d.'s of the mean (t-test: NS, P>0.05). (d) Immunofluorescence staining for MyoG of FACS-purified YFP+ cells cultured for 3 days in proliferation medium followed by 2 days in differentiation medium (n=4, each). Scale bar, 50 μm. The percentage of MyoG+ cells is shown on the right. Error bars represent s.d.'s of the mean (t-test: ****P<0.0001). (e) Immunofluorescence images of MF20+ myotubes differentiated from FACS-purified YFP+ cells cultured for 3 days in proliferation medium followed by 2 days in differentiation medium (n=3, each). Scale bar, 50 μm. The area of MF20+ cells is shown on the right. Error bars represent s.d.'s of the mean (t-test: ***P<0.001). Control (Ctrl): Pax7CreERT2+/−/Prmt5+/loxP; Prmt5sKO: Pax7CreERT2+/−/Prmt5loxP/loxP.
Figure 6
Figure 6. Prmt5 is required for survival of MuSC upon differentiation.
(a) Western blot analysis of Prmt5 and p53 protein levels in isolated MuSC of Prmt5sKO and control littermates after in vitro 4-OH TAM treatment (n=2). (b,c) Immunofluorescence staining for MyoG (b) and MF20 (c) of control and Prmt5sKO MuSC, which were in vitro amplified and subsequently treated with 4-OH-TAM, 2 days after induction of differentiation. Scale bars, 20 μm. The percentage of MyoG+ and MF20+ cells is shown on the right. Error bars represent s.d.'s of the mean. (t-test: ***P<0.001; NS, P>0.05, n=3). (d) TUNEL assays of FACS-sorted control and Prmt5-deficient MuSC in differentiation medium (n=3, each). Scale bar, 20 μm. Quantifications are shown on the right. Error bars represent s.d.'s of the mean (t-test: **P<0.01; NS, P>0.05). Control (Ctrl): Pax7CreERT2+/−/Prmt5+/loxP; Prm5sKO: Pax7CreERT2+/−/Prmt5loxP/loxP. NS, not significant.
Figure 7
Figure 7. Epigenetic silencing of the cell cycle inhibitor p21 by Prmt5.
(a) RT–qPCR analysis of p21 upregulation in isolated quiescent satellite cells of Prmt5sKO mice (n=4, each). (b) RT–qPCR analysis of Prmt5, p21, cyclinB1 and myogenic factors after Prmt5 inactivation by addition of 4-OH-TAM (n=3, each). Expression levels of different mRNAs were normalized to GAPDH mRNA. Error bars indicate s.d. of the mean (t-test: *P<0.05; **P<0.01; NS, P>0.05). (c) Schematic outline of the localization of four important regulatory regions in the p21 gene locus: enhancer-like (En), p53 binding site (p53BS), transcriptional start site (TSS) and intronic CpG island (CpG). Primer pairs used for ChIP assays are indicated by arrows. The p53 consensus motif of the murine and human p21 gene locus is shown. (d–h) Quantitative PCR analyses of ChIP using antibodies against Prmt5 (d), H3R8me2s (e), histone H3 (f), H3K4me3 (g) and p53 (h) at indicated regulatory regions of the p21 gene locus in MuSC of Prmt5sKO and control mice (n=3, each). Relative (Rel.) enrichment of Prmt5, H3 and p53 was normalized to input DNA. Enrichment of H3R8me2 and H3K4me3 was normalized to histone H3. Error bars represent s.d.'s of the mean (t-test: **P<0.01; *P<0.05; NS, P>0.1). (i) RT–qPCR analysis of p53 mRNA levels in MuSC of Prmt5sKO mice and control littermates (n=3, each). Error bars represent s.d.'s of the mean (t-test: NS, P>0.05). (j) Semi-quantitative RT–PCR analysis of different Mdm4 splicing isoforms in MuSC of Prmt5sKO mice and control littermates. RT–PCR using primers in the 3′untranslated region of Mdm4 detecting both Mdm4fl and Mdm4s was used as loading control. RT–PCR-mediated detection of m36B4 served as an additional loading control. Control (Ctrl): Pax7CreERT2+/−/Prmt5+/loxP; Prm5sKO: Pax7CreERT2+/−/Prmt5loxP/loxP. NS, not significant; WT, wild type.
Figure 8
Figure 8. Prmt5 regulates proliferation of MuSC via inhibition of p21 expression.
(a) EdU incorporation in isolated MuSCs reveals a partial rescue of MuSC proliferation in Prmt5sKO/p21−/− compared with Prmt5sKO mice (n=3, each). Error bars represent s.d.'s of the mean (t-test: ****P<0.0001; **P <0.01; NS, P>0.05). (b) Increased numbers of Pax7+ colonies on Prmt5sKO/p21−/− compared with Prmt5sKO 3-day cultured myofibres (n=4, each). Numbers of Pax7+ colonies from 100 myofibres are shown. Error bars represent s.d.'s of the mean (t-test: **P<0.01; *P<0.1; NS, P>0.05). (c) Representative macroscopic images of non-injured and injured TA muscles of control, p21−/−, Prmt5sKO and Prmt5sKO/p21−/− mice (n=3, each) 14 days after CTX injection. Scale bar, 1 cm. (d) Haematoxylin and eosin (H&E) staining of muscle section from non-injured (upper panel) and injured TA (CTX lower panel) muscles of control, p21−/−, Prmt5sKO and Prmt5sKO/p21−/− mice (n=3, each) 14 days after CTX injection. Control (Ctrl): Pax7CreERT2+/−/Prmt5+/loxP; Prm5sKO: Pax7CreERT2+/−/Prmt5loxP/loxP. Scale bar, 50 μm.
Figure 9
Figure 9. Prmt5 is dispensable in embryonic Pax7+ muscle progenitor cells.
(a) Representative images of control and Prmt5mKO embryos at embryonic day E12.5, E14.5 and E16.5. (n=3, each). Scale bar, 10 mm. (b,c) Immunofluorescence images of cryosectioned forelimbs and hindlimbs. (b) E12.5 frontal sections: upper panel; E14.5 sagittal sections: lower panel, Pax7 (green), myogenin (red), DAPI (blue). Scale bar, 50 μm. (c) E12.5 frontal sections: upper panel; E14.5 sagittal sections: lower panel, MF20 (green), DAPI (blue). Scale bar, 50 μm. (d,e) Immunofluorescence of cryosections from hindlimbs. E16.5 transverse sections: upper panel and forelimbs. E16.5 frontal sections: lower panel, Pax7 (green), myogenin (red; d), and Pax7 (green) and MyoD (red; e). DNA is stained by DAPI (blue). Scale bars, 50 μm. Scale bars in inserts 20 μm. Control (Ctrl): Pax7CreERT2+/−/Prmt5+/loxP; Prm5sKO: Pax7CreERT2+/−/Prmt5loxP/loxP.
Figure 10
Figure 10. Model of the role of Prmt5 during fetal myogenesis and adult muscle regeneration.
Prmt5 controls proliferation of adult MuSC by direct epigenetic silencing of the cell cycle inhibitor p21 independent of p53, but is dispensable for proliferation and differentiation of Pax7+ muscle progenitor cells during fetal myogenesis. Prmt5 does not affect the initial activation of MuSC resulting in MyoD expression but enables proliferation of MuSC, thus generating a poised state, which keeps MuSC in a standby mode allowing rapid MuSC amplification under disease conditions. Inactivation of Prmt5 in proliferating MuSC does not suppress MyoG expression but blocks differentiation, thereby suggesting an additional function of Prmt5 for muscle cell differentiation. Proliferating fetal muscle progenitor cells are defined by expression of Pax7 and MyoD, quiescent MuSC by expression of Pax7 and lack of MyoD expression, proliferating MuSC by the concomitant expression of Pax7 and MyoD, and differentiating muscle cells by expression of MyoG. Differentiated muscle cells are marked by expression of myosin heavy chain (MyHC).

Similar articles

Cited by

References

    1. Wilson A. et al. Hematopoietic stem cells reversibly switch from dormancy to self-renewal during homeostasis and repair. Cell 135, 1118–1129 (2008). - PubMed
    1. Brack A. S. & Rando T. A. Tissue-specific stem cells: lessons from the skeletal muscle satellite cell. Cell Stem Cell 10, 504–514 (2012). - PMC - PubMed
    1. Schienda J. et al. Somitic origin of limb muscle satellite and side population cells. Proc. Natl Acad. Sci. USA 103, 945–950 (2006). - PMC - PubMed
    1. Seale P. et al. Pax7 is required for the specification of myogenic satellite cells. Cell 102, 777–786 (2000). - PubMed
    1. Relaix F., Rocancourt D., Mansouri A. & Buckingham M. A Pax3/Pax7-dependent population of skeletal muscle progenitor cells. Nature 435, 948–953 (2005). - PubMed

Publication types

MeSH terms