. 2015 Dec;22(12):1946-56.
doi: 10.1038/cdd.2015.59. Epub 2015 May 29.

Identification of synthetic lethality of PLK1 inhibition and microtubule-destabilizing drugs

Affiliations

Identification of synthetic lethality of PLK1 inhibition and microtubule-destabilizing drugs

M Hugle et al. Cell Death Differ. 2015 Dec.

Abstract

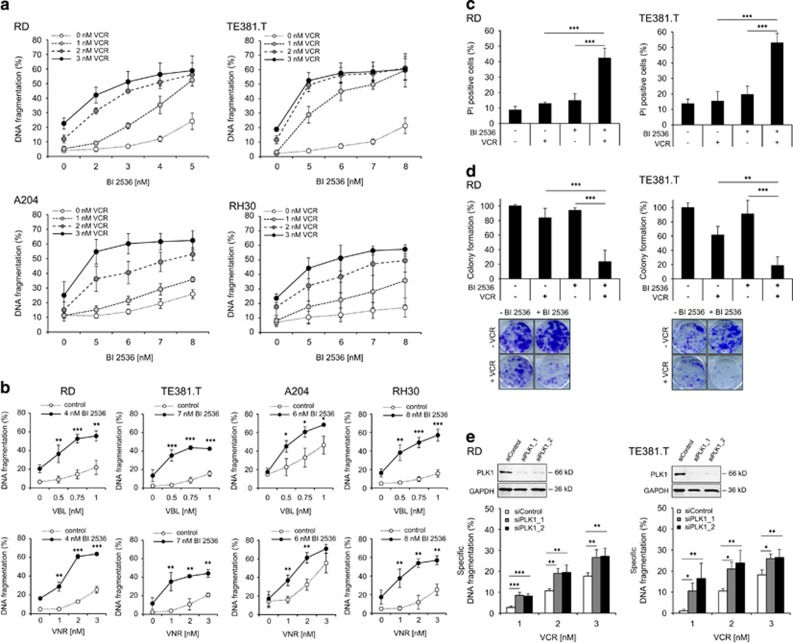
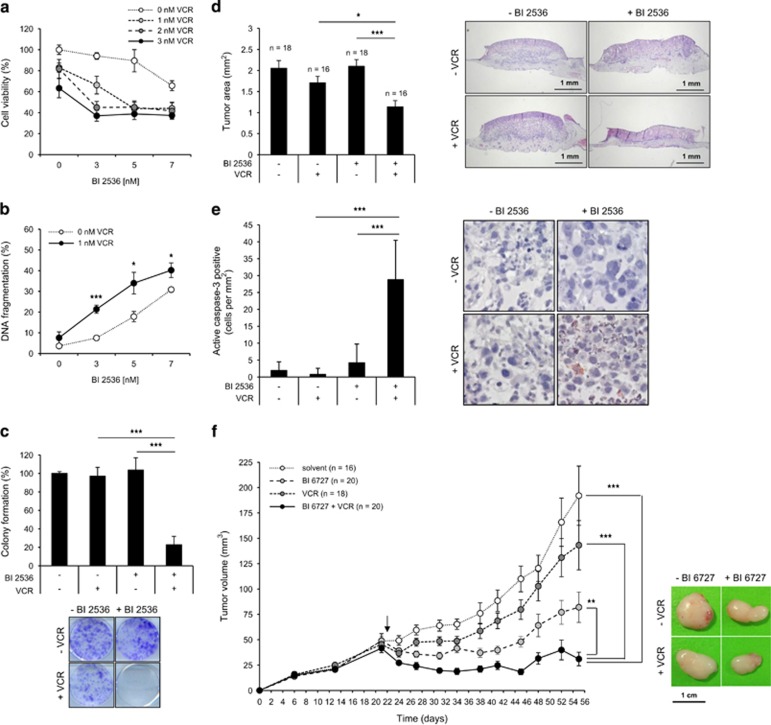
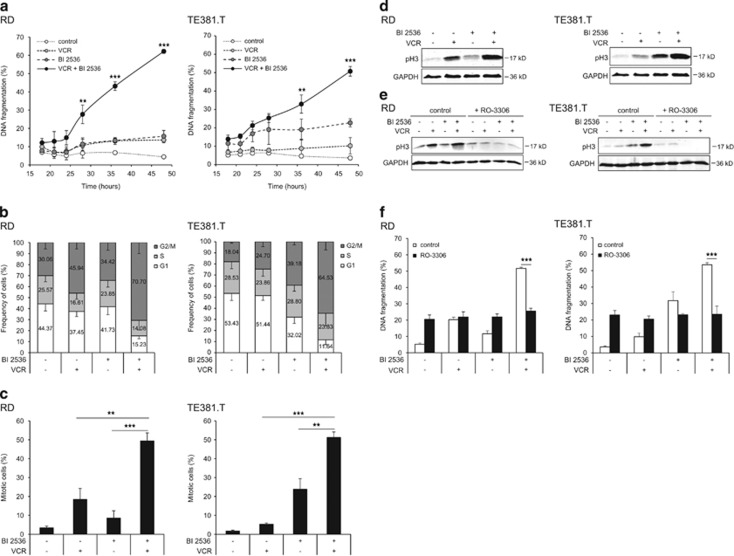
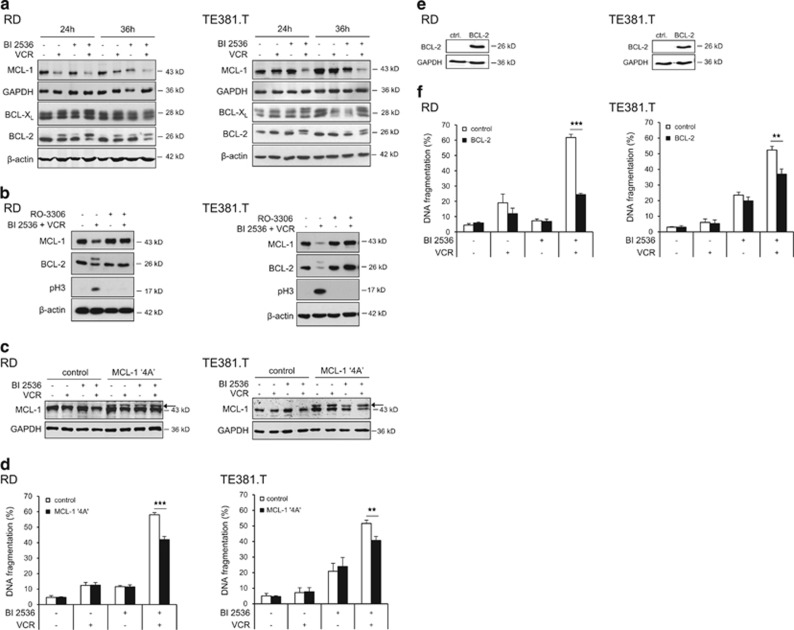
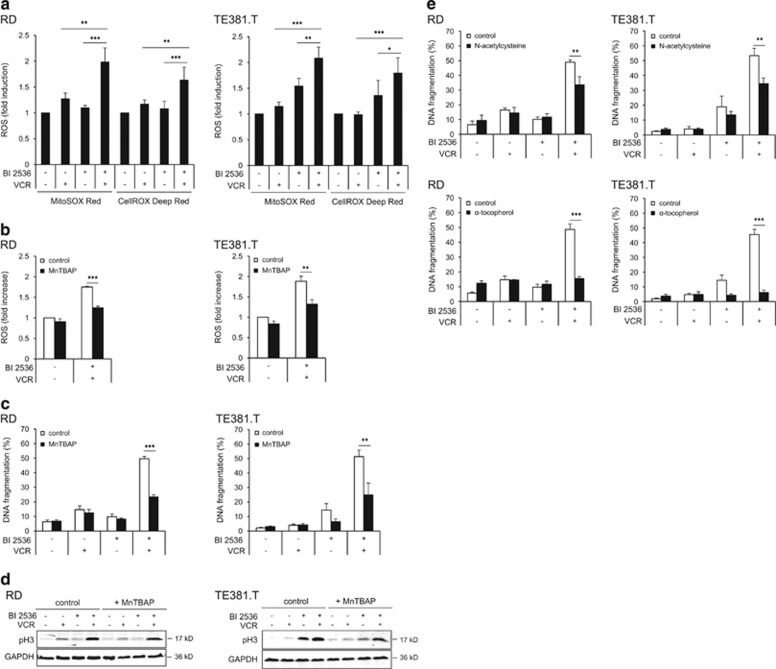
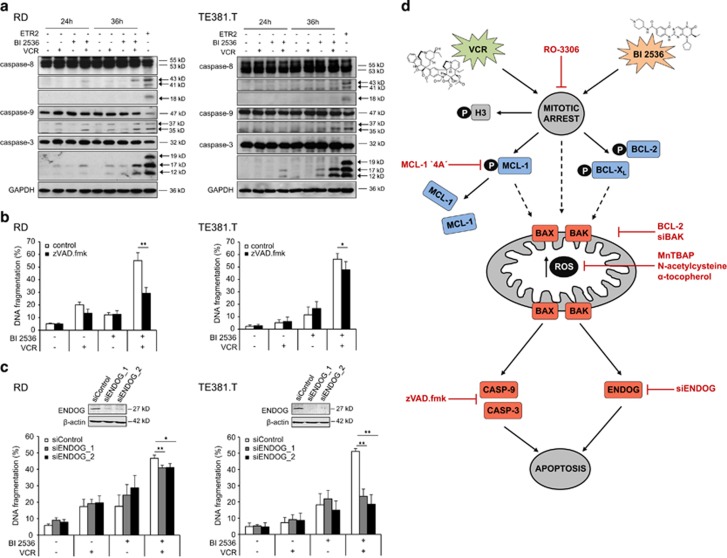
Polo-like kinase 1 (PLK1) is frequently overexpressed in cancer, which correlates with poor prognosis. Therefore, we investigated PLK1 as therapeutic target using rhabdomyosarcoma (RMS) as a model. Here, we identify a novel synthetic lethal interaction of PLK1 inhibitors and microtubule-destabilizing drugs in preclinical RMS models and elucidate the underlying molecular mechanisms of this synergism. PLK1 inhibitors (i.e., BI 2536 and BI 6727) synergistically induce apoptosis together with microtubule-destabilizing drugs (i.e., vincristine (VCR), vinblastine (VBL) and vinorelbine (VNR)) in several RMS cell lines (combination index <0.9) including a patient-derived primary RMS culture. Importantly, PLK1 inhibitors and VCR cooperate to significantly suppress RMS growth in two in vivo models, including a mouse xenograft model, without causing additive toxicity. In addition, no toxicity was observed in non-malignant fibroblast or myoblast cultures. Mechanistically, BI 2536/VCR co-treatment triggers mitotic arrest, which initiates mitochondrial apoptosis by inactivation of antiapoptotic BCL-2 family proteins, followed by BAX/BAK activation, production of reactive oxygen species (ROS) and activation of caspase-dependent or caspase-independent effector pathways. This conclusion is supported by data showing that BI 2536/VCR-induced apoptosis is significantly inhibited by preventing cells to enter mitosis, by overexpression of BCL-2 or a non-degradable MCL-1 mutant, by BAK knockdown, ROS scavengers, caspase inhibition or endonuclease G silencing. This identification of a novel synthetic lethality of PLK1 inhibitors and microtubule-destabilizing drugs has important implications for developing PLK1 inhibitor-based combination treatments.


Figures

Figure 1
Figure 1
PLK1 inhibition synergizes with microtubule-destabilizing drugs to induce apoptosis in RMS cells. (a and b) RMS cell lines RD, TE381.T, A204 and RH30 were treated with indicated concentrations of PLK1 inhibitor BI 2536 and/or VCR (a), VBL or VNR (b), respectively. Apoptosis was determined at 48 h by quantification of DNA fragmentation (n=3). Results are expressed as mean±S.D. (error bars). (c) RD cells were treated with 4 nM BI 2536 and/or 2 nM VCR, TE381.T cells with 7 nM BI 2536 and/or 1 nM VCR for 48 h. Cytotoxicity was assessed by plasma membrane permeability using PI staining (n=4). (d) RD cells were treated with 2 nM BI 2536 and 1 nM VCR, TE381.T cells with 3 nM BI 2536 and 1 nM VCR for 24 h. Long-term cytotoxicity was assessed by colony formation assay at day 10 (n=3). The number of colonies is expressed as percentage of untreated controls (upper panel) and representative images are shown (lower panel). (e) RD and TE381.T cells were transiently transfected with siRNA against PLK1 or non-silencing siRNA (siControl). Knockdown of PLK1 was confirmed by western blotting. GAPDH served as loading control. Apoptosis was analyzed by quantification of DNA fragmentation at 48 h (n=3). Results are expressed as mean+S.D. (error bars). Student's t-test was used to calculate two-sided P-values. *P<0.05; **P<0.01; ***P<0.001 (c, d and e)
Figure 2
Figure 2
PLK1 inhibitors and VCR cooperate to suppress tumor growth in vivo and in a patient-derived primary RMS culture. (ac) Patient-derived RMS cells were cultivated to investigate BI 2536/VCR cytotoxicity. Primary cells were treated with indicated concentrations of BI 2536 and/or VCR and cell viability (a) and DNA fragmentation (b) were determined at 48 h (n=3). (c) Long-term cytotoxicity was assessed upon treatment with 3 nM BI 2536 and/or 1 nM VCR by colony formation assay (n=3). The number of colonies as percentage of untreated controls and representative images are shown. Results are expressed as mean±S.D. (error bars). Student's t-test was used to calculate two-sided P-values. *P<0.05; **P<0.01; ***P<0.001. (d and e) RD tumor xenografts on the CAM of fertilized chicken eggs were treated with 8 nM BI 2536 and/or 3 nM VCR or solvent for three consecutive days. Tumors were dissected with surrounding CAM and tumor area was analyzed in HE-stained sections (n=18 for solvent controls and BI 2536; n=16 for VCR and BI 2536+VCR) (d). In addition, tumor sections were stained for active caspase-3 by immunohistochemistry (IHC) and caspase-3-positive cells per mm2 were assessed (e, magnification x40). Results are expressed as mean+S.E.M. (error bars) and representative images of HE- or IHC-stained sections are shown. Student's t-test was used to calculate two-sided P-values. *P<0.05; **P<0.01; ***P<0.001. (f) RD cells were engrafted subcutaneously into nude mice and allowed to initiate tumors. Treatment was started at day 22 (indicated by arrow) by intravenous injection of 5 mg/kg BI 6727 and/or 0.1 mg/kg VCR or solvent once weekly for 5 weeks (n=16 for solvent; n=18 for VCR and BI 6727; n=20 for BI 6727+VCR). Tumor volumes were determined and results are expressed as mean+S.E.M. (error bars). Representative images of dissected tumors on the last day of the experiment are shown. Wilcoxon–Mann–Whitney U-test was used to calculate two-sided P-values. *P<0.05; **P<0.01; ***P<0.001
Figure 3
Figure 3
BI 2536/VCR-induced mitotic arrest is required for apoptosis. RD cells were treated with 4 nM BI 2536 and/or 2 nM VCR, TE381.T cells with 7 nM BI 2536 and/or 1 nM VCR. (a) Apoptosis was determined at indicated time points by quantification of DNA fragmentation (n=3). (b) Frequency of cells per cell cycle phase was analyzed at 18 h in PI-stained nuclei using FlowJo software (TreeStar Inc.) (n=5). (c) Mitotic cells were quantified at 18 h by expression of mitotic marker pH3 using immunofluorescence (n=3). (d) pH3 expression was confirmed by western blotting at 18 h (n=3). GAPDH served as loading control and representative blots are shown. (e and f) RD and TE381.T cells were pretreated for one hour with 10 μM of CDK1 inhibitor RO-3306. pH3 expression at 24 h was confirmed by western blotting (n=3). GAPDH served as loading control and representative blots are shown (e). Apoptosis was determined at 48 h by quantification of DNA fragmentation (n=4). Results are expressed as mean±S.D. (error bars) (f). Student's t-test was used to calculate two-sided P-values. **P<0.01; ***P<0.001
Figure 4
Figure 4
Modulation of antiapoptotic BCL-2 proteins by BI 2536/VCR co-treatment. RD cells were treated with 4 nM BI 2536 and/or 2 nM VCR, TE381.T cells with 7 nM BI 2536 and/or 1 nM VCR for indicated time periods. (a) Protein expression of MCL-1, BCL-2 and BCL-XL was determined at 24 and 36 h by western blotting (n=3). β-Actin or GAPDH served as loading controls. (b) RD and TE381.T cells were pretreated for 1 h with 10 μM of CDK1 inhibitor RO-3306. Expression of the antiapoptotic BCL-2 family proteins MCL-1 and BCL-2 and mitotic marker pH3 was analyzed by western blotting (n=3). β-Actin served as loading control. (c and d) Cells were genetically engineered to stably express a non-degradable phospho-defective mutant of MCL-1 (MCL-1 ‘4A'). Expression of MCL-1 ‘4A' (indicated by arrow) in transfected RD and TE381.T cells was confirmed by western blotting at 24 h upon treatment with BI 2536 and/or VCR (n=2). GAPDH served as loading control (c). Apoptosis was analyzed by quantification of DNA fragmentation at 48 h (n=3) (e). (e and f) Cells were genetically engineered to stably express high levels of murine BCL-2. Overexpression of murine BCL-2 in transduced RD and TE381.T cells was confirmed by western blotting using an antibody that specifically detects murine BCL-2 (n=3). GAPDH served as loading control (e). Apoptosis was analyzed by quantification of DNA fragmentation at 48 h (n=3) (f). Cells transfected with corresponding empty vectors served as controls. Results are expressed as mean+S.D. (error bars) or representative blots are shown. Student's t-test was used to calculate two-sided P-values. **P<0.01; ***P<0.001
Figure 5
Figure 5
BAX/BAK activation by BI 2536/VCR co-treatment. RD cells were treated with 4 nM BI 2536 and/or 2 nM VCR, TE381.T cells with 7 nM BI 2536 and/or 1 nM VCR. (a) Activation of proapoptotic BAX and BAK was assessed at 28 h by immunoprecipitation with active confirmation-specific antibodies (n=3). β-Actin and total BAX or BAK levels served as loading controls. (b) Detection of active BAX and BAK was performed as in (b), but in cells stably expressing high levels of murine BCL-2 (BCL-2) and transfected with corresponding empty vectors (controls) (n=2). (c) RD and TE381.T cells were transiently transfected with siRNA against BAK or non-silencing siRNA (siControl). Knockdown of BAK was confirmed by western blotting. β-Actin served as loading control. Apoptosis was analyzed by quantification of DNA fragmentation at 48 h (n=3). Results are expressed as mean+S.D. (error bars) or representative blots are shown. Student's t-test was used to calculate two-sided P-values. **P<0.01; ***P<0.001
Figure 6
Figure 6
ROS-dependent apoptosis by BI 2536/VCR co-treatment. (a) Production of ROS was determined by flow cytometry analysis of RD and TE381.T cells stained with either MitoSOX Red or CellROX Deep Red reagent at 24 h (n=4). ROS levels were normalized to controls and are expressed as fold induction+S.D. (error bars). (b, c and d) RD and TE381.T cells were pretreated for 1 h with 0.1 mM of superoxide scavenger MnTBAP. ROS production was determined using MitoSOX Red reagent for BI 2536/VCR co-treated cells at 24 h (n=3). ROS levels were normalized to controls and are expressed as fold induction+S.D. (error bars) (b). Apoptosis was determined at 48 h by quantification of DNA fragmentation (n=3) (c). Mitotic marker pH3 was analyzed by western blotting (n=3). GAPDH served as loading control (d). (e) RD and TE381.T cells were pretreated for 18 h with 5 mM of antioxidant N-acetylcysteine or for 1 h with 0.3 mM of antioxidant α-tocopherol. Apoptosis was determined at 48 h by quantification of DNA fragmentation (n=3). Results are expressed as mean+S.D. (error bars) or representative blots are shown. Student's t-test was used to calculate two-sided P-values. *P<0.05; **P<0.01; ***P<0.001
Figure 7
Figure 7
BI 2536/VCR-induced apoptosis is executed via both caspase-dependent and -independent effector pathways. RD cells were treated with 4 nM BI 2536 and/or 2 nM VCR, TE381.T cells with 7 nM BI 2536 and/or 1 nM VCR for indicated time periods. (a) Caspase activation at 24 and 36 h was monitored by detection of active cleavage fragments (indicated by arrows) of caspase-8, -9 and -3 by western blotting (n=3). GAPDH served as loading control and TRAIL receptor-2 agonistic antibody ETR2 as positive control for caspase cleavage. (b) RD and TE381.T cells were pretreated for one hour with 50 μM of broad-range caspase inhibitor zVAD.fmk. Apoptosis was determined at 48 h by quantification of DNA fragmentation (n=6). (c) RD and TE381.T cells were transiently transfected with siRNA against ENDOG or non-silencing siRNA (siControl). Knockdown of ENDOG was confirmed by western blotting (n=2). β-Actin served as loading control. Apoptosis was analyzed by quantification of DNA fragmentation at 48 h (n=3). Results are expressed as the mean+S.D. (error bars) or representative blots are shown. Student's t-test was used to calculate two-sided P-values. *P<0.05; **P<0.01. (d) Proposed mechanism of synergy between PLK1 inhibitors (BI 2536) and microtubule-destabilizing drugs such as VCR in inducing apoptosis. Black arrows indicate activating or phosphorylating (P) events, red lines indicate pharmacological or genetic intervention. pH3 (marker of mitosis); BCL-2/BCL-XL/MCL-1, antiapoptotic BCL-2 family proteins (blue); BAX/BAK, proapoptotic BCL-2 family proteins (red). Mitotic arrest initiates degradation of MCL-1 and phosphorylation of BCL-2 and BCL-XL, leading to activation of BAX and BAK. In addition, ROS accumulate during prolonged mitotic arrest and enhance mitochondrial perturbations. This results in mitochondrial outer membrane permeabilization and activation of either the caspase cascade (casp-3/casp-9) or the caspase-independent nuclease ENDOG for apoptosis execution

Similar articles

Cited by

References

    1. Fulda S, Debatin KM. Extrinsic versus intrinsic apoptosis pathways in anticancer chemotherapy. Oncogene 2006; 25: 4798–4811. - PubMed
    1. Fulda S, Galluzzi L, Kroemer G. Targeting mitochondria for cancer therapy. Nat Rev Drug Discov 2010; 9: 447–464. - PubMed
    1. Lowe SW, Cepero E, Evan G. Intrinsic tumour suppression. Nature 2004; 432: 307–315. - PubMed
    1. Bartek J, Bartkova J, Lukas J. DNA damage signalling guards against activated oncogenes and tumour progression. Oncogene 2007; 26: 7773–7779. - PubMed
    1. Strebhardt K. Multifaceted polo-like kinases: drug targets and antitargets for cancer therapy. Nat Rev Drug Discov 2010; 9: 643–660. - PubMed

Publication types

MeSH terms