. 2015 Jun 4;161(6):1345-60.
doi: 10.1016/j.cell.2015.04.048. Epub 2015 May 21.

RUNX3 Controls a Metastatic Switch in Pancreatic Ductal Adenocarcinoma

Affiliations

RUNX3 Controls a Metastatic Switch in Pancreatic Ductal Adenocarcinoma

Martin C Whittle et al. Cell. .

Abstract

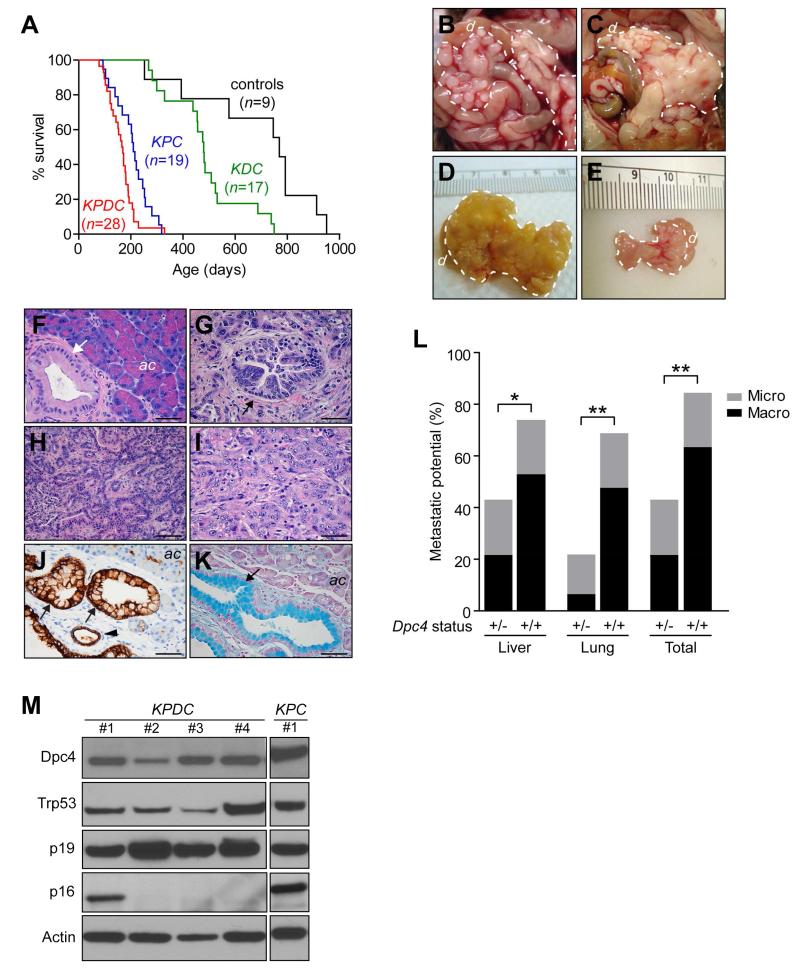
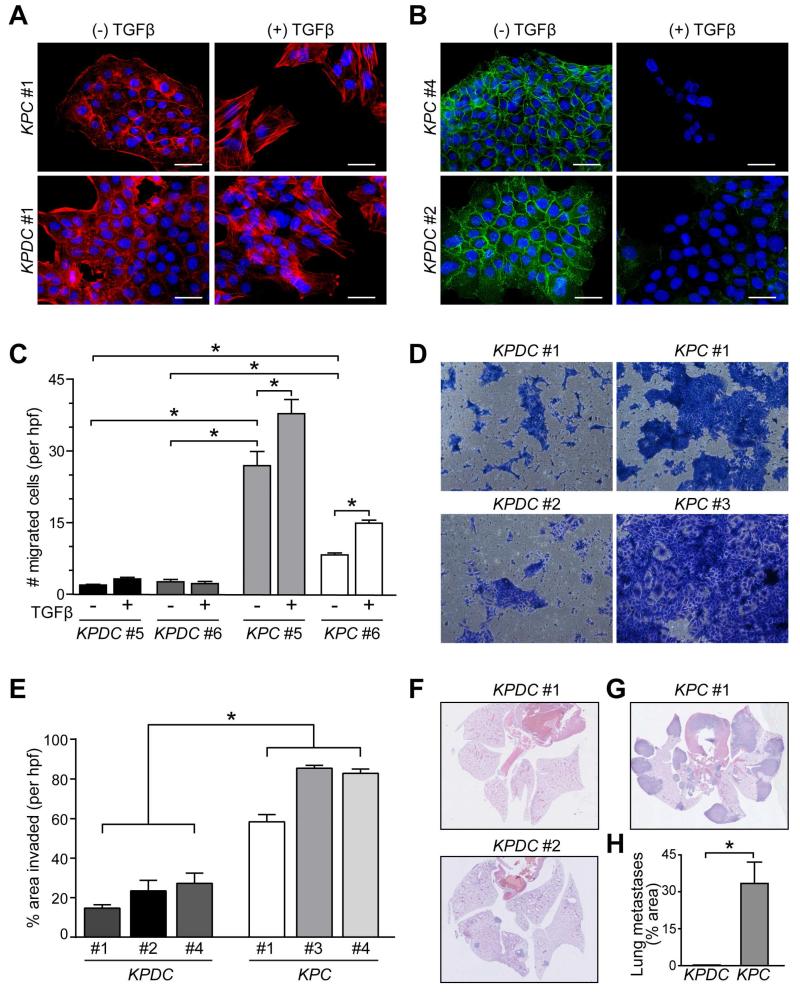
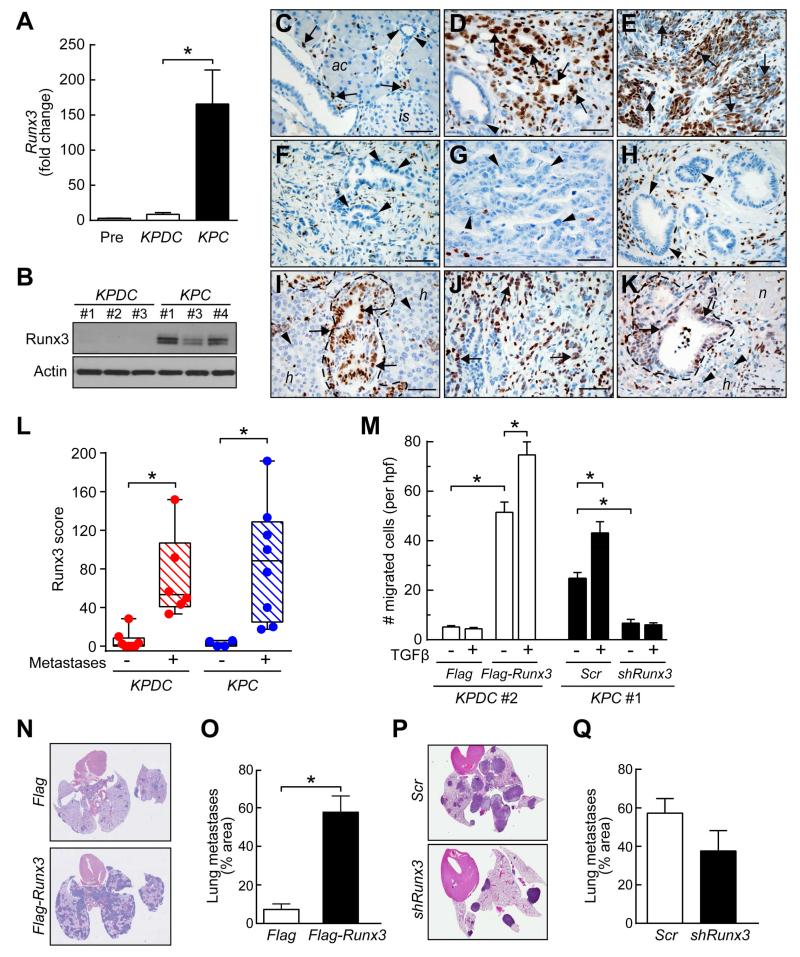
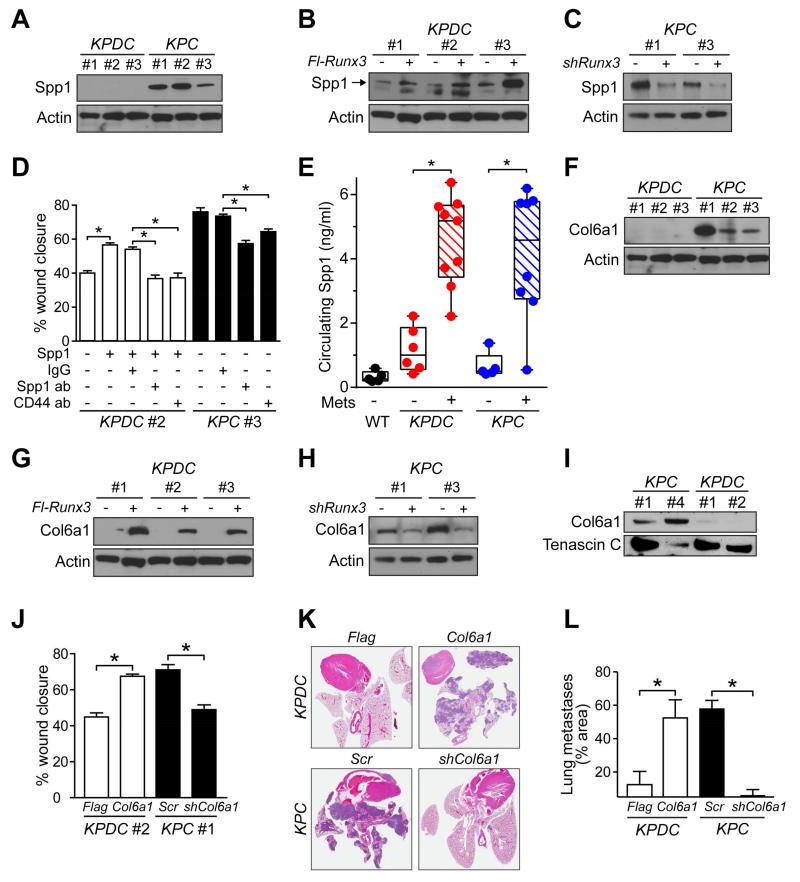
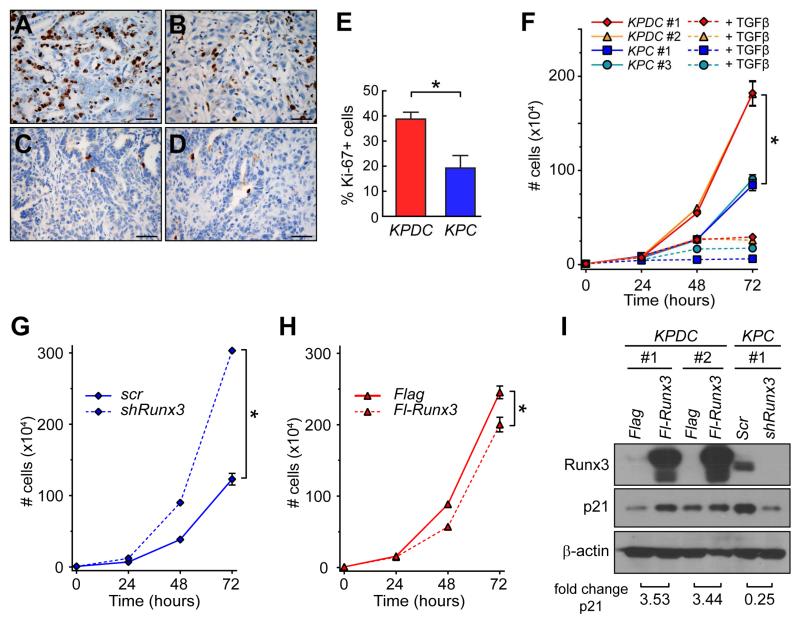
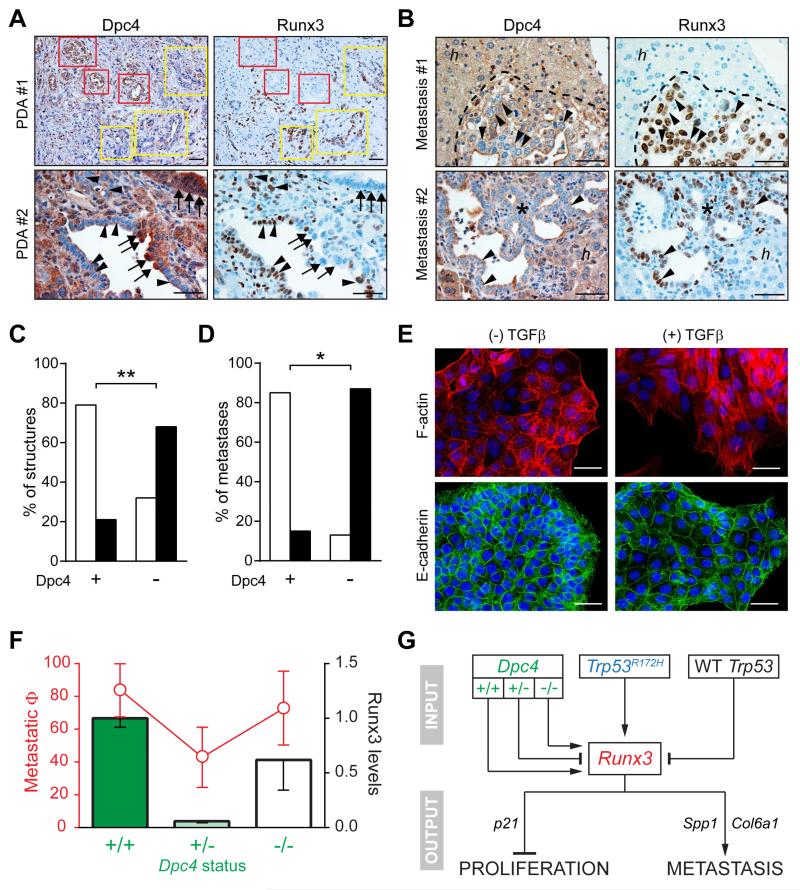
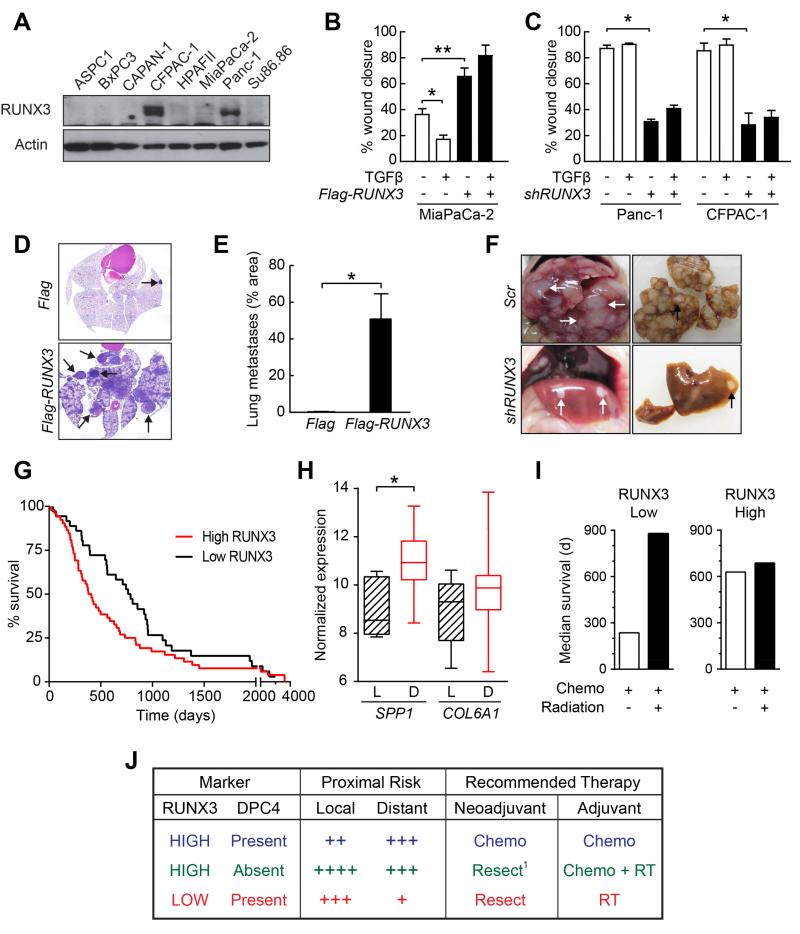
For the majority of patients with pancreas cancer, the high metastatic proclivity is life limiting. Some patients, however, present with and succumb to locally destructive disease. A molecular understanding of these distinct disease manifestations can critically inform patient management. Using genetically engineered mouse models, we show that heterozygous mutation of Dpc4/Smad4 attenuates the metastatic potential of Kras(G12D/+);Trp53(R172H/+) pancreatic ductal adenocarcinomas while increasing their proliferation. Subsequent loss of heterozygosity of Dpc4 restores metastatic competency while further unleashing proliferation, creating a highly lethal combination. Expression levels of Runx3 respond to and combine with Dpc4 status to coordinately regulate the balance between cancer cell division and dissemination. Thus, Runx3 serves as both a tumor suppressor and promoter in slowing proliferation while orchestrating a metastatic program to stimulate cell migration, invasion, and secretion of proteins that favor distant colonization. These findings suggest a model to anticipate likely disease behaviors in patients and tailor treatment strategies accordingly.


Figures

Figure 1
Figure 1. Molecular characterization of tumor progression in KPDC mice
(A) Kaplan-Meier survival of KPDC animals (167 days) was significantly less than control animals (769 days, p<0.001), KrasLSL-G12D/+;Dpc4flox/+;p48Cre/+ (KDC) mice (479 days, p<0.001) and KPC mice (209 days, p<0.05) (log rank test for each pairwise combination). (B and C) Gross pathology of KPDC pancreata at necropsy. Dashed lines, tumor. (D) Representative KPDC tumor. (E) Representative KPC tumor. (F) Pancreas histology in young KPDC animal (age = 109 days). Arrow, PanIN-1A. (G) Pancreas histology in older KPDC animal (age = 165 days). Arrow, PanIN-3. (H) Moderately well-differentiated KPDC PDA. (I) Poorly differentiated KPDC PDA. (J) CK-19 immunoreactivity highlights KPDC ductal epithelium. Arrows, PanIN-1A; arrowhead, normal duct. (K) Alcian blue histochemistry (arrow) reveals mucin content in preinvasive KPDC lesion. (L) Metastatic potential (% with metastases) in KPDC (+/−) and KPC (+/+) animals (*p<0.05, **p<0.01). (+/+) and (+/−) indicate WT and heterozygous deleted Dpc4, respectively. (M) Immunoblots of representative KPDC and KPC primary PDA cell lysates from independent animals. d, duodenum; ac, acinar cells. Scale bars, 50 μm. See also Table S1 and Figure S1.
Figure 2
Figure 2. Dpc4 status affects morphologic and cellular behaviors associated with metastasis
(A and B) Immunofluorescence of actin stress fibers (A) and surface E-cadherin (B) in representative KPC and KPDC PDA cells ±TGFβ. Nuclei are counterstained with DAPI (blue). Scale bars, 50 μm. (C) Cell migration of representative KPC and KPDC primary PDA cells from 3 independent experiments (mean ± SEM; *p<0.0001). (D and E) Representative images (D) and quantification (E) of KPDC and KPC cells after invasion through Matrigel (n=6 wells per cell line, *p<0.005). (F-H) Representative images (F and G) and quantification (H) of pulmonary metastases after i.v. inoculation. Two different levels from three injected animals each were assessed (mean ± SEM; *p<0.05). See also Figure S2.
Figure 3
Figure 3. Runx3 promotes metastasis in murine PDA
(A) Runx3 qRT-PCR in KC preinvasive (Pre) and KPDC and KPC invasive PDA cells (n=4-5 each; mean ± SEM; *p=0.05). (B) Runx3 immunoblots in representative KPDC and KPC PDA cells. Actin, loading control. (C) Runx3 expression in normal pancreas. Arrows, lymphocytes; arrowheads, duct; ac, acini; is, islet. (D) Runx3 expression in undifferentiated region of invasive KPC PDA (arrows). Arrowhead, PanIN-1A. (E) Runx3 expression in sarcomatoid region of invasive KPC PDA (arrows). (F and G) Absence of Runx3 in carcinoma cells of two different KPDC PDA (arrowheads). (H) PanIN in KPC animals lack Runx3 expression (arrowheads). (I) Runx3 expression (arrows) in KPC liver metastases (outline) from primary PDA in panel (E); adjacent hepatocytes (h) lack Runx3 (arrowheads). (J) Runx3 expression (arrows) in region of primary PDA from KPDC animal that developed metastases. (K) Runx3 expression (arrows) in KPDC liver metastasis from primary PDA in (J) and lack of Runx3 (arrowheads) in adjacent hepatocytes (h). n, area of necrosis. (L) Runx3 expression in KPDC and KPC primary tumors. Each point represents mean of three hpf from an independent animal (*p<0.05). (M) Cell migration ±TGFβ in representative KPDC cells with (Flag-Runx3) or without (Flag) Runx3 overexpression, and in,KPC cells with (shRunx3) or without (Scr) Runx3 depletion. Data represent three independent experiments (mean ± SEM; *p<0.01). (N and O) Representative lung sections (N) and quantification (O) of pulmonary metastases in mice injected with control (Flag) or Runx3-overexpressing (Flag-Runx3) KPDC#1 cells. Two different histological levels from a total of three injected animals for each condition were assessed (mean ± SEM; *p<0.005). (P and Q) Representative lung sections (P) and quantification (Q) of pulmonary metastases in mice injected with control (Scr) or Runx3-depleted (shRunx3) KPC#1 cells. Two different histological levels from a total of three injected animals each were assessed (mean ± SEM; p=0.21). Scale bars, 50 μm. See also Figure S3.
Figure 4
Figure 4. Runx3 stimulates expression of pro-metastatic ECM components
(A) Immunoblots for Spp1 in KPDC and KPC primary PDA cells. (B) Immunoblots for Spp1 in control (−) and Runx3-overexpressing (+) KPDC cells. (C) Immunoblots for Spp1 in control (−) and Runx3-knockdown (+) KPC cells. (D) KPDC and KPC primary carcinoma cell migration under the indicated conditions, representative of 3 independent experiments (mean ± SEM; *p<0.001). (E) Circulating Spp1 in KPC and KPDC animals with (+) or without (−) metastatic disease. Points represents the mean of duplicate measurements from mice (*p<0.005). (F) Immunoblots for Col6a1 in independent KPDC and KPC primary PDA cell preparations. (Loading control was the same as in (A)). (G) Immunoblots for Col6a1 in control (Flag) and Runx3-overexpressing (Flag-Runx3) KPDC cells. (Loading control was the same as in (B)). (H) Immunoblots for Col6a1 in control (−, Scr) and Runx3-depleted (+, shRunx3) KPC cells. (Loading control was the same as in (C)). (I) Col6a1 immunoblots of conditioned media from KPC and KPDC cell lines. Tenascin C, loading control. (J) KPDC and KPC primary carcinoma cell migration +/− Col6a1 overexpression (Col6a1) or depletion (shCol6a1), respectively. Mean ± SEM of 3 independent experiments (*p<0.0001). (K) Representative lung sections from mice injected i.v. with either depleted or overexpressed Col6a1 in KPC and KPDC cells, respectively (n=2 cell lines and 3 animals for each condition). (L) Quantification of metastatic pulmonary tumor burden from assays in (K). Two different histological levels from a total of three injected animals were assessed (mean ± SEM; *p<0.05). See also Figure S4.
Figure 5
Figure 5. Runx3 inhibits proliferation in invasive PDA cells
(A and B) Ki-67 expression in autochthonous (A) KPDC and (B) KPC PDA. (C and D) Cleaved caspase 3 in autochthonous (C) KPDC and (D) KPC PDA. (E) Proliferation in autochthonous KPDC and KPC tumors (mean ± SEM, *p<0.05). (F) Proliferation of purified PDA cells ±TGFβ in vitro (n=3, mean ± SEM; *p<0.001). (G) Proliferation of control (Scr) and Runx3-knockdown (shRunx3) purified primary KPC cells in vitro (n=3, mean ± SEM; *p<0.001). (H) Proliferation of control (Flag) and Runx3-overexpressing (Fl-Runx3) purified KPDC cells in vitro (n=3, mean ± SEM; *p<0.001). (I) Immunoblots for p21 in control and Runx3-overexpressing KPDC cells and control and Runx3-depleted KPC cells. Fold changes were quantified by densitometry and normalized to actin. Scale bars, 50 μm.
Figure 6
Figure 6. Dpc4 and Runx3 coordinately regulate metastatic behavior in PDA
(A) Spontaneous focal loss of Dpc4 (left) in representative autochthonous KPDC PDA correlates with acquired Runx3 expression (right). Yellow boxes and arrowheads indicate areas of focal Dpc4 loss and acquired Runx3 expression in tumor epithelia; red boxes and arrows indicate regions of Dpc4 retention and undetectable Runx3. (B) Liver metastases (asterisks and dotted outlines) from KPDC mice reveal spontaneous loss of Dpc4 and corresponding increases in Runx3 expression (arrowheads). Note that hepatocytes (h) retain Dpc4 and do not express Runx3. (C and D) Quantification of Dpc4 and Runx3 IHC in (C) glandular structures in primary KPDC tumors and (D) liver metastases from KPDC mice. Runx3-low structures/metastases are represented by open bars and Runx3-high by black bars. Fisher’s exact test revealed a significant correlation between Dpc4 loss and Runx3 expression (**p<0.0005, *p<0.005). (E) Immunofluorescence of actin stress fibers (upper panels) and surface E-cadherin (lower panels) in KPDDC cells ±TGFβ. Nuclei are counterstained with DAPI (blue). (F) Metastatic potential (Φ) plotted as fraction of mice exhibiting metastases (red, ± 95% confidence interval) and relative Runx3 protein levels (black outlined bars; mean ± SEM) as a function of Dpc4 status (green). (G) Model for the regulation and role of Runx3 in proliferation and metastasis of PDA. Runx3 levels are influenced by Dpc4 status in a biphasic manner and increase only after LOH of Trp53 in the context of point-mutant Trp53. Runx3 expression in turn stimulates synthesis and secretion of proteins that promote migration and metastatic niche preparation, while simultaneously inhibiting proliferation. Scale bars, 50 μm. See also Figure S5.
Figure 7
Figure 7. RUNX3 promotes metastasis in human PDA
(A) Immunoblots for RUNX3 in human PDA lines. (B) Migration of control (Flag) and RUNX3-overexpressing (Flag-RUNX3) MiaPaCa-2 cells ±TGFβ (n=3, mean ± SEM, *p<0.05, **p<0.01). (C) Migration of control (Scr) or RUNX3-knockdown (shRUNX3) Panc-1 and CFPAC-1 cells ±TGFβ (n=3, mean ± SEM, *p<0.01). (D) Representative lung sections from NOD/SCID mice injected with control (Flag) or RUNX3-overexpressing (Flag-RUNX3) MiaPaCa-2 cells. Arrows, metastases. (E) Quantified metastatic pulmonary tumor burden from assays in (D). Two histological levels from three injected animals were assessed (mean ± SEM; *p<0.05). (F) Livers in vivo (left) and ex vivo (right) from NOD/SCID animals injected with control (Scr) or RUNX3-knockdown (shRUNX3) Panc-1 cells. Arrows, metastases. (G) Kaplan-Meier survival of patients after resection of a primary pancreas cancer. RUNX3 IHC of the primary tumor was used to stratify patients into high (score≥2; n=52) or low (score<2; n=36) populations; median survivals were 395 and 776 days, respectively (Wilcoxon p<0.018). (H) ICGC gene array data for SPP1 and COL6A1 expression in PDA patients who experienced distant (D; n=39) vs. local (L; n=8) relapse after surgery (*p<0.001; p=0.14, COL6A1 comparison). (I) Median survivals in patients (n=24) who received adjuvant systemic treatment with or without local radiation therapy as a function of RUNX3 status (low, score≤2; high, score>2). (J) RUNX3 and DPC4 levels coordinately help inform clinical decision-making for resectable PDA. These considerations are exploratory and not intended as proscriptive advice. Future prospectively collected information, perhaps augmented with retrospective analyses, will be essential to substantiate, revise or reject this working framework. 1An alternative would be a short course of radiotherapy followed by chemotherapy. See also Figure S6.

Comment in

  • It's a SMAD/SMAD World.
    Taniguchi C, Maitra A. Taniguchi C, et al. Cell. 2015 Jun 4;161(6):1245-6. doi: 10.1016/j.cell.2015.05.030. Cell. 2015. PMID: 26046433

Similar articles

Cited by

References

    1. Aguirre AJ, Bardeesy N, Sinha M, Lopez L, Tuveson DA, Horner J, Redston MS, DePinho RA. Activated Kras and Ink4a/Arf deficiency cooperate to produce metastatic pancreatic ductal adenocarcinoma. Genes Dev. 2003;17:3112–3126. - PMC - PubMed
    1. Allison DC, Piantadosi S, Hruban RH, Dooley WC, Fishman EK, Yeo CJ, Lillemoe KD, Pitt HA, Lin P, Cameron JL. DNA content and other factors associated with ten-year survival after resection of pancreatic carcinoma. J Surg Oncol. 1998;67:151–159. - PubMed
    1. Armstrong T, Packham G, Murphy LB, Bateman AC, Conti JA, Fine DR, Johnson CD, Benyon RC, Iredale JP. Type I collagen promotes the malignant phenotype of pancreatic ductal adenocarcinoma. Clin Cancer Res. 2004;10:7427–7437. - PubMed
    1. Bae SC, Choi JK. Tumor suppressor activity of RUNX3. Oncogene. 2004;23:4336–4340. - PubMed
    1. Bardeesy N, Aguirre AJ, Chu GC, Cheng KH, Lopez LV, Hezel AF, Feng B, Brennan C, Weissleder R, Mahmood U, et al. Both p16(Ink4a) and the p19(Arf)-p53 pathway constrain progression of pancreatic adenocarcinoma in the mouse. Proc Natl Acad Sci U S A. 2006;103:5947–5952. - PMC - PubMed

Publication types

MeSH terms