Sequence-based ultra-dense genetic and physical maps reveal structural variations of allopolyploid cotton genomes
- PMID: 26003111
- PMCID: PMC4469577
- DOI: 10.1186/s13059-015-0678-1
Sequence-based ultra-dense genetic and physical maps reveal structural variations of allopolyploid cotton genomes
Abstract
Background: SNPs are the most abundant polymorphism type, and have been explored in many crop genomic studies, including rice and maize. SNP discovery in allotetraploid cotton genomes has lagged behind that of other crops due to their complexity and polyploidy. In this study, genome-wide SNPs are detected systematically using next-generation sequencing and efficient SNP genotyping methods, and used to construct a linkage map and characterize the structural variations in polyploid cotton genomes.
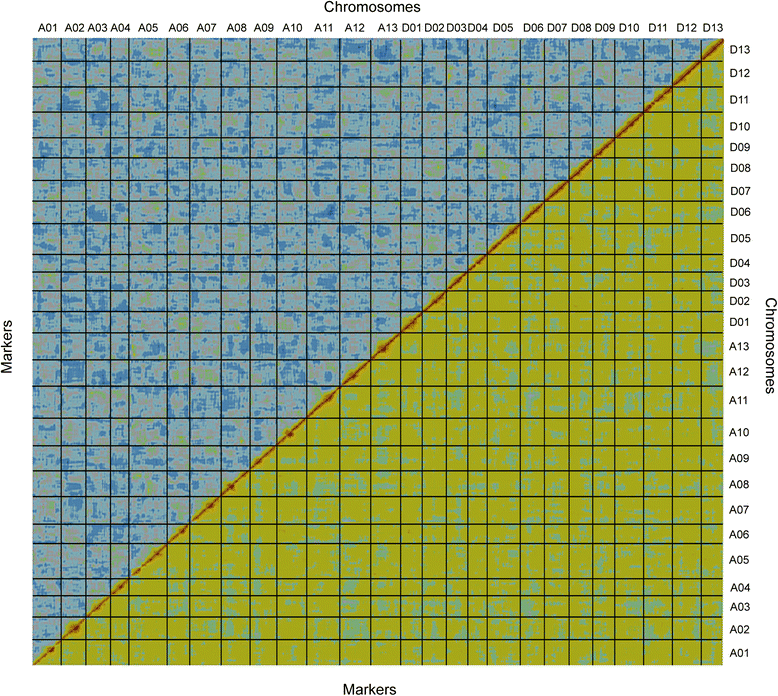
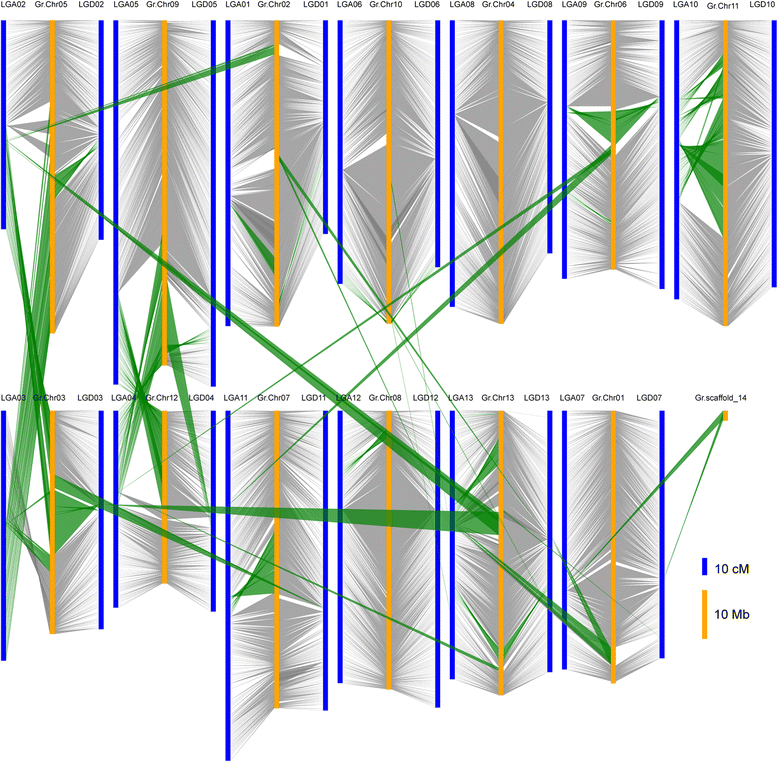
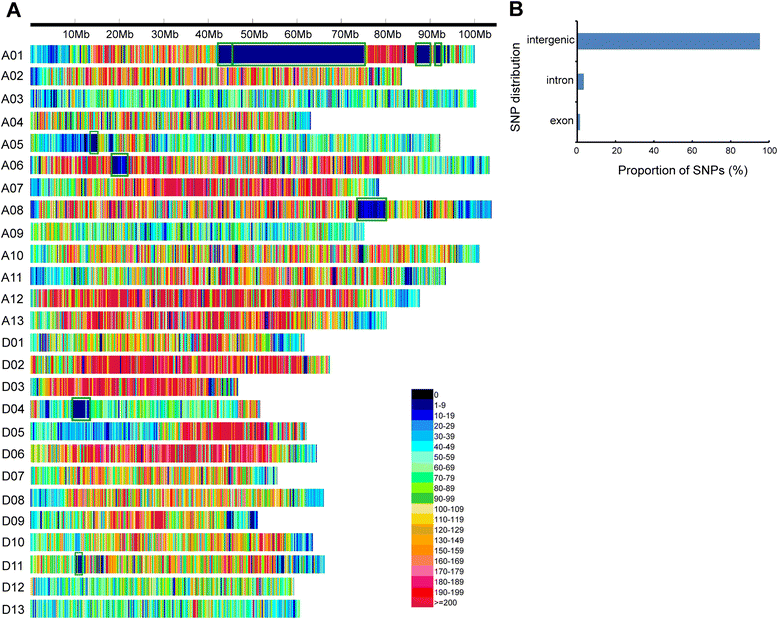
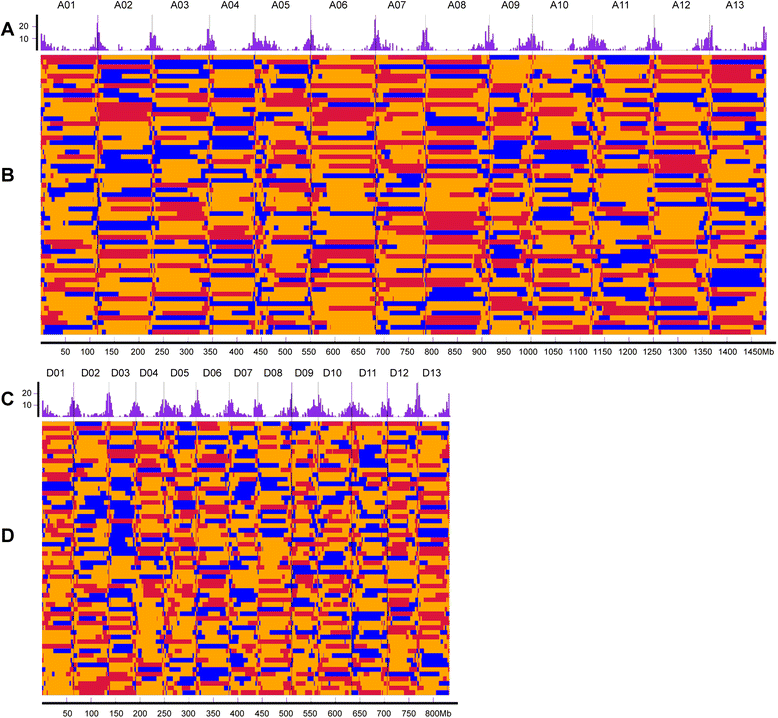
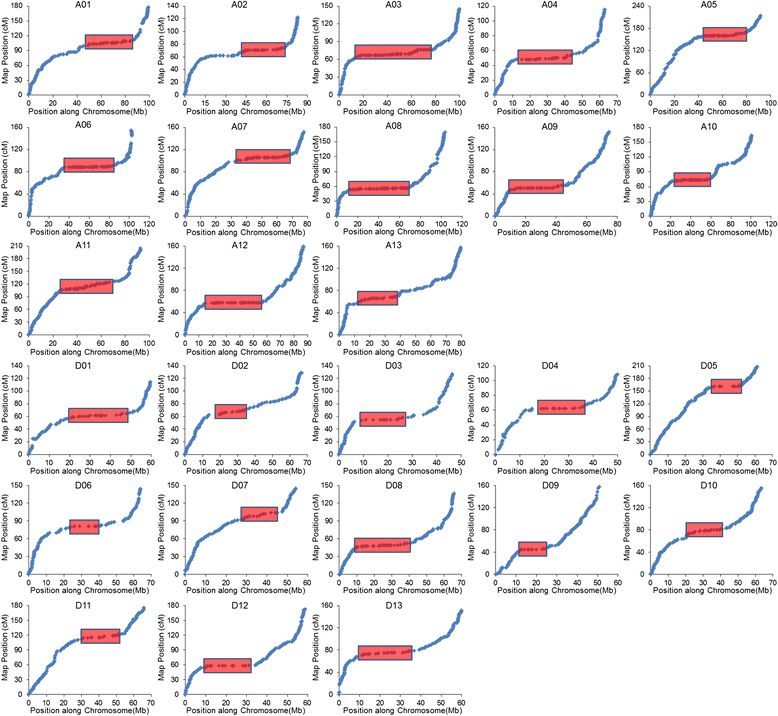
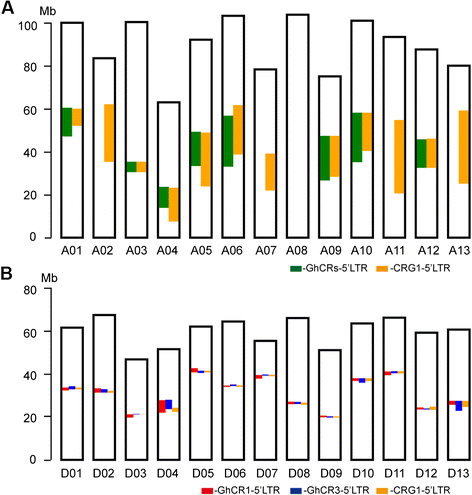
Results: We construct an ultra-dense inter-specific genetic map comprising 4,999,048 SNP loci distributed unevenly in 26 allotetraploid cotton linkage groups and covering 4,042 cM. The map is used to order tetraploid cotton genome scaffolds for accurate assembly of G. hirsutum acc. TM-1. Recombination rates and hotspots are identified across the cotton genome by comparing the assembled draft sequence and the genetic map. Using this map, genome rearrangements and centromeric regions are identified in tetraploid cotton by combining information from the publicly-available G. raimondii genome with fluorescent in situ hybridization analysis.
Conclusions: We report the genotype-by-sequencing method used to identify millions of SNPs between G. hirsutum and G. barbadense. We construct and use an ultra-dense SNP map to correct sequence mis-assemblies, merge scaffolds into pseudomolecules corresponding to chromosomes, detect genome rearrangements, and identify centromeric regions in allotetraploid cottons. We find that the centromeric retro-element sequence of tetraploid cotton derived from the D subgenome progenitor might have invaded the A subgenome centromeres after allotetrapolyploid formation. This study serves as a valuable genomic resource for genetic research and breeding of cotton.
Figures
Similar articles
-
Construction of a high-density genetic map by specific locus amplified fragment sequencing (SLAF-seq) and its application to Quantitative Trait Loci (QTL) analysis for boll weight in upland cotton (Gossypium hirsutum.).BMC Plant Biol. 2016 Apr 11;16:79. doi: 10.1186/s12870-016-0741-4. BMC Plant Biol. 2016. PMID: 27067834 Free PMC article.
-
Genetic mapping and QTL analysis of fiber-related traits in cotton ( Gossypium).Theor Appl Genet. 2004 Jan;108(2):280-91. doi: 10.1007/s00122-003-1433-7. Epub 2003 Sep 25. Theor Appl Genet. 2004. PMID: 14513220
-
A preliminary analysis of genome structure and composition in Gossypium hirsutum.BMC Genomics. 2008 Jul 1;9:314. doi: 10.1186/1471-2164-9-314. BMC Genomics. 2008. PMID: 18590573 Free PMC article.
-
Molecular markers and cotton genetic improvement: current status and future prospects.ScientificWorldJournal. 2014;2014:607091. doi: 10.1155/2014/607091. Epub 2014 Oct 23. ScientificWorldJournal. 2014. PMID: 25401149 Free PMC article. Review.
-
Application of genotyping by sequencing technology to a variety of crop breeding programs.Plant Sci. 2016 Jan;242:14-22. doi: 10.1016/j.plantsci.2015.04.016. Epub 2015 Apr 30. Plant Sci. 2016. PMID: 26566821 Review.
Cited by
-
Genome-wide characterization and phylogenetic analysis of GSK gene family in three species of cotton: evidence for a role of some GSKs in fiber development and responses to stress.BMC Plant Biol. 2018 Dec 4;18(1):330. doi: 10.1186/s12870-018-1526-8. BMC Plant Biol. 2018. PMID: 30514299 Free PMC article.
-
Gossypium barbadense and Gossypium hirsutum genomes provide insights into the origin and evolution of allotetraploid cotton.Nat Genet. 2019 Apr;51(4):739-748. doi: 10.1038/s41588-019-0371-5. Epub 2019 Mar 18. Nat Genet. 2019. PMID: 30886425
-
An ultra-high-density genetic map provides insights into genome synteny, recombination landscape and taproot skin colour in radish (Raphanus sativus L.).Plant Biotechnol J. 2020 Jan;18(1):274-286. doi: 10.1111/pbi.13195. Epub 2019 Jul 4. Plant Biotechnol J. 2020. PMID: 31218798 Free PMC article.
-
Genomic evolution and insights into agronomic trait innovations of Sesamum species.Plant Commun. 2024 Jan 8;5(1):100729. doi: 10.1016/j.xplc.2023.100729. Epub 2023 Oct 5. Plant Commun. 2024. PMID: 37798879 Free PMC article.
-
The lysin motif-containing proteins, Lyp1, Lyk7 and LysMe3, play important roles in chitin perception and defense against Verticillium dahliae in cotton.BMC Plant Biol. 2017 Sep 4;17(1):148. doi: 10.1186/s12870-017-1096-1. BMC Plant Biol. 2017. PMID: 28870172 Free PMC article.
References
-
- Gupta PK, Roy JK, Prasad M. Single nucleotide polymorphisms: A new paradigm for molecular marker technology and DNA polymorphism detection with emphasis on their use in plants. Curr Sci. 2001;80:524–35.
-
- Hyten DL, Cannon SB, Song Q, Weeks N, Fickus EW, Shoemaker RC, et al. High-throughput SNP discovery through deep resequencing of a reduced representation library to anchor and orient scaffolds in the soybean whole genome sequence. BMC Genomics. 2010;11:38. doi: 10.1186/1471-2164-11-38. - DOI - PMC - PubMed
Publication types
MeSH terms
Substances
LinkOut - more resources
Full Text Sources
Other Literature Sources

