. 2015 Jul 1;128(13):2330-8.
doi: 10.1242/jcs.167270. Epub 2015 May 21.

CALHM1 ion channel elicits amyloid-β clearance by insulin-degrading enzyme in cell lines and in vivo in the mouse brain

Affiliations

CALHM1 ion channel elicits amyloid-β clearance by insulin-degrading enzyme in cell lines and in vivo in the mouse brain

Valérie Vingtdeux et al. J Cell Sci. .

Abstract

Alzheimer's disease is characterized by amyloid-β (Aβ) peptide accumulation in the brain. CALHM1, a cell-surface Ca(2+) channel expressed in brain neurons, has anti-amyloidogenic properties in cell cultures. Here, we show that CALHM1 controls Aβ levels in vivo in the mouse brain through a previously unrecognized mechanism of regulation of Aβ clearance. Using pharmacological and genetic approaches in cell lines, we found that CALHM1 ion permeability and extracellular Ca(2+) were required for the Aβ-lowering effect of CALHM1. Aβ level reduction by CALHM1 could be explained by an increase in extracellular Aβ degradation by insulin-degrading enzyme (IDE), extracellular secretion of which was strongly potentiated by CALHM1 activation. Importantly, Calhm1 knockout in mice reduced IDE enzymatic activity in the brain, and increased endogenous Aβ concentrations by up to ∼50% in both the whole brain and primary neurons. Thus, CALHM1 controls Aβ levels in cell lines and in vivo by facilitating neuronal and Ca(2+)-dependent degradation of extracellular Aβ by IDE. This work identifies CALHM1 ion channel as a potential target for promoting amyloid clearance in Alzheimer's disease.

Keywords: Alzheimer's disease; Amyloid-β peptide; CALHM1; Insulin-degrading enzyme; Ion channel; Secretion.


Conflict of interest statement

Competing interests

The authors declare no competing or financial interests.

Figures

Fig. 1.
Fig. 1.
CALHM1 ion channel activation and extracellular Ca2+ control secreted Aβ levels. (A) [Ca2+]i measurements with Fluo-4 in HT-22 cells transfected with human CALHM1 or control empty vector. Cells were incubated in aCSF containing CALHM1-activating [Ca2+]o (0.2 mM CaCl2). Traces illustrate the mean relative fluorescence units (RFUs) ±s.e.m. (shaded areas) of three independent experiments. (B) Steady-state of [Ca2+]i measurements as in A, expressed in RFUs (mean±s.e.m.; *P<0.05; n=3; unpaired Student's t-test with Welch's correction). (C) APP-N2a cells transfected with control vector (V), human CALHM1 (hC) or mouse CALHM1 (mC) were incubated in 0.2 mM CaCl2 aCSF for 1 h to activate CALHM1. Secreted total Aβ and cellular APP, CALHM1 and actin were analyzed by western blotting. (D,E) APP-N2a cells transfected with control vector (V) or CALHM1 (hC) were preincubated or not for 30 min with Ruthenium Red (RuRed, 20 μM, D) or the indicated concentrations of ZnCl2 (E). Cells were then stimulated with 0.2 mM CaCl2 aCSF for 1 h in the presence or absence of RuRed or ZnCl2 and analyzed by western blotting for the indicated proteins. Secreted extracellular IDE (s-IDE) was also analyzed by western blotting. (F) APP-N2a cells were transfected with control vector (V), or WT-, N140A-, W114A- or D121R-CALHM1. Cells were then stimulated with 0.2 mM CaCl2 aCSF and analyzed as in C. (G) [Ca2+]i measurements with Fluo-4 in HT-22 cells transfected with CALHM1 or control vector as in A. [Ca2+]i was monitored in cells first incubated in 0.2 mM CaCl2 aCSF supplemented with 2 mM EGTA and then challenged with 5 mM CaCl2, as indicated in the graph. Traces illustrate the mean±s.e.m. (shaded areas) RFUs of three independent experiments. (H) Peak of [Ca2+]i measurements as in G, expressed in RFUs (mean±s.e.m.; **P<0.001; n=3; unpaired Student's t-test with Welch's correction). (I) APP-N2a cells transfected with control vector (V) or CALHM1 (hC) were stimulated with 0.2 mM CaCl2 aCSF for 30 min in the absence or presence of 2 mM EGTA. Cells were then challenged or not with 5 mM CaCl2 (+CaCl2) for 30 min and analyzed by western blotting as in C. Western blotting results in C–F and I are representative of at least three independent experiments.
Fig. 2.
Fig. 2.
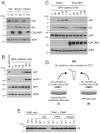
CALHM1 promotes extracellular Aβ degradation by a soluble proteolytic activity. (A) APP-N2a cells transfected with control vector (V) or human CALHM1 (hC) were preincubated or not for 30 min with NH4Cl (10 mM) or chloroquine (Chloro, 50 μM). Cells were then stimulated for 1 h with 0.2 mM CaCl2 aCSF supplemented or not with the different inhibitors. Secreted Aβ (sAβ) and cellular CALHM1 and actin were analyzed by western blotting. Intracellular Aβ (iAβ) was analyzed by immunoprecipitation and western blotting. (B) APP-N2a cells were treated or not (No BFA Ctrl) with brefeldin A (BFA, 1 µg/ml) for 3 h. BFA was then removed by washing and incubating the cells in complete culture medium for the indicated times to allow recovery of APP trafficking and maturation (BFA washout). Secreted Aβ (sAβ) and APPα (sAPPα) and cellular APP and actin were analyzed by western blotting. (C) APP-N2a cells transfected with control vector or human CALHM1 (hCALHM1) were treated with BFA as in B. Cells were then washed and stimulated with 0.2 mM CaCl2 aCSF for the indicated times (BFA washout). Secreted Aβ (sAβ) and cellular APP, CALHM1, and actin were analyzed by western blotting. Intracellular Aβ (iAβ) was analyzed by immunoprecipitation and western blotting. (D) Schematic description of the cell-free assay used in E. Naïve N2a cells transfected with control vector or CALHM1 were stimulated with 0.2 mM CaCl2 aCSF for 40 min (I). Conditioned medium (CM#1) was harvested and combined with APP-N2a cell conditioned medium (CM#2, II). Combined conditioned media were incubated for 60 min at 37°C to assess Aβ degradation (III). (E) Cell-free assay performed as in D by combining the conditioned medium (CM#1) from naïve N2a cells that were either non-transfected (NT), or transfected with control vector (V) or human CALHM1 (hC), with APP-N2a cell conditioned medium (CM#2). The assay was performed in the absence (Ctrl) or presence of 1,10-phenanthroline (PNT, 2 mM) or insulin (25 μM). As controls, APP-N2a cell conditioned medium was incubated separately in vitro (CM#2 only) at 4°C or 37°C to assess Aβ stability during the assay in the absence of CM#1. After incubation, Aβ levels were analyzed by western blotting. Western blotting results in A–C and E are representative of three independent experiments.
Fig. 3.
Fig. 3.
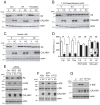
CALHM1 promotes extracellular Aβ degradation by IDE. (A–C) APP-N2a cells transfected with control vector (V) or human CALHM1 (hC) were preincubated or not for 30 min with phosphoramidon [PA, 100 μM, (A)], thiorphan [10 μM, (A)], PNT (B) or insulin (C). Cells were then stimulated for 1 h with 0.2 mM CaCl2 aCSF supplemented or not with the different inhibitors and were analyzed by western blotting for the indicated proteins. (D) Densitometric analyses and quantification of Aβ levels in three to six independent measurements as in A–C, expressed in arbitrary units (a.u.). Results are mean±s.d. *P<0.01; **P<0.0001 (unpaired Student's t-test). Thio, thiorphan; INS, insulin. (E) APP-N2a cells were co-transfected with IDE-targeting siRNA (IDE siRNA) and CALHM1 (hC), or with their respective controls, negative siRNA control (NEG siRNA) and control vector (V), respectively. Cells were then stimulated for 1 h with 0.2 mM CaCl2 aCSF and analyzed by western blotting for the indicated proteins. Secreted extracellular IDE (s-IDE) and intracellular IDE (i-IDE) were also analyzed by western blotting. Ctrl, control not transfected with siRNA. (F) Naïve N2a, APP-N2a, and HT-22 cells transfected with control vector (V) or human CALHM1 (hC) were stimulated for 1 h with 0.2 mM CaCl2 aCSF. Cells were then analyzed by western blotting for the indicated proteins. (G) APP-N2a cells transfected with control vector (V), WT-CALHM1 or W114A-CALHM1 were stimulated for 1 h with 0.2 mM CaCl2 aCSF and analyzed by western blotting for the indicated proteins. Western blotting results in A–C and E–G are representative of at least three independent experiments.
Fig. 4.
Fig. 4.
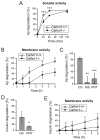
IDE activity in CALHM1-deficient mouse brains. (A–E) In vitro degradation assay of synthetic Aβ42 (A–C) and recombinant insulin (D,E) in soluble (A) or membrane-associated (B–E) brain homogenates from 6-month-old Calhm1+/+ and Calhm1−/− littermate mice. Aβ42 and insulin levels were measured by ELISA and expressed as a degradation percentage compared with the 0 h time point. Aβ42 (C) and insulin (D) degradation in membrane-associated fractions of Calhm1+/+ mouse brains were determined in the presence or absence of insulin [INS, 10 μM, (C)] or PNT (5 mM, C,D) at the 6 h time point. Results are mean±s.d. [n=3 or 4 (A,B,E); n=4 or 5 (C,D)]. *P<0.05, **P<0.01, ***P<0.001 (ANOVA Bonferroni post-hoc tests, A,B,E, or Student's t-tests, C,D).
Fig. 5.
Fig. 5.
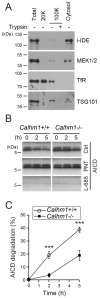
AICD degradation in CALHM1-deficient mouse brains. (A) IDE subcellular localization analysis by differential centrifugation in N2a cells. Cell homogenates (Total) were centrifuged at 20,000 g to isolate vesicles of plasma membrane origin and lysosomes [20 K, enriched in the cell surface marker transferrin receptor (TfR)]. Supernatant was then centrifuged at 100,000 g to isolate the endosomes and multivesicular bodies (100 K, enriched in both transferrin receptor and the ESCRT-I subunit TSG101). The final supernatant contained the soluble cytosolic proteins (cytosol, enriched in the cytosolic markers MEK1 and MEK2). Intact vesicles from the 100 K fraction were trypsinized to degrade proteins exposed to the cytosol (Trypsin). Equal amounts of proteins from the different fractions were then analyzed by western blotting using antibodies directed against the indicated proteins. i-IDE, intracellular IDE. Note that i-IDE was not significantly associated with intracellular vesicles retrieved at 20,000 g (i.e. the lysosomes and vesicles of plasma membrane origin) or at 100,000 g (i.e. the endosomes and multivesicular bodies), but instead was mainly found as a soluble pool in the cytosol. (B,C) An in vitro AICD degradation assay in brain homogenates of 6-month-old Calhm1+/+ and Calhm1−/− littermate mice. Representative western blotting of AICD levels over time during the assay in the absence or presence of PNT (5 mM) or L-685,458 (γ-secretase inhibitor, 5 μM) is shown in B. Western blotting quantification of three independent experiments as in B, expressed as a percentage of AICD degradation compared with the 0 time point, is shown in C. Results are mean±s.d. (n=3; ***P<0.001; ANOVA Bonferroni post-hoc tests). Western blotting results in A and B are representative of three independent experiments.
Fig. 6.
Fig. 6.
Endogenous Aβ and AICD levels in CALHM1-deficient mouse brains. (A) Steady-state levels of extracellular Aβ42 secreted by primary neurons obtained from Calhm1+/+ and Calhm1−/− mouse brains and maintained in culture for 7 and 14 days in vitro (DIV; results are mean±s.d.; n=4; **P<0.005; Student's t-test). (B) Extracellular Aβ42 levels after a 24 h secretion in the presence or absence of insulin (10 μM) in 14 DIV primary neurons obtained from Calhm1+/+ and Calhm1−/− mouse brains (results are mean±s.d.; n=6; ***P<0.0005; Student's t-test). (C–E) Endogenous Aβ40 (C) and Aβ42 (D) ELISA (results are mean±s.e.m.; n=8 or 9; ***P<0.001; **P<0.01; Student's t-test), and AICD western blotting (E) in brains of 15-month-old Calhm1+/+ and Calhm1−/− littermates. pAICD, phosphorylated form of AICD (Farris et al., 2003). Western blotting results in E are representative of three independent experiments. (F) Western blotting quantification of AICD levels as in E expressed in arbitrary units (a.u.; results are mean±s.d.; n=3; **P<0.002; Student's t-test).

Similar articles

Cited by

References

    1. Aguilar D., Skrabanek L., Gross S. S., Oliva B. and Campagne F. (2008). Beyond tissueInfo: functional prediction using tissue expression profile similarity searches. Nucleic Acids Res. 36, 3728-3737. 10.1093/nar/gkn233 - DOI - PMC - PubMed
    1. Benilova I., Gallardo R., Ungureanu A.-A., Castillo Cano V., Snellinx A., Ramakers M., Bartic C., Rousseau F., Schymkowitz J. and De Strooper B. (2014). The Alzheimer disease protective mutation A2T modulates kinetic and thermodynamic properties of amyloid-β (Aβ) aggregation. J. Biol. Chem. 289, 30977-30989. 10.1074/jbc.M114.599027 - DOI - PMC - PubMed
    1. Berridge M. J. (2010). Calcium hypothesis of Alzheimer's disease. Pflugers Arch. Eur. J. Physiol. 459, 441-449. 10.1007/s00424-009-0736-1 - DOI - PubMed
    1. Chapuis J., Vingtdeux V., Campagne F., Davies P. and Marambaud P. (2011). Growth arrest-specific 1 binds to and controls the maturation and processing of the amyloid-beta precursor protein. Hum. Mol. Genet. 20, 2026-2036. 10.1093/hmg/ddr085 - DOI - PMC - PubMed
    1. Citron M. (2010). Alzheimer's disease: strategies for disease modification. Nat. Rev. Drug Discov. 9, 387-398. 10.1038/nrd2896 - DOI - PubMed

Publication types

LinkOut - more resources