Celecoxib increases EGF signaling in colon tumor associated fibroblasts, modulating EGFR expression and degradation
- PMID: 25987127
- PMCID: PMC4494940
- DOI: 10.18632/oncotarget.3678
Celecoxib increases EGF signaling in colon tumor associated fibroblasts, modulating EGFR expression and degradation
Abstract
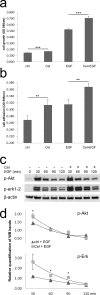
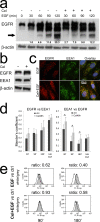
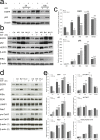
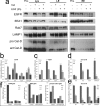
We previously demonstrated that non-toxic doses of Celecoxib induced the immediate phosphorylation of Erk1-2 in colon tumor associated fibroblasts (TAFs), increasing their responsiveness to epidermal growth factor (EGF). We have now identified two concomitant mechanisms explaining the EGF-Celecoxib cooperation. We found that a 24-48h Celecoxib priming increased EGF receptor (EGFR) mRNA and protein levels in colon TAFs, promoting EGF binding and internalization. Celecoxib-primed TAFs showed a reduced EGFR degradation after EGF challenge. This delay corresponded to a deferred dissociation of EEA1 from EGFR positive endosomes and the accumulation of Rab7, pro Cathepsin-D and SQSTM1/p62, suggesting a shared bottleneck in the pathways of late-endosomes/autophagosomes maturation. Celecoxib modulated the levels of target proteins similarly to the inhibitors of endosome/lysosome acidification Bafilomycin-A1 and NH(4)Cl. Cytoplasmic vesicles fractionation showed a reduced maturation of Cathepsin-D in late endosomes and an increased content of EGFR and Rab7 in lysosomes of Celecoxib-treated TAFs.Our data indicate a double mechanism mediating the increased response to EGF of colon TAFs treated with Celecoxib. While EGFR overexpression could be targeted using anti EGFR drugs, the effects on endosome trafficking and protein turnover represents a more elusive target and should be taken into account for any long-term therapy with Celecoxib.
Keywords: EGFR; celecoxib; colon; fibroblast.
Conflict of interest statement
No potential conflict of interest to be disclosed.
Figures


Similar articles
-
Celecoxib inactivates epithelial-mesenchymal transition stimulated by hypoxia and/or epidermal growth factor in colon cancer cells.Mol Carcinog. 2012 Oct;51(10):783-95. doi: 10.1002/mc.20846. Epub 2011 Aug 31. Mol Carcinog. 2012. PMID: 21882253
-
Epidermal growth factor competes with EGF receptor inhibitors to induce cell death in EGFR-overexpressing tumor cells.Cancer Lett. 2009 Oct 8;283(2):135-42. doi: 10.1016/j.canlet.2009.03.034. Epub 2009 Apr 19. Cancer Lett. 2009. PMID: 19380191
-
Role of the microtubule cytoskeleton in traffic of EGF through the lacrimal acinar cell endomembrane network.Exp Eye Res. 2004 Jun;78(6):1093-106. doi: 10.1016/j.exer.2004.01.009. Exp Eye Res. 2004. PMID: 15109916
-
Epidermal growth factor receptor-targeted immunoliposomes for delivery of celecoxib to cancer cells.Int J Pharm. 2015 Feb 20;479(2):364-73. doi: 10.1016/j.ijpharm.2015.01.016. Epub 2015 Jan 13. Int J Pharm. 2015. PMID: 25595386
-
Mathematical model for the effects of epidermal growth factor receptor trafficking dynamics on fibroblast proliferation responses.Biotechnol Prog. 1992 Mar-Apr;8(2):132-43. doi: 10.1021/bp00014a007. Biotechnol Prog. 1992. PMID: 1368006
Cited by
-
Investigation of the Potential Mechanism of Alpinia officinarum Hance in Improving Type 2 Diabetes Mellitus Based on Network Pharmacology and Molecular Docking.Evid Based Complement Alternat Med. 2023 Feb 9;2023:4934711. doi: 10.1155/2023/4934711. eCollection 2023. Evid Based Complement Alternat Med. 2023. PMID: 36818229 Free PMC article.
-
Reprogramming the tumor microenvironment to improve the efficacy of cancer immunotherapies.Med Oncol. 2022 Sep 29;39(12):239. doi: 10.1007/s12032-022-01842-5. Med Oncol. 2022. PMID: 36175691 Review.
-
PDGF signaling pathway in hepatic fibrosis pathogenesis and therapeutics (Review).Mol Med Rep. 2017 Dec;16(6):7879-7889. doi: 10.3892/mmr.2017.7641. Epub 2017 Sep 27. Mol Med Rep. 2017. PMID: 28983598 Free PMC article. Review.
-
Effects of Cyclooxygenase-2 Inhibitors on Gastrointestinal Malignancies: a Systematic Review and Meta-analysis.Indian J Surg Oncol. 2022 Jun;13(2):348-355. doi: 10.1007/s13193-022-01547-1. Epub 2022 May 10. Indian J Surg Oncol. 2022. PMID: 35782818 Free PMC article.
-
TRAF6 regulates EGF-induced cell transformation and cSCC malignant phenotype through CD147/EGFR.Oncogenesis. 2018 Feb 20;7(2):17. doi: 10.1038/s41389-018-0030-1. Oncogenesis. 2018. PMID: 29463844 Free PMC article.
References
-
- Powell DW, Mifflin RC, Valentich JD, Crowe SE, Saada JI, West AB. Myofibroblasts. II. Intestinal subepithelial myofibroblasts. Am J Physiol. 1999;277:C183–201. - PubMed
-
- Powell DW, Adegboyega PA, Di Mari JF, Mifflin RC. Epithelial cells and their neighbors I. Role of intestinal myofibroblasts in development, repair, and cancer. Am J Physiol Gastrointest Liver Physiol. 2005;289:G2–7. - PubMed
-
- Martin M, Pujuguet P, Martin F. Role of stromal myofibroblasts infiltrating colon cancer in tumor invasion. Pathol Res Pract. 1996;192:712–717. - PubMed
Publication types
MeSH terms
Substances
LinkOut - more resources
Full Text Sources
Other Literature Sources
Research Materials
Miscellaneous

