. 2015 Apr 23:8:16.
doi: 10.1186/s13072-015-0009-5. eCollection 2015.

Occupancy by key transcription factors is a more accurate predictor of enhancer activity than histone modifications or chromatin accessibility

Affiliations

Occupancy by key transcription factors is a more accurate predictor of enhancer activity than histone modifications or chromatin accessibility

Nergiz Dogan et al. Epigenetics Chromatin. .

Abstract

Background: Regulated gene expression controls organismal development, and variation in regulatory patterns has been implicated in complex traits. Thus accurate prediction of enhancers is important for further understanding of these processes. Genome-wide measurement of epigenetic features, such as histone modifications and occupancy by transcription factors, is improving enhancer predictions, but the contribution of these features to prediction accuracy is not known. Given the importance of the hematopoietic transcription factor TAL1 for erythroid gene activation, we predicted candidate enhancers based on genomic occupancy by TAL1 and measured their activity. Contributions of multiple features to enhancer prediction were evaluated based on the results of these and other studies.

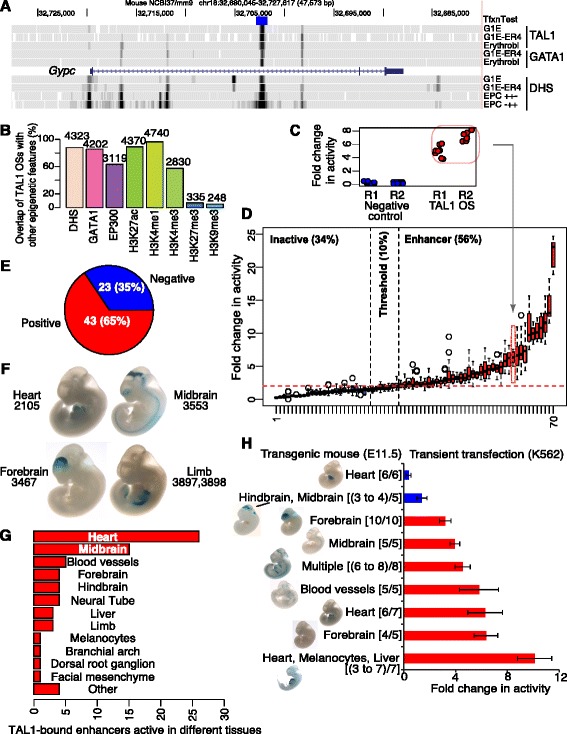
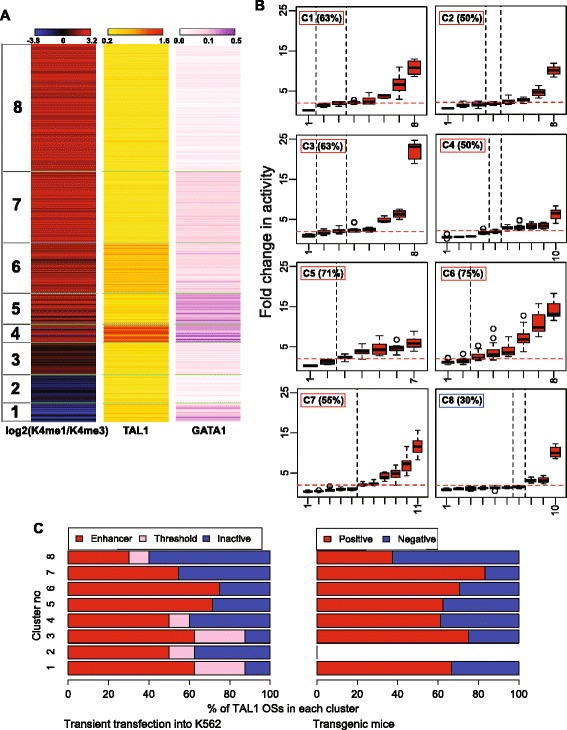
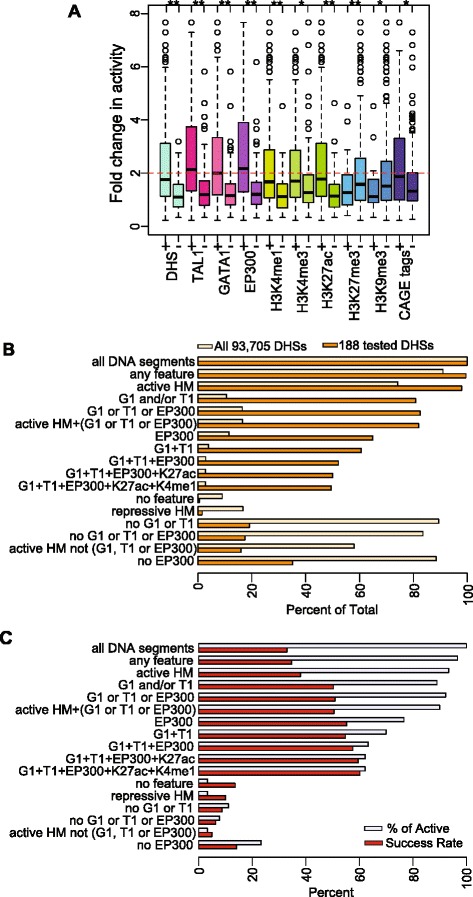
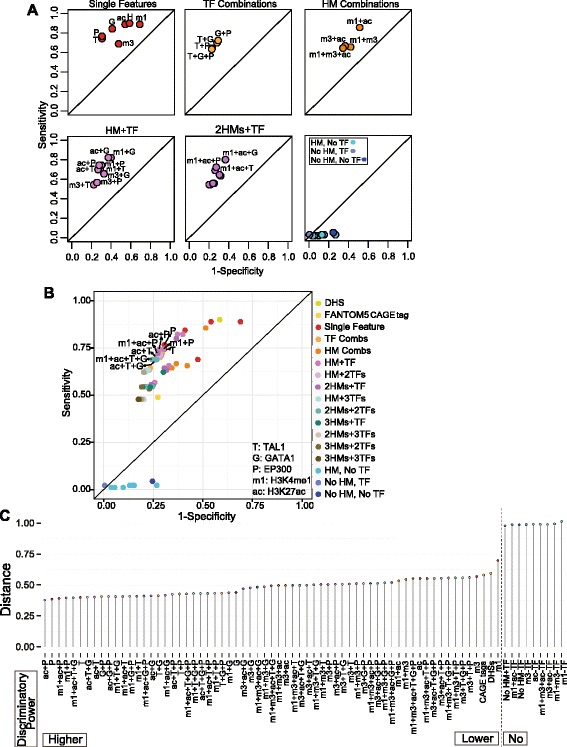
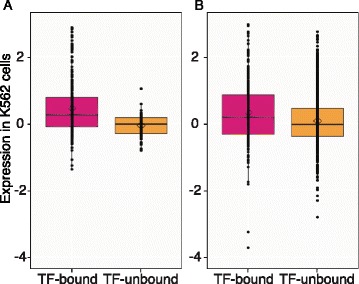
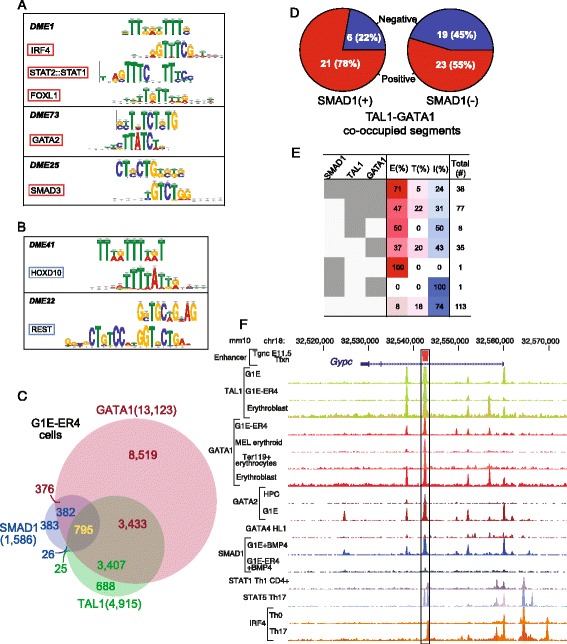
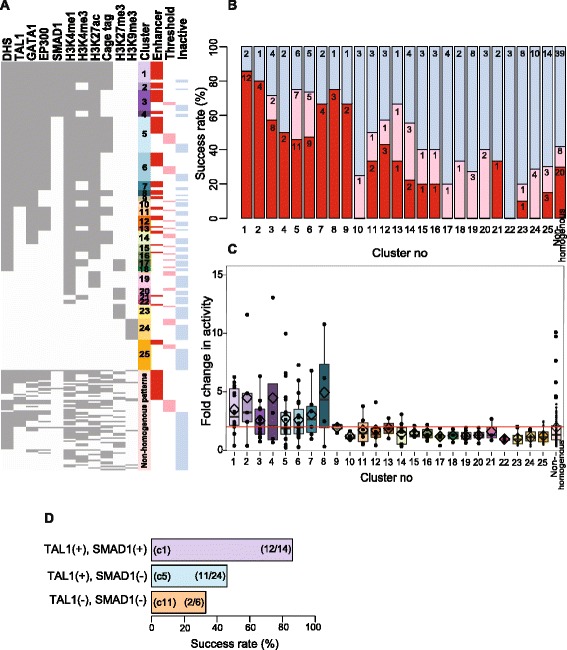
Results: TAL1-bound DNA segments were active enhancers at a high rate both in transient transfections of cultured cells (39 of 79, or 56%) and transgenic mice (43 of 66, or 65%). The level of binding signal for TAL1 or GATA1 did not help distinguish TAL1-bound DNA segments as active versus inactive enhancers, nor did the density of regulation-related histone modifications. A meta-analysis of results from this and other studies (273 tested predicted enhancers) showed that the presence of TAL1, GATA1, EP300, SMAD1, H3K4 methylation, H3K27ac, and CAGE tags at DNase hypersensitive sites gave the most accurate predictors of enhancer activity, with a success rate over 80% and a median threefold increase in activity. Chromatin accessibility assays and the histone modifications H3K4me1 and H3K27ac were sensitive for finding enhancers, but they have high false positive rates unless transcription factor occupancy is also included.

Conclusions: Occupancy by key transcription factors such as TAL1, GATA1, SMAD1, and EP300, along with evidence of transcription, improves the accuracy of enhancer predictions based on epigenetic features.

Keywords: Enhancer assay; Functional genomics; GATA1; Gene regulation; Histone modifications; TAL1.


Figures

Figure 1
Figure 1
Genome-wide prediction of TAL1 OSs as enhancers. (A) Epigenetic marks overlapping a TAL1 peak within Gypc. Tracks displayed on the UCSC Genome Browser [109] show, in descending order, the DNA segment tested for enhancer activity, occupancy by TAL1 and GATA1, the gene model, DNase hypersensitive sites in G1E cells, G1E-ER4 cells treated with estradiol, and mouse primary fetal liver-derived early erythroid progenitors (EPC CD117+, CD71+, TER119-) and differentiating erythroblasts (EPC CD117-, CD71+, TER119+). (B) Overview of ChIP-seq data for epigenetic features at TAL1 peaks. (C, D) Erythroid enhancer activity of TAL1 OSs in a transient transfection assay. (C) Biological replicates (two different days of transfection, Rep1 and Rep2) and technical replicates (eight for each biological replicate) of the enhancer assays of a negative control vector and an expression vector containing TAL1 OS from the Gypc intron. (D) Enhancer assay results for 70 TAL1 OSs, ordered by activity. The distribution of results for each TAL1 OS is shown as a box plot, with the internal line indicating the median value. Boxes for inactive TAL1 OSs are shaded blue, those in the threshold zone are pink, and those with activity are shaded red. (E, F, G) Tissue-specific enhancer activities of TAL1 OSs in transgenic mouse assays. (E) Partitions of 66 TAL1 OSs by enhancer activity. (F) Four examples of whole mouse embryos with in vivo enhancer activity at E11.5. (G) Distribution of tissues showing enhancement by the TAL1 OSs. For TAL1 OSs active in multiple tissues, each tissue was counted for the distribution. (H) Comparison of the results of the two enhancer assays on nine TAL1 OSs. Stained mouse images are from the VISTA Enhancer Browser.
Figure 2
Figure 2
Clustering TAL1 OSs based on epigenetic features. (A) TAL1 OSs clustered by the ChIP-seq signals of H3K4me1 and H3K4me3 (log2 of the ratio), TAL1, and GATA1 (k-means clusters, k = 8). (B) Enhancer activities of TAL1 OSs tested by transient transfection assays in K562 cells, grouped in clusters by epigenetic features. The names of individual TAL1 OSs are given along the x-axis, and the percent active in each cluster is listed. The distinctive properties of each TAL1 OS cluster are summarized in the three colored bars, derived from Figure 2A. (C) Activities of TAL1 OSs grouped in clusters by epigenetic features, shown for both enhancer assays: transient transfection into K562 cells (left) and transgenic mice at E11.5 (right).
Figure 3
Figure 3
Contributions of TF binding versus histone modification enrichment to enhancer activity. (A) Distributions of enhancer activities of 273 DNA segments marked by each feature individually. The asterisks indicate statistically significant difference in activity between the presence and absence of the features. (B) Proportions of DHSs in 24-h-induced G1E-ER4 cells (total of 93,705) and tested DNA fragments that overlap DHSs (total of 188) with each feature combination. (C) The percentage of active enhancers captured by each set of features and the success rate of tested DNA segments (total of 273) with each feature combination.
Figure 4
Figure 4
Meta-analysis of contributions of epigenetic features to enhancer activity. The sensitivity and specificity of epigenetic features singly and in combination for prediction of enhancer activity were evaluated for 273 DNA segments tested in transient transfection assays. The results are displayed as a receiver-operator characteristic (ROC) graph. The graphs in (A) show the results for informative groups of features, and (B) shows the results for all combinations of features. Abbreviations and color code are defined in panel (B). The top eight discriminators with the best performance (dots in the upper left) are labeled in (B). (C) Dot plot illustrating the distance of 74 feature and feature combinations to the point with the best discriminator performance (Sn = 1 and Sp = 1).
Figure 5
Figure 5
Association of TF binding with strength of enhancement in high-throughput enhancer assays. Distribution of expression levels of (A) 320 DNA segments with GATA motif instances that are in enhancer chromatin states in K562 cells [27], and (B) 1,499 DNA segments that are in enhancer chromatin states in K562 cells [28]. The assayed DNA segments were categorized as TF bound or TF unbound based on overlap with ChIP-seq peaks for EP300, TAL1, GATA1, or GATA2 in K562 cells [51]. The distribution of enhancer activities (from [27] and [28]) in each category is presented as box plots. The total numbers of DNA segments in each category are given at the bottom of the plots. The horizontal internal line and the diamond shape indicate the median and mean of enhancer activity in each category, respectively.
Figure 6
Figure 6
Candidate regulators of TAL1-bound active enhancers. (A) Motifs that distinguish TAL1 OSs that are active enhancers from those that are inactive. The motif discovered by DME2 is given on the first line of each box, followed by the known TF binding site motifs discovered by TOMTOM, all shown as aligned logos. (B) Motifs that distinguish TAL1 OSs that are inactive enhancers from those that are active. (C) Venn diagrams show genome-wide overlaps between SMAD1, TAL1, and GATA1 peaks in erythroid lineage, G1E-ER4 + E2 cells. Number of regions bound by these peaks is shown. (D) Power of SMAD1 binding on enhancer activity in transgenic mice. (E) Heat map depicting the effect of co-localization of SMAD1, TAL1, and GATA1 in different combinations on success rate in vitro enhancer assay (transfections into hematopoietic cell line). (F) Shown is an intron of the Gypc gene in the mouse genome, along with ChIP-seq binding profiles for TAL1 (GEO sample numbers: GSM746555-56, GSM746571-72, GSM746583_84), GATA1 (GSM453997, GSM417015, GSM1151146, GSM746581-82), GATA2 (GSM641911, GSM722387), GATA4 (GSM558904), SMAD1 (GSM722388, GSM722391), STAT1 (GSM994528), STAT5 (GSM652878), STAT5b (GSM1014575, GSM671418), IRF4 (GSM1004833_35, GSM1004821), and FOXO1 (GSM1131775, GSM998924) in hematopoietic cells, in descending order. ChIP-seq binding signals (bigwig) were obtained from CODEX [59].
Figure 7
Figure 7
Combinations of epigenetic features and their association with enhancer activity. (A) Each row of the diagram shows the features and activity results for 1 of the 273 tested DNA segments. The presence or absence of the 11 epigenetic features is represented by grey and white, respectively. The tested segments were organized into clusters by DBSCAN [69] using the binary representation of the epigenetic features. Each tested DNA segment is also categorized by activity in the transient transfection assay, denoted by a colored entry in the last three rows (red = active, pink = threshold, blue = inactive). Success rates (B) and activities (C) in enhancer assays on 273 DNA segments in each cluster formed by DBSCAN. (D) Power of SMAD1 and TAL1 binding to identify enhancers.

Similar articles

Cited by

References

    1. Hardison RC, Taylor J. Genomic approaches towards finding cis-regulatory modules in animals. Nat Rev Genet. 2012;13:469–83. doi: 10.1038/nrg3242. - DOI - PMC - PubMed
    1. Janky R, van Helden J. Evaluation of phylogenetic footprint discovery for predicting bacterial cis-regulatory elements and revealing their evolution. BMC Bioinf. 2008;9:37. doi: 10.1186/1471-2105-9-37. - DOI - PMC - PubMed
    1. Hardison RC. Conserved noncoding sequences are reliable guides to regulatory elements. Trends Genet. 2000;16:369–72. doi: 10.1016/S0168-9525(00)02081-3. - DOI - PubMed
    1. Aparicio S, Chapman J, Stupka E, Putnam N, Chia JM, Dehal P, et al. Whole-genome shotgun assembly and analysis of the genome of Fugu rubripes. Science. 2002;297:1301–10. doi: 10.1126/science.1072104. - DOI - PubMed
    1. Pennacchio LA, Ahituv N, Moses AM, Prabhakar S, Nobrega MA, Shoukry M, et al. In vivo enhancer analysis of human conserved non-coding sequences. Nature. 2006;444:499–502. doi: 10.1038/nature05295. - DOI - PubMed