

Altered proliferative ability of neuronal progenitors in PlexinA1 mutant mice
- PMID: 25975775
- PMCID: PMC4737253
- DOI: 10.1002/cne.23806
Altered proliferative ability of neuronal progenitors in PlexinA1 mutant mice
Abstract
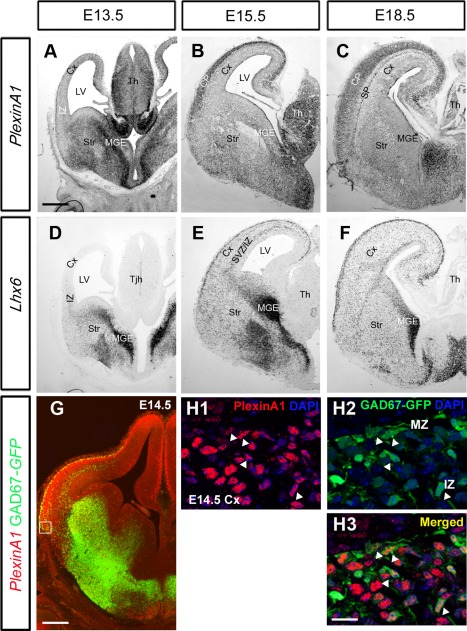
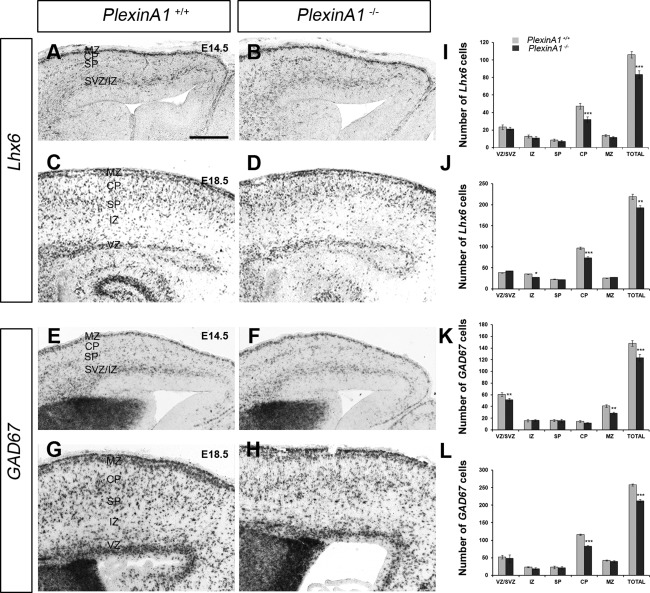
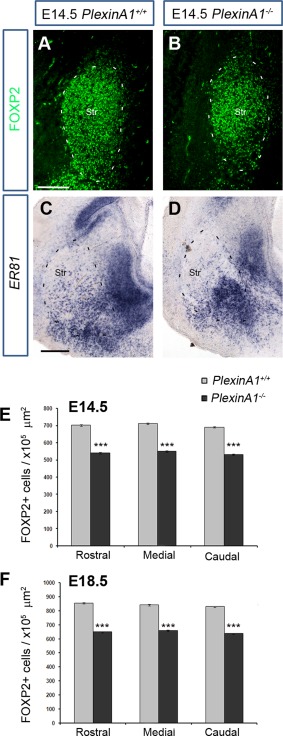
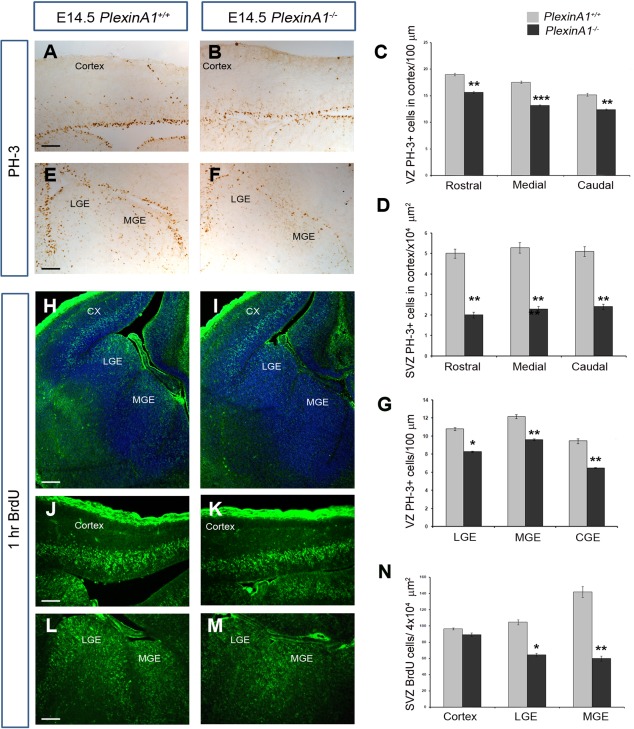
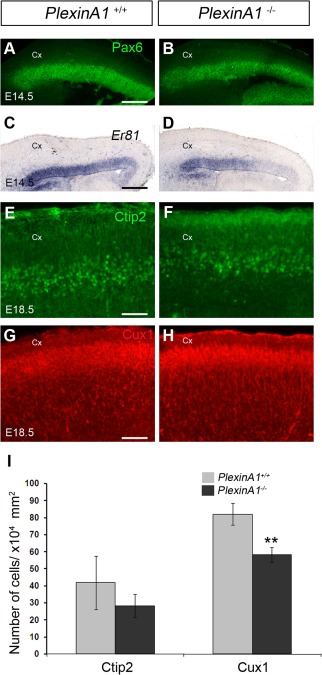
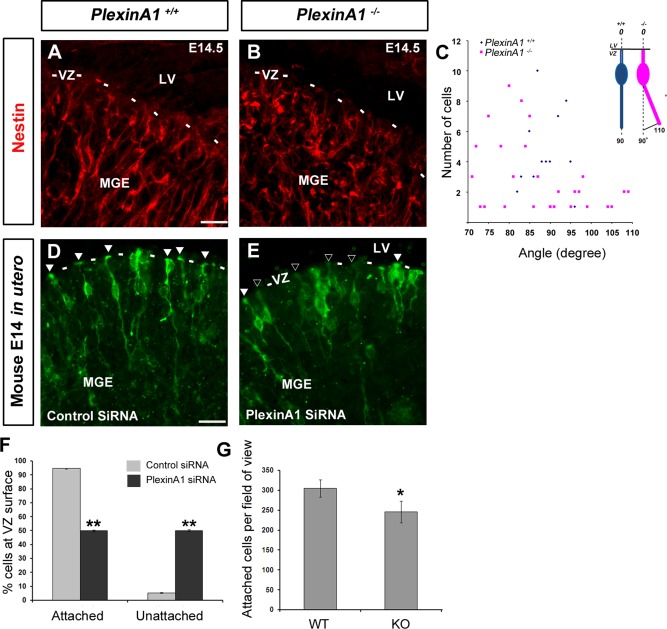
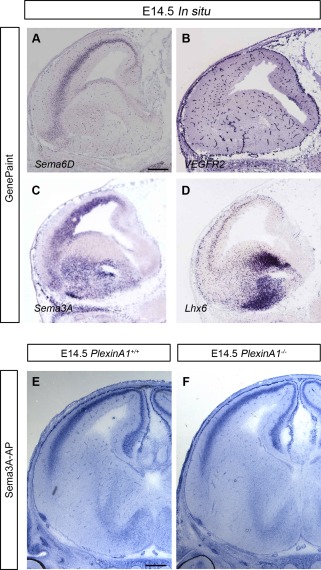
Cortical interneurons are generated predominantly in the medial ganglionic eminence (MGE) and migrate through the ventral and dorsal telencephalon before taking their final positions within the developing cortical plate. Previously we demonstrated that interneurons from Robo1 knockout (Robo1(-/-)) mice contain reduced levels of neuropilin 1 (Nrp1) and PlexinA1 receptors, rendering them less responsive to the chemorepulsive actions of semaphorin ligands expressed in the striatum and affecting their course of migration (Hernandez-Miranda et al. [2011] J. Neurosci. 31:6174-6187). Earlier studies have highlighted the importance of Nrp1 and Nrp2 in interneuron migration, and here we assess the role of PlexinA1 in this process. We observed significantly fewer cells expressing the interneuron markers Gad67 and Lhx6 in the cortex of PlexinA1(-/-) mice compared with wild-type littermates at E14.5 and E18.5. Although the level of apoptosis was similar in the mutant and control forebrain, proliferation was significantly reduced in the former. Furthermore, progenitor cells in the MGE of PlexinA1(-/-) mice appeared to be poorly anchored to the ventricular surface and showed reduced adhesive properties, which may account for the observed reduction in proliferation. Together our data uncover a novel role for PlexinA1 in forebrain development.
Keywords: Plexin; forebrain; interneurons; neuronal migration; proliferation.
© 2015 The Authors The Journal of Comparative Neurology Published by Wiley Periodicals, Inc.
Figures
Similar articles
-
Semaphorin3A-neuropilin1 signalling is involved in the generation of cortical interneurons.Brain Struct Funct. 2017 Jul;222(5):2217-2233. doi: 10.1007/s00429-016-1337-3. Epub 2016 Nov 17. Brain Struct Funct. 2017. PMID: 27858201 Free PMC article.
-
Robo1 regulates semaphorin signaling to guide the migration of cortical interneurons through the ventral forebrain.J Neurosci. 2011 Apr 20;31(16):6174-87. doi: 10.1523/JNEUROSCI.5464-10.2011. J Neurosci. 2011. PMID: 21508241 Free PMC article.
-
Lhx6 activity is required for the normal migration and specification of cortical interneuron subtypes.J Neurosci. 2007 Mar 21;27(12):3078-89. doi: 10.1523/JNEUROSCI.3055-06.2007. J Neurosci. 2007. PMID: 17376969 Free PMC article.
-
The development of MGE-derived cortical interneurons: An Lhx6 tale.Int J Dev Biol. 2022;66(1-2-3):43-49. doi: 10.1387/ijdb.210185md. Int J Dev Biol. 2022. PMID: 34881792 Review.
-
Cell cycle regulation and interneuron production.Dev Neurobiol. 2011 Jan 1;71(1):2-9. doi: 10.1002/dneu.20823. Dev Neurobiol. 2011. PMID: 21154905 Free PMC article. Review.
Cited by
-
Structural and functional conservation of non-lumenized lymphatic endothelial cells in the mammalian leptomeninges.Acta Neuropathol. 2020 Feb;139(2):383-401. doi: 10.1007/s00401-019-02091-z. Epub 2019 Nov 6. Acta Neuropathol. 2020. PMID: 31696318 Free PMC article.
-
Stage-specific functions of Semaphorin7A during adult hippocampal neurogenesis rely on distinct receptors.Nat Commun. 2017 Mar 10;8:14666. doi: 10.1038/ncomms14666. Nat Commun. 2017. PMID: 28281529 Free PMC article.
-
PlexinA1 deficiency in BALB/cAJ mice leads to excessive self-grooming and reduced prepulse inhibition.IBRO Rep. 2020 Oct 22;9:276-289. doi: 10.1016/j.ibror.2020.10.004. eCollection 2020 Dec. IBRO Rep. 2020. PMID: 33163687 Free PMC article.
-
Semaphorin3A-neuropilin1 signalling is involved in the generation of cortical interneurons.Brain Struct Funct. 2017 Jul;222(5):2217-2233. doi: 10.1007/s00429-016-1337-3. Epub 2016 Nov 17. Brain Struct Funct. 2017. PMID: 27858201 Free PMC article.
-
Is developmental plasticity triggered by DNA methylation changes in the invasive cane toad (Rhinella marina)?Ecol Evol. 2024 Mar 6;14(3):e11127. doi: 10.1002/ece3.11127. eCollection 2024 Mar. Ecol Evol. 2024. PMID: 38450317 Free PMC article.
References
-
- Andrews W, Barber M, Hernadez‐Miranda LR, Xian J, Rakic S, Sundaresan V, Rabbitts TH, Pannell R, Rabbitts P, Thompson H, Erskine L, Murakami F, Parnavelas JG. 2008. The role of Slit–Robo signaling in the generation, migration and morphological differentiation of cortical interneurons. Dev Biol 313:648–658. - PubMed
-
- Arlotta P, Molyneaux BJ, Chen J, Inoue J, Kominami R, Macklis JD. 2005. Neuronal subtype‐specific genes that control corticospinal motor neuron development in vivo. Neuron 45:207–221. - PubMed
Publication types
MeSH terms
Substances
Grants and funding
LinkOut - more resources
Full Text Sources
Other Literature Sources
Molecular Biology Databases
Miscellaneous
