

A new gender-specific model for skin autofluorescence risk stratification
- PMID: 25974028
- PMCID: PMC4431468
- DOI: 10.1038/srep10198
A new gender-specific model for skin autofluorescence risk stratification
Erratum in
-
Corrigendum: A new gender-specific model for skin autofluorescence risk stratification.Sci Rep. 2017 May 31;7:46832. doi: 10.1038/srep46832. Sci Rep. 2017. PMID: 28561805 Free PMC article.
Abstract
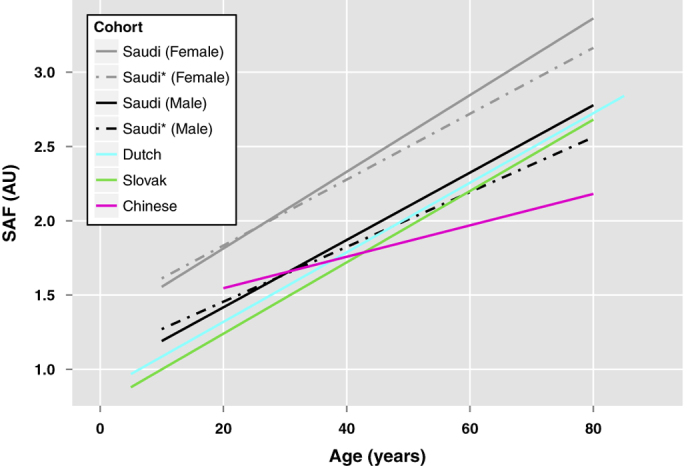
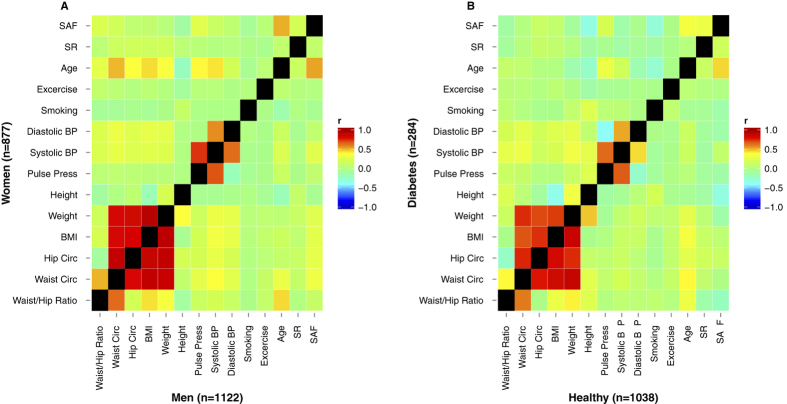
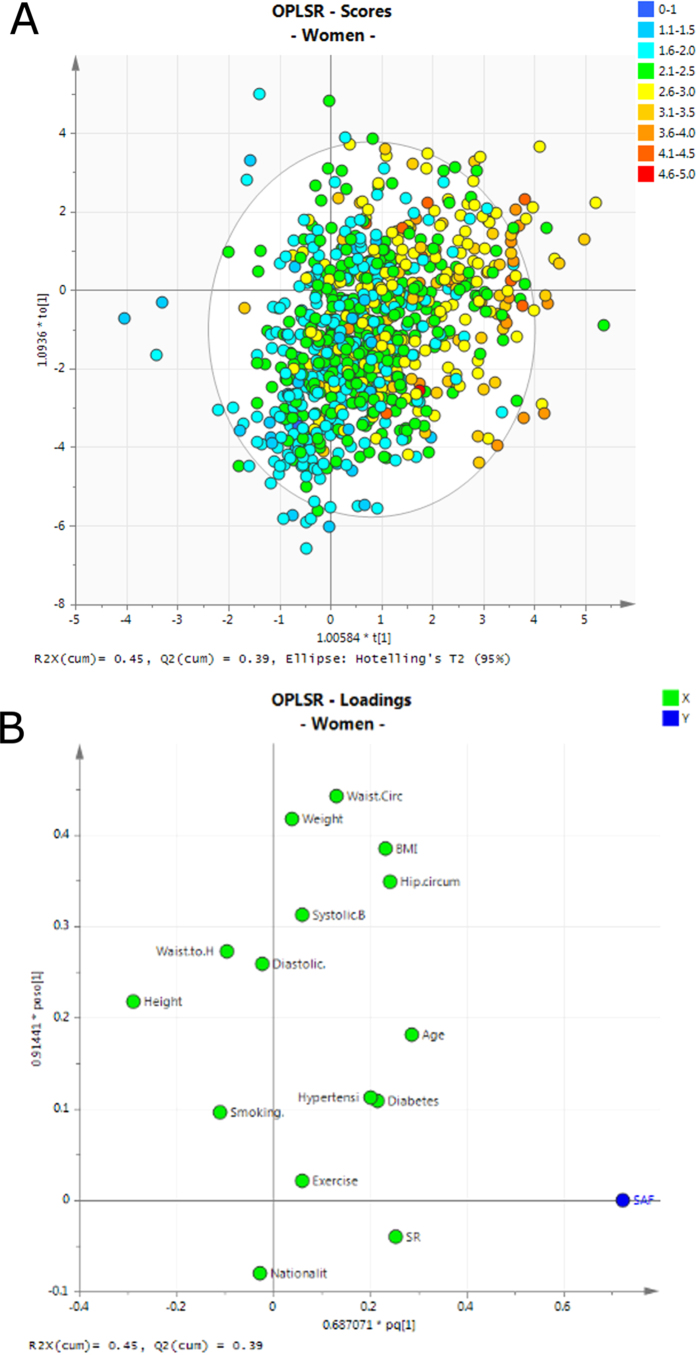
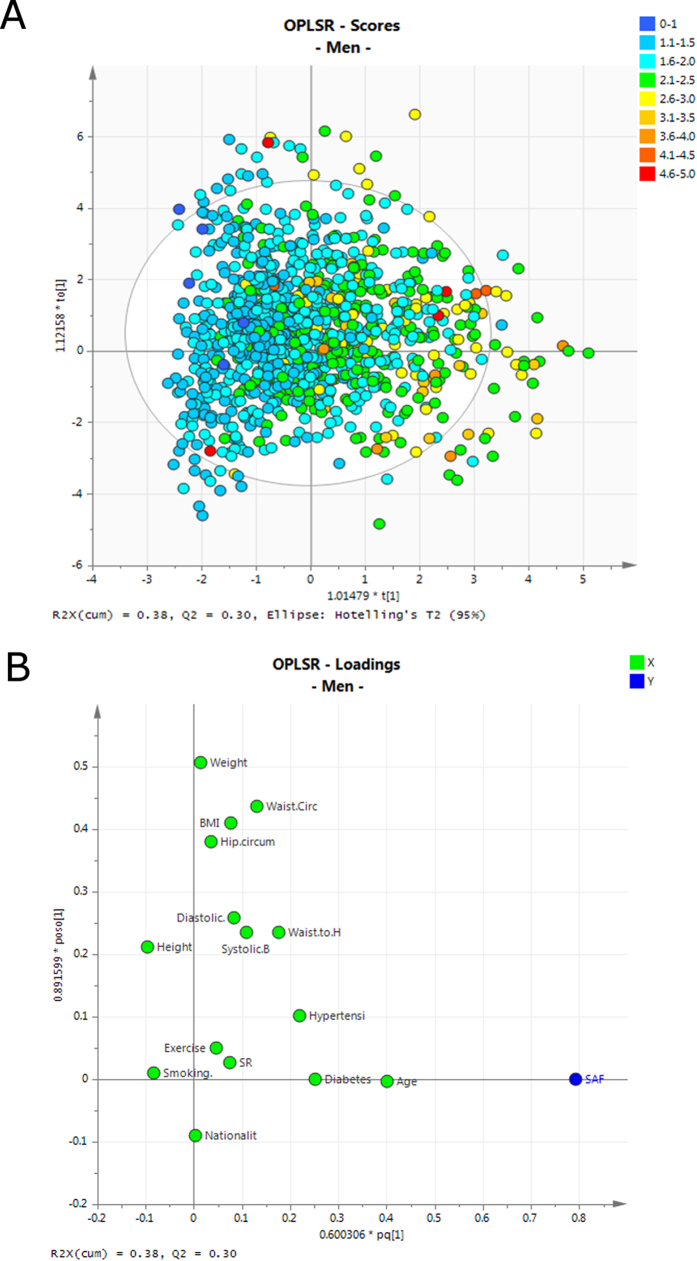
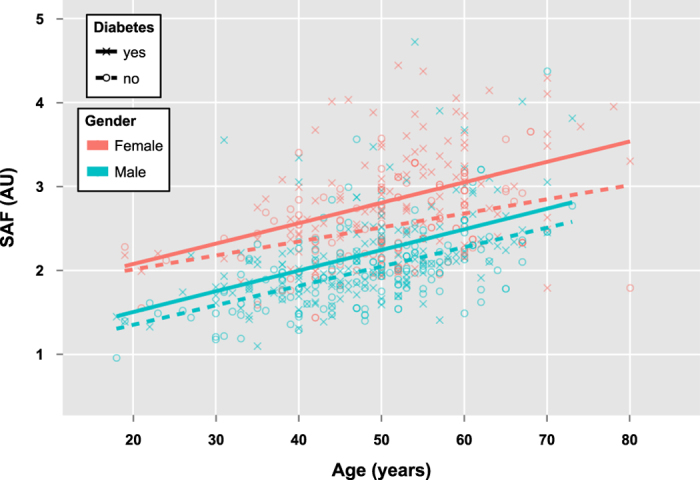
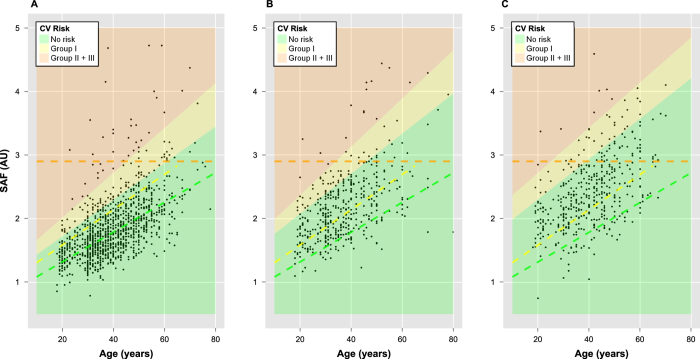
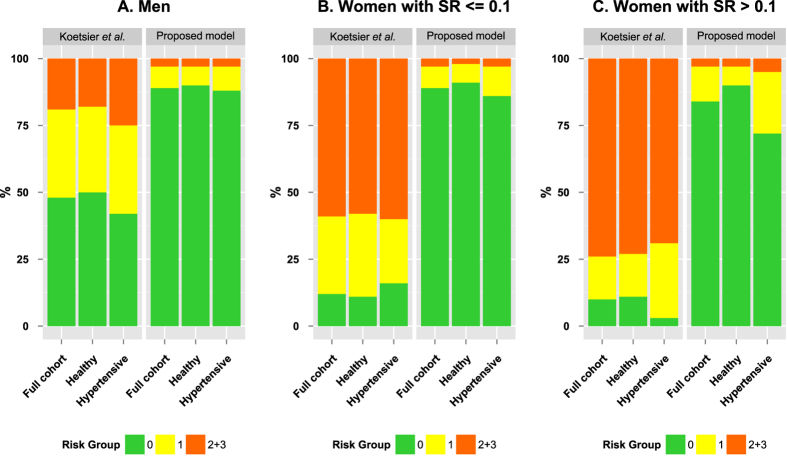
Advanced glycation endproducts (AGEs) are believed to play a significant role in the pathophysiology of a variety of diseases including diabetes and cardiovascular diseases. Non-invasive skin autofluorescence (SAF) measurement serves as a proxy for tissue accumulation of AGEs. We assessed reference SAF and skin reflectance (SR) values in a Saudi population (n = 1,999) and evaluated the existing risk stratification scale. The mean SAF of the study cohort was 2.06 (SD = 0.57) arbitrary units (AU), which is considerably higher than the values reported for other populations. We show a previously unreported and significant difference in SAF values between men and women, with median (range) values of 1.77 AU (0.79-4.84 AU) and 2.20 AU (0.75-4.59 AU) respectively (p-value « 0.01). Age, presence of diabetes and BMI were the most influential variables in determining SAF values in men, whilst in female participants, SR was also highly correlated with SAF. Diabetes, hypertension and obesity all showed strong association with SAF, particularly when gender differences were taken into account. We propose an adjusted, gender-specific disease risk stratification scheme for Middle Eastern populations. SAF is a potentially valuable clinical screening tool for cardiovascular risk assessment but risk scores should take gender and ethnicity into consideration for accurate diagnosis.
Figures
Similar articles
-
Advanced glycation end products (AGEs) estimated by skin autofluorescence are related with cardiovascular risk in renal transplant.PLoS One. 2018 Aug 1;13(8):e0201118. doi: 10.1371/journal.pone.0201118. eCollection 2018. PLoS One. 2018. PMID: 30067789 Free PMC article.
-
Lifestyle and clinical determinants of skin autofluorescence in a population-based cohort study.Eur J Clin Invest. 2016 May;46(5):481-90. doi: 10.1111/eci.12627. Epub 2016 Apr 15. Eur J Clin Invest. 2016. PMID: 27002914 Free PMC article.
-
Autofluorescence of Skin Advanced Glycation End Products: Marker of Metabolic Memory in Elderly Population.J Gerontol A Biol Sci Med Sci. 2015 Jul;70(7):841-6. doi: 10.1093/gerona/glu243. Epub 2015 Jan 14. J Gerontol A Biol Sci Med Sci. 2015. PMID: 25589479
-
Is the measurement of tissue advanced glycosylation products by skin autofluorescence associated with mortality in patients treated by peritoneal dialysis?J Nephrol. 2023 Jan;36(1):217-224. doi: 10.1007/s40620-022-01415-9. Epub 2022 Aug 18. J Nephrol. 2023. PMID: 35980536 Free PMC article. Review.
-
Skin Autofluorescence as a Potential Adjunctive Marker for Cardiovascular Risk Assessment in Type 2 Diabetes: A Systematic Review.Int J Mol Sci. 2024 Mar 31;25(7):3889. doi: 10.3390/ijms25073889. Int J Mol Sci. 2024. PMID: 38612699 Free PMC article. Review.
Cited by
-
Usefulness of Skin Autofluorescence as a Biomarker of Acute Oxidative Stress in Young Male Japanese Long-Distance Runners: A Cross-Sectional Study.Sports (Basel). 2022 Nov 16;10(11):180. doi: 10.3390/sports10110180. Sports (Basel). 2022. PMID: 36422949 Free PMC article.
-
Advanced Glycation End Product Accumulation in Subjects with Open-Angle Glaucoma with and without Exfoliation.Antioxidants (Basel). 2020 Aug 15;9(8):755. doi: 10.3390/antiox9080755. Antioxidants (Basel). 2020. PMID: 32824189 Free PMC article.
-
A Comparative Study on Skin and Plasma Advanced Glycation End Products and Their Associations with Arterial Stiffness.Pulse (Basel). 2017 Jan;4(4):208-218. doi: 10.1159/000453581. Epub 2016 Dec 21. Pulse (Basel). 2017. PMID: 28229055 Free PMC article.
-
Characterization of human cutaneous tissue autofluorescence: implications in topical drug delivery studies with fluorescence microscopy.Biomed Opt Express. 2018 Oct 12;9(11):5400-5418. doi: 10.1364/BOE.9.005400. eCollection 2018 Nov 1. Biomed Opt Express. 2018. PMID: 30460136 Free PMC article.
-
Skin intrinsic fluorescence scores are a predictor of all-cause mortality risk in type 1 diabetes: The Epidemiology of Diabetes Complications study.J Diabetes Complications. 2021 Feb;35(2):107770. doi: 10.1016/j.jdiacomp.2020.107770. Epub 2020 Oct 23. J Diabetes Complications. 2021. PMID: 33168396 Free PMC article.
References
-
- Schmidt A. M., Yan S. D., Wautier J. L. & Stern D. Activation of receptor for advanced glycation end products: a mechanism for chronic vascular dysfunction in diabetic vasculopathy and atherosclerosis. Circulation research 84, 489–497 (1999). - PubMed
MeSH terms
Substances
LinkOut - more resources
Full Text Sources
Other Literature Sources
Medical
Research Materials
