

Different Temporal Effects of Ebola Virus VP35 and VP24 Proteins on Global Gene Expression in Human Dendritic Cells
- PMID: 25972536
- PMCID: PMC4505630
- DOI: 10.1128/JVI.00924-15
Different Temporal Effects of Ebola Virus VP35 and VP24 Proteins on Global Gene Expression in Human Dendritic Cells
Abstract
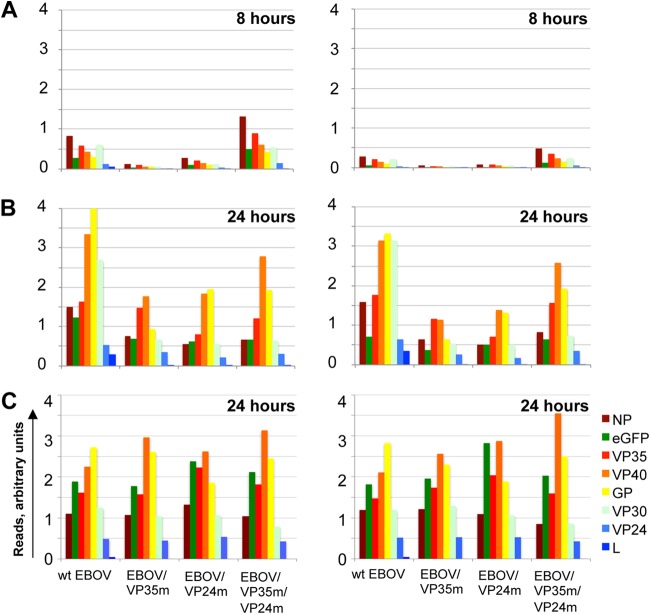
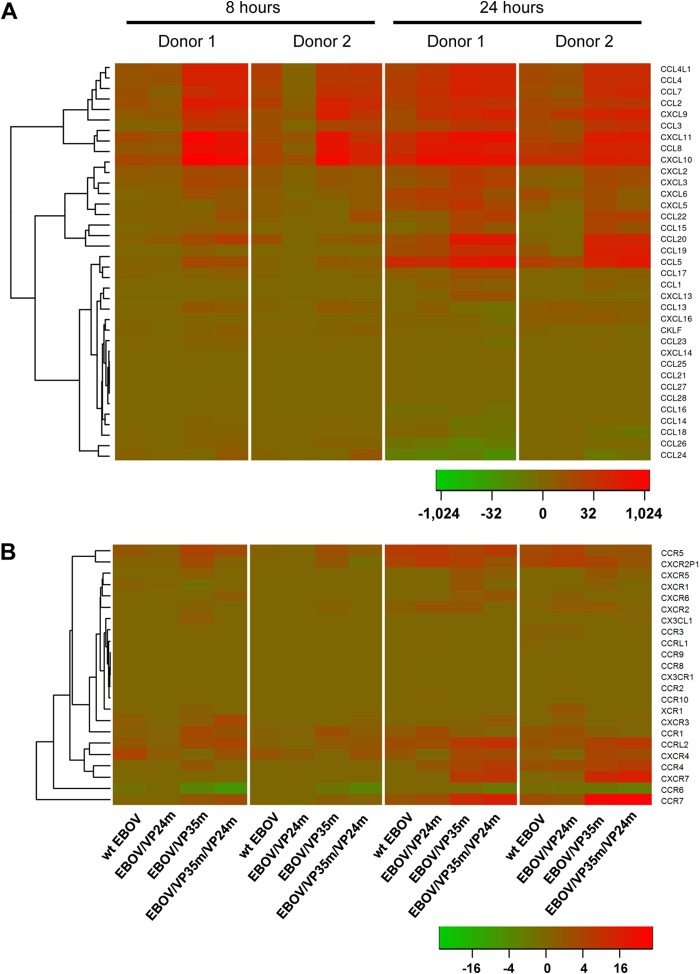
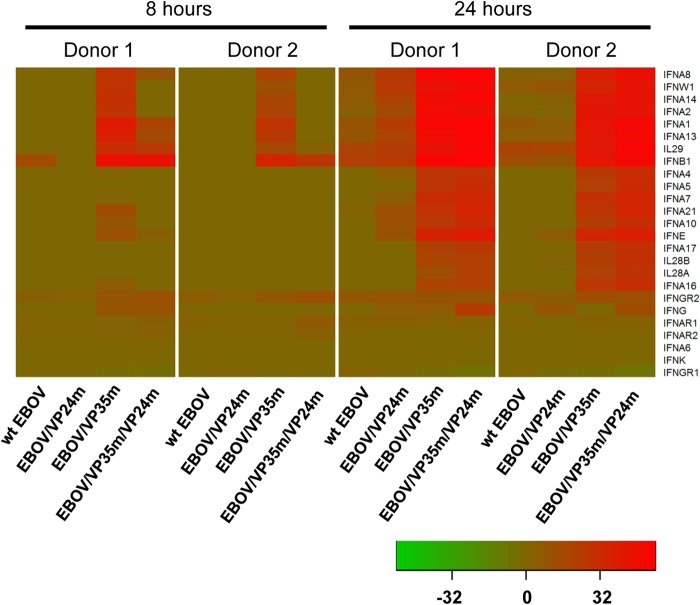
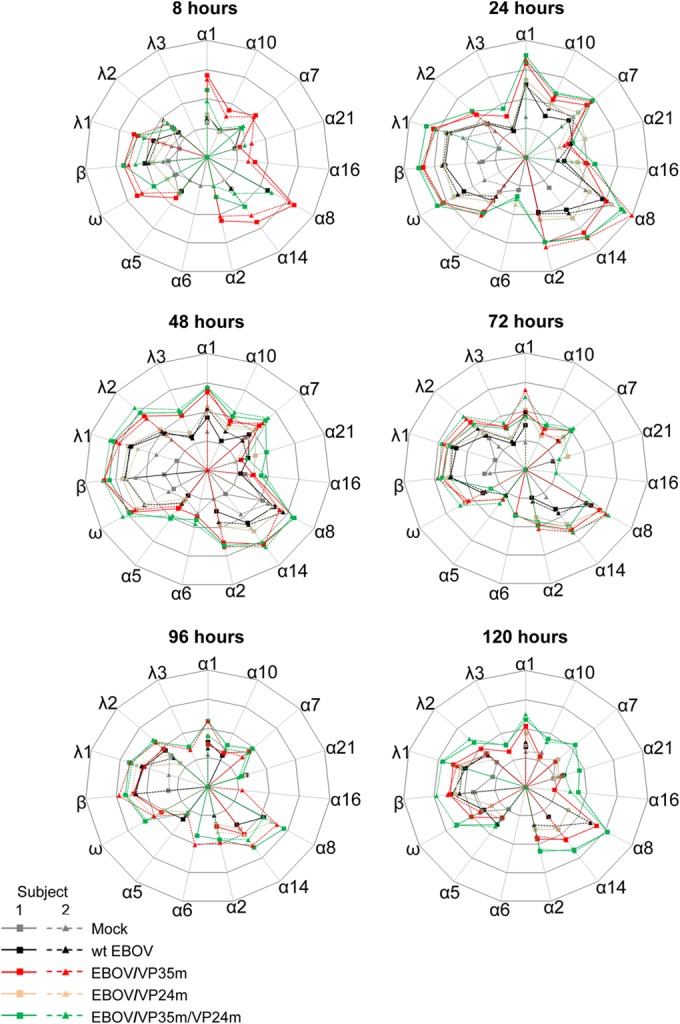
Ebola virus (EBOV) causes a severe hemorrhagic fever with a deficient immune response, lymphopenia, and lymphocyte apoptosis. Dendritic cells (DC), which trigger the adaptive response, do not mature despite EBOV infection. We recently demonstrated that DC maturation is unblocked by disabling the innate response antagonizing domains (IRADs) in EBOV VP35 and VP24 by the mutations R312A and K142A, respectively. Here we analyzed the effects of VP35 and VP24 with the IRADs disabled on global gene expression in human DC. Human monocyte-derived DC were infected by wild-type (wt) EBOV or EBOVs carrying the mutation in VP35 (EBOV/VP35m), VP24 (EBOV/VP24m), or both (EBOV/VP35m/VP24m). Global gene expression at 8 and 24 h was analyzed by deep sequencing, and the expression of interferon (IFN) subtypes up to 5 days postinfection was analyzed by quantitative reverse transcription-PCR (qRT-PCR). wt EBOV induced a weak global gene expression response, including markers of DC maturation, cytokines, chemokines, chemokine receptors, and multiple IFNs. The VP35 mutation unblocked the expression, resulting in a dramatic increase in expression of these transcripts at 8 and 24 h. Surprisingly, DC infected with EBOV/VP24m expressed lower levels of many of these transcripts at 8 h after infection, compared to wt EBOV. In contrast, at 24 h, expression of the transcripts increased in DC infected with any of the three mutants, compared to wt EBOV. Moreover, sets of genes affected by the two mutations only partially overlapped. Pathway analysis demonstrated that the VP35 mutation unblocked pathways involved in antigen processing and presentation and IFN signaling. These data suggest that EBOV IRADs have profound effects on the host adaptive immune response through massive transcriptional downregulation of DC.
Importance: This study shows that infection of DC with EBOV, but not its mutant forms with the VP35 IRAD and/or VP24 IRAD disabled, causes a global block in expression of host genes. The temporal effects of mutations disrupting the two IRADs differ, and the lists of affected genes only partially overlap such that VP35 and VP24 IRADs each have profound effects on antigen presentation by exposed DC. The global modulation of DC gene expression and the resulting lack of their maturation represent a major mechanism by which EBOV disables the T cell response and suggests that these suppressive pathways are a therapeutic target that may unleash the T cell responses during EBOV infection.
Copyright © 2015, American Society for Microbiology. All Rights Reserved.
Figures


Similar articles
-
The Ebola Interferon Inhibiting Domains Attenuate and Dysregulate Cell-Mediated Immune Responses.PLoS Pathog. 2016 Dec 8;12(12):e1006031. doi: 10.1371/journal.ppat.1006031. eCollection 2016 Dec. PLoS Pathog. 2016. PMID: 27930745 Free PMC article.
-
Effects of Filovirus Interferon Antagonists on Responses of Human Monocyte-Derived Dendritic Cells to RNA Virus Infection.J Virol. 2016 Apr 29;90(10):5108-5118. doi: 10.1128/JVI.00191-16. Print 2016 May 15. J Virol. 2016. PMID: 26962215 Free PMC article.
-
The lack of maturation of Ebola virus-infected dendritic cells results from the cooperative effect of at least two viral domains.J Virol. 2013 Jul;87(13):7471-85. doi: 10.1128/JVI.03316-12. Epub 2013 Apr 24. J Virol. 2013. PMID: 23616668 Free PMC article.
-
Evasion of interferon responses by Ebola and Marburg viruses.J Interferon Cytokine Res. 2009 Sep;29(9):511-20. doi: 10.1089/jir.2009.0076. J Interferon Cytokine Res. 2009. PMID: 19694547 Free PMC article. Review.
-
Insights into Ebola Virus VP35 and VP24 Interferon Inhibitory Functions and their Initial Exploitation as Drug Targets.Infect Disord Drug Targets. 2019;19(4):362-374. doi: 10.2174/1871526519666181123145540. Infect Disord Drug Targets. 2019. PMID: 30468131 Review.
Cited by
-
Early Transcriptional Changes within Liver, Adrenal Gland, and Lymphoid Tissues Significantly Contribute to Ebola Virus Pathogenesis in Cynomolgus Macaques.J Virol. 2020 May 18;94(11):e00250-20. doi: 10.1128/JVI.00250-20. Print 2020 May 18. J Virol. 2020. PMID: 32213610 Free PMC article.
-
Host Transcriptional Response to Ebola Virus Infection.Vaccines (Basel). 2017 Sep 20;5(3):30. doi: 10.3390/vaccines5030030. Vaccines (Basel). 2017. PMID: 28930167 Free PMC article. Review.
-
Rousette Bat Dendritic Cells Overcome Marburg Virus-Mediated Antiviral Responses by Upregulation of Interferon-Related Genes While Downregulating Proinflammatory Disease Mediators.mSphere. 2019 Dec 4;4(6):e00728-19. doi: 10.1128/mSphere.00728-19. mSphere. 2019. PMID: 31801842 Free PMC article.
-
Investigating the Cellular Transcriptomic Response Induced by the Makona Variant of Ebola Virus in Differentiated THP-1 Cells.Viruses. 2019 Nov 4;11(11):1023. doi: 10.3390/v11111023. Viruses. 2019. PMID: 31689981 Free PMC article.
-
Ebola virus glycoprotein directly triggers T lymphocyte death despite of the lack of infection.PLoS Pathog. 2017 May 22;13(5):e1006397. doi: 10.1371/journal.ppat.1006397. eCollection 2017 May. PLoS Pathog. 2017. PMID: 28542576 Free PMC article.
References
-
- Kuhn JH. 2008. Filoviruses: a compendium of 40 years of epidemiological, clinical, and laboratory studies, 1st ed Springer, New York, NY. - PubMed
-
- Kuhn JH, Bao Y, Bavari S, Becker S, Bradfute S, Brister JR, Bukreyev AA, Chandran K, Davey RA, Dolnik O, Dye JM, Enterlein S, Hensley LE, Honko AN, Jahrling PB, Johnson KM, Kobinger G, Leroy EM, Lever MS, Muhlberger E, Netesov SV, Olinger GG, Palacios G, Patterson JL, Paweska JT, Pitt L, Radoshitzky SR, Saphire EO, Smither SJ, Swanepoel R, Towner JS, van der Groen G, Volchkov VE, Wahl-Jensen V, Warren TK, Weidmann M, Nichol ST. 2013. Virus nomenclature below the species level: a standardized nomenclature for natural variants of viruses assigned to the family Filoviridae. Arch Virol 158:301–311. doi:10.1007/s00705-012-1454-0. - DOI - PMC - PubMed
-
- Albarino CG, Shoemaker T, Khristova ML, Wamala JF, Muyembe JJ, Balinandi S, Tumusiime A, Campbell S, Cannon D, Gibbons A, Bergeron E, Bird B, Dodd K, Spiropoulou C, Erickson BR, Guerrero L, Knust B, Nichol ST, Rollin PE, Stroher U. 2013. Genomic analysis of filoviruses associated with four viral hemorrhagic fever outbreaks in Uganda and the Democratic Republic of the Congo in 2012. Virology 442:97–100. doi:10.1016/j.virol.2013.04.014. - DOI - PMC - PubMed
-
- Baize S, Pannetier D, Oestereich L, Rieger T, Koivogui L, Magassouba N, Soropogui B, Sow MS, Keita S, De Clerck H, Tiffany A, Dominguez G, Loua M, Traore A, Kolie M, Malano ER, Heleze E, Bocquin A, Mely S, Raoul H, Caro V, Cadar D, Gabriel M, Pahlmann M, Tappe D, Schmidt-Chanasit J, Impouma B, Diallo AK, Formenty P, Van Herp M, Gunther S. 2014. Emergence of Zaire Ebola virus disease in Guinea. N Engl J Med 371:1418–1425. doi:10.1056/NEJMoa1404505. - DOI - PubMed
-
- CDC. 2015, posting date Outbreak of Ebola in Guinea, Liberia, and Sierra Leone. http://www.cdc.gov/vhf/ebola/outbreaks/guinea/.
Publication types
MeSH terms
Substances
Grants and funding
LinkOut - more resources
Full Text Sources
Medical
Molecular Biology Databases
