. 2015 Jun 1;212(6):905-25.
doi: 10.1084/jem.20141268. Epub 2015 May 11.

An acidic microenvironment sets the humoral pattern recognition molecule PTX3 in a tissue repair mode

Affiliations

An acidic microenvironment sets the humoral pattern recognition molecule PTX3 in a tissue repair mode

Andrea Doni et al. J Exp Med. .

Abstract

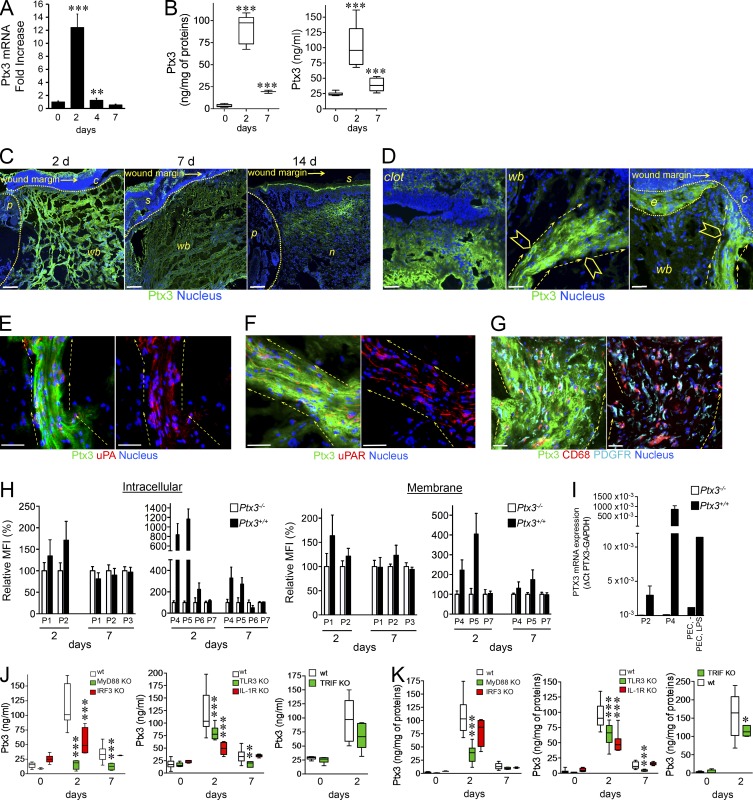
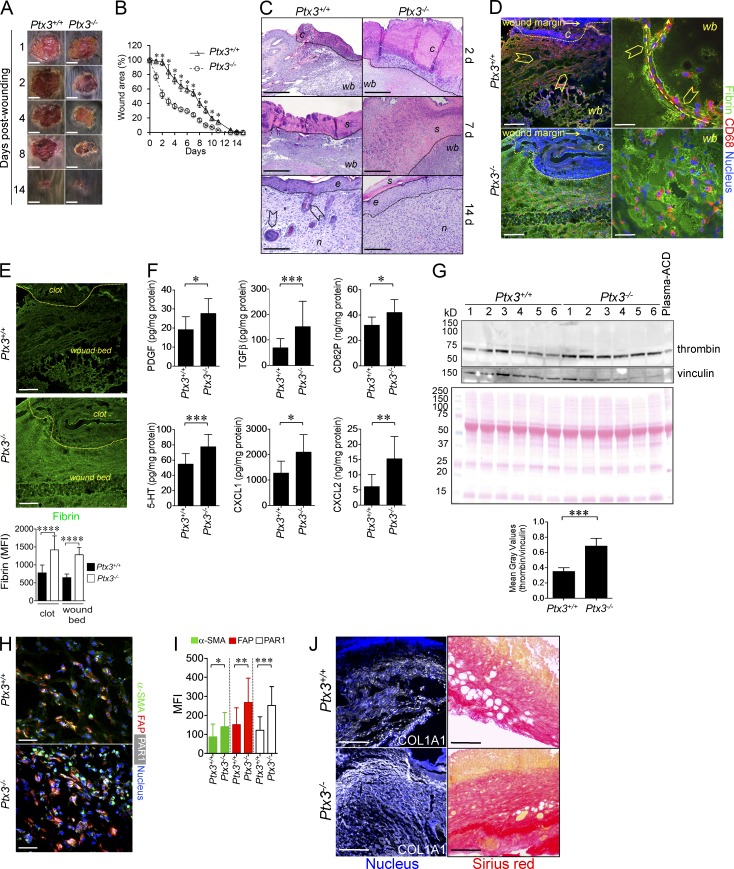
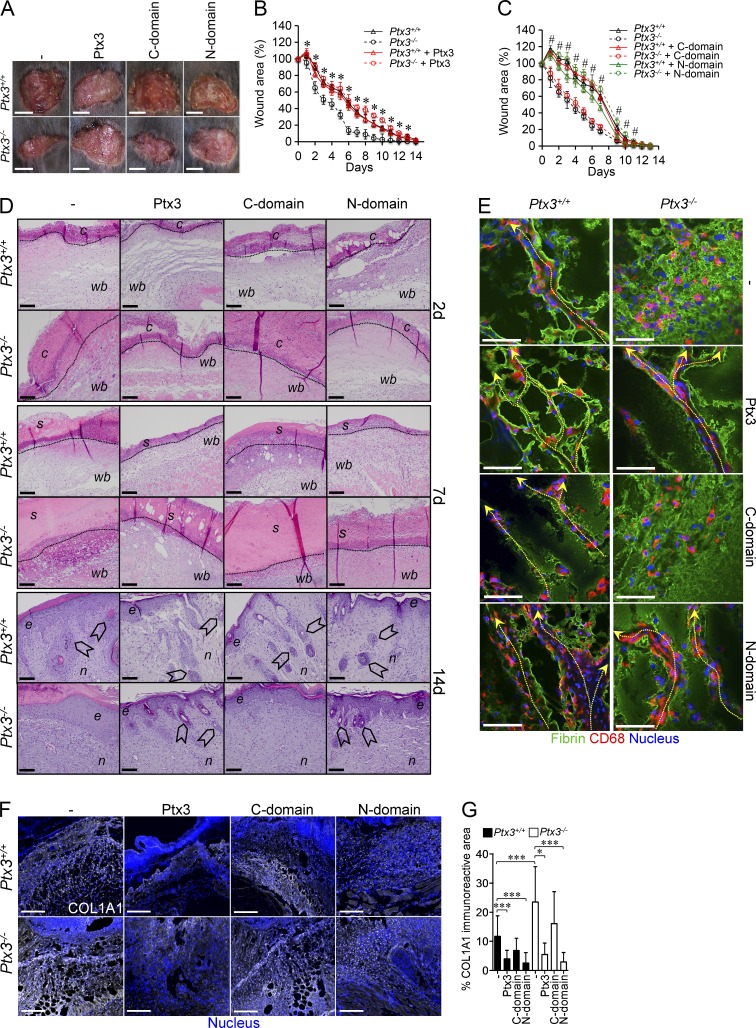
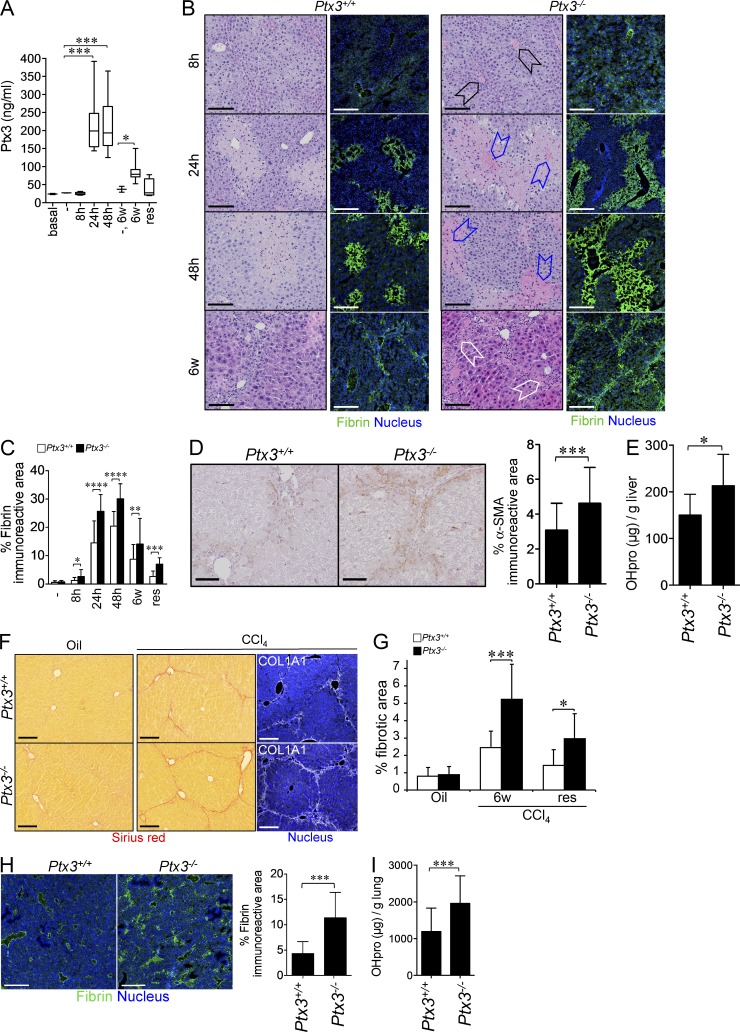
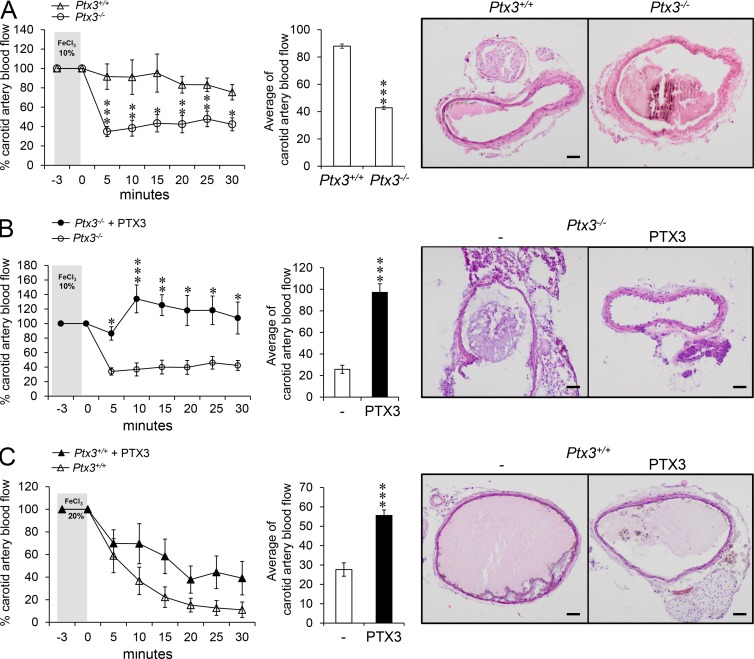
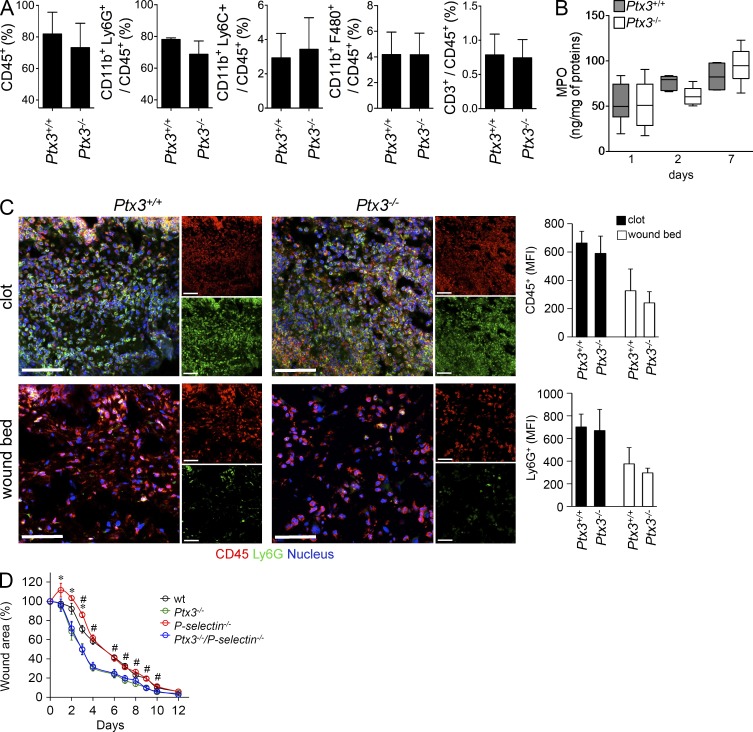
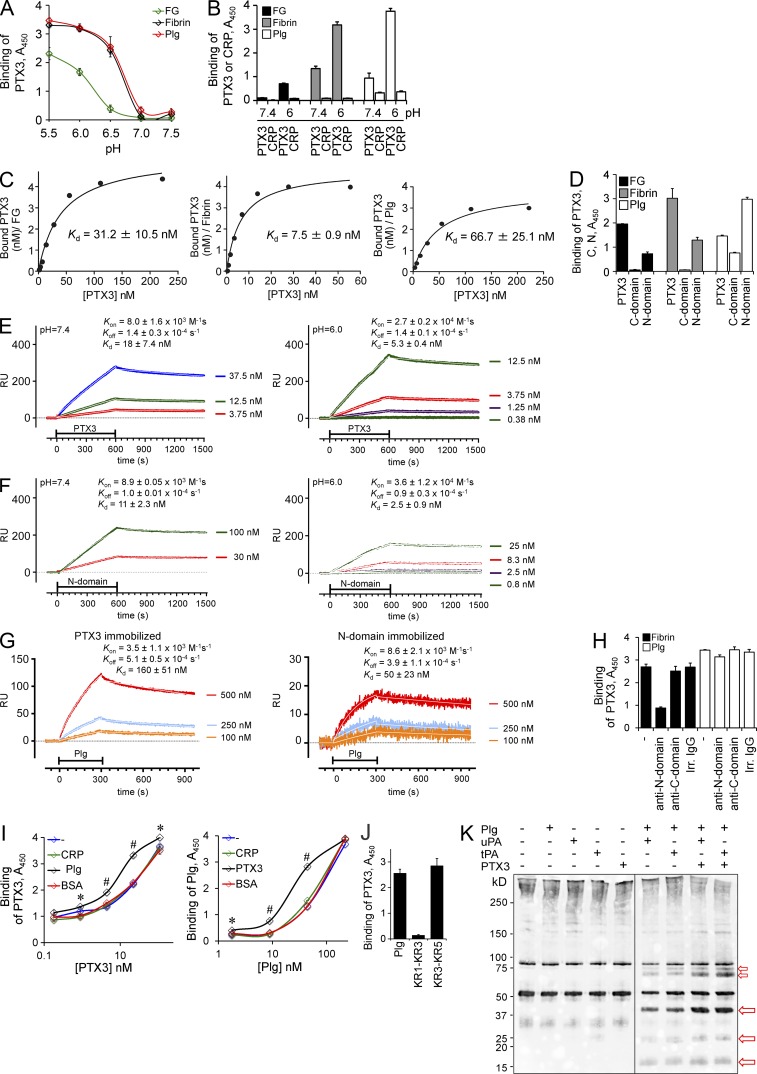
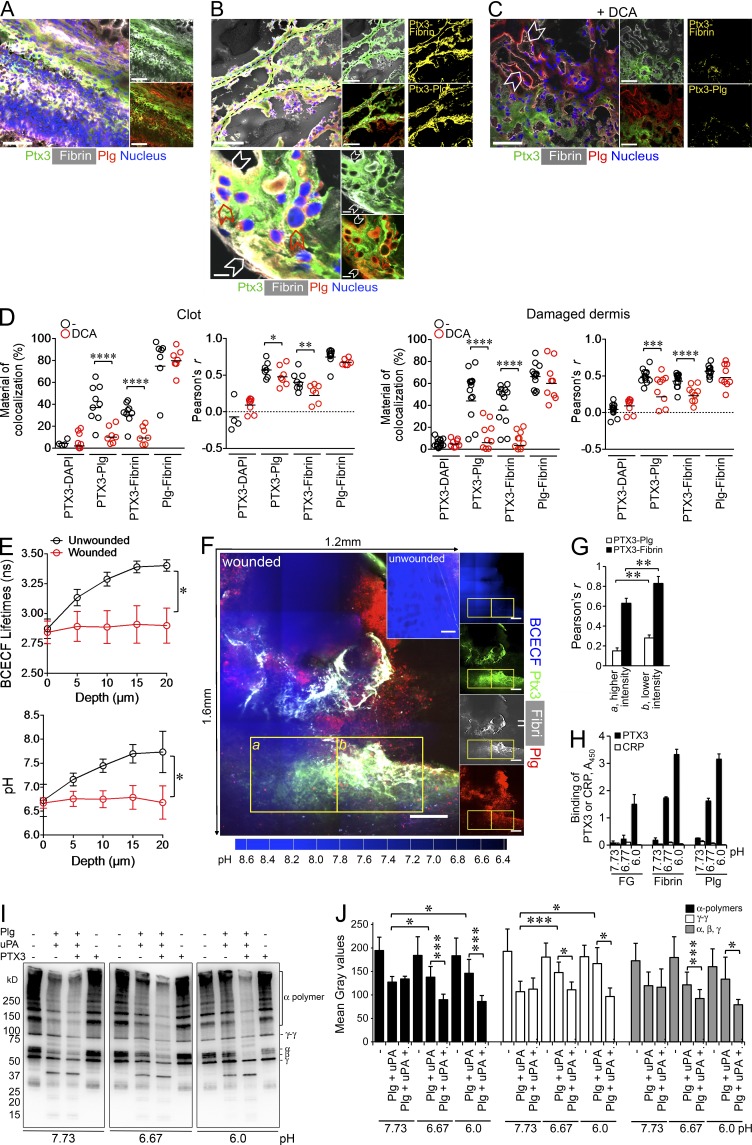
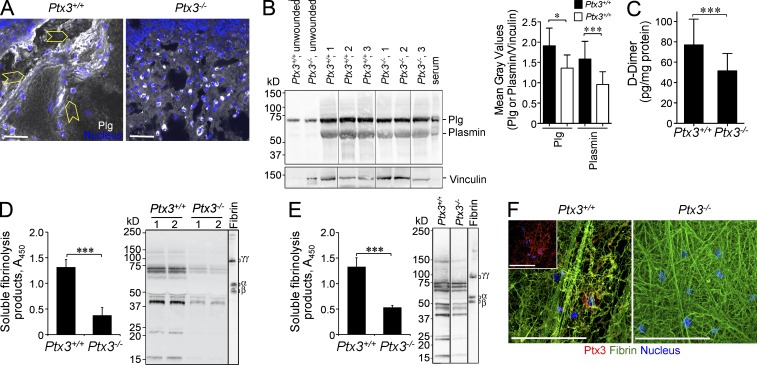
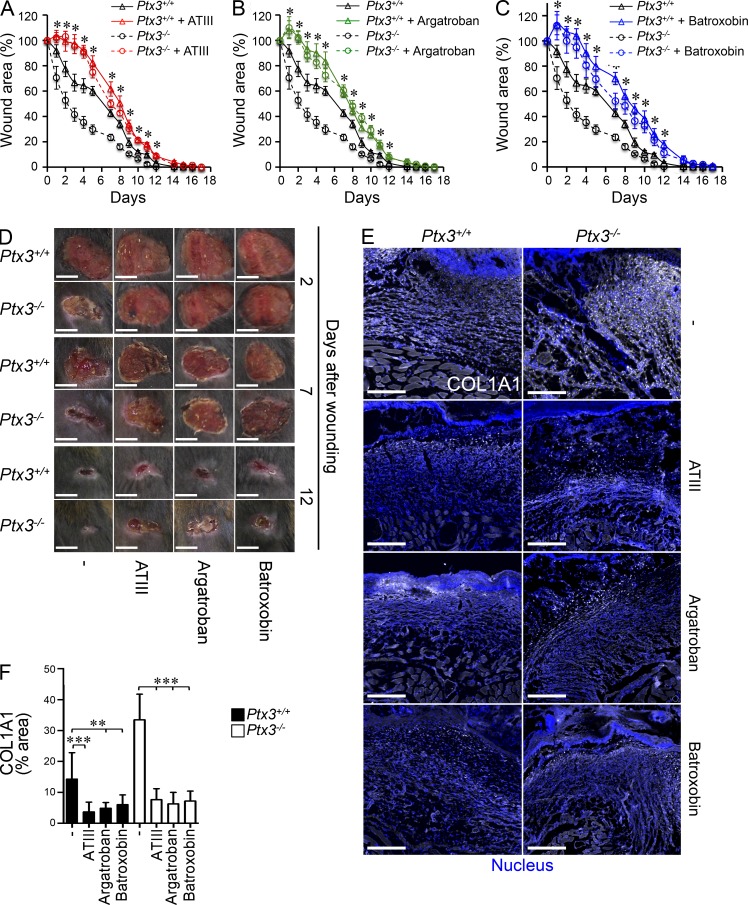
Pentraxin 3 (PTX3) is a fluid-phase pattern recognition molecule and a key component of the humoral arm of innate immunity. In four different models of tissue damage in mice, PTX3 deficiency was associated with increased fibrin deposition and persistence, and thicker clots, followed by increased collagen deposition, when compared with controls. Ptx3-deficient macrophages showed defective pericellular fibrinolysis in vitro. PTX3-bound fibrinogen/fibrin and plasminogen at acidic pH and increased plasmin-mediated fibrinolysis. The second exon-encoded N-terminal domain of PTX3 recapitulated the activity of the intact molecule. Thus, a prototypic component of humoral innate immunity, PTX3, plays a nonredundant role in the orchestration of tissue repair and remodeling. Tissue acidification resulting from metabolic adaptation during tissue repair sets PTX3 in a tissue remodeling and repair mode, suggesting that matrix and microbial recognition are common, ancestral features of the humoral arm of innate immunity.


Figures

Figure 1.
Figure 1.
PTX3 is induced after skin wounding. A skin punch wound was generated on the back of mice. PTX3 mRNA expression was assessed by RT-PCR (A) and PTX3 local content and plasma levels (B) were measured after wounding in mice. (A) One representative experiment in triplicate (n = 3 independent mice/group) out of 2 is shown. (B) n = 9–11 independent mice. (C) Localization of PTX3 after skin wounding was assessed by confocal microscopy. Representative images are shown (n = 39 mice). C, clot; p, perilesion area; wb, wound bed; s, scab; n, neo-formed tissue. The analysis was performed at day 2, 7, and 14 after wounding. Bars, 100 µm. (D) Magnification images (40×) of PTX3 localization shown in C (10×) for clot (left) and damaged dermis (middle and right) 2 d after wounding. C, clot; wb, wound bed; e, epithelial outgrowth. Arrowheads denote cells invading the damaged dermis (middle) and the clot (right); dashed arrows show directionality of invading cells. Bar, 10 µm. (E–G) Cell populations (UPA+ [E], UPAR+ [F], PDGFR+, and CD68+ [G] cells) associated with PTX3 staining (green) were assessed by confocal microscopy (day 2 after wounding). Representative merged images (left) and indicated cell markers (red or cyan for PDGFR) with nucleus (blue; right) are shown. Dashed arrows show directionality of invading cells directed toward the wound bed. Bars, 10 µm. (E and F) n = 6 mice; (G) n = 11 mice. (H) Flow cytometry analysis of intracellular and membrane staining of PTX3 in leukocyte and stromal cell populations at 2 and 7 d after wounding of Ptx3+/+ and Ptx3−/− mice. P1, CD45+CD11b+Ly6G+; P2, CD45+CD11b+ Ly6C+ F4/80; P3, CD45+CD11bCD3+; P4, CD45PDGFR+; P5, CD45PDGFR+FAP+; P6, CD45α-SMA+; P7, CD45C31+. Values are expressed as relative percentage of MFI ± SD of Ptx3+/+ cells (filled bars) compared with Ptx3−/− cells (open bars) used as a negative control. Data referring to P3 on day 2 after injury are not reported because of the low number of events acquired. Ptx3+/+ (n = 7 independent mice), Ptx3−/− (n = 6 independent mice). (I) PTX3 mRNA expression was assessed in sorted macrophages (P2, CD45+ CD11b+ Ly6C+ F4/80) and mesenchymal cells (P4, CD45 PDGFR+) 2 d after wounding by quantitative RT-PCR. Results are presented as absolute values. Analysis of five Ptx3+/+ and four Ptx3−/− independent mice was performed in triplicate. Peritoneal elicited cells (PEC), untreated or treated with LPS (10 ng/ml; 4 h), were used as control. (J and K) PTX3 plasma levels (J) and wound content (K) were measured in WT (n = 11–14) and MyD88- (n = 6), IRF3- (n = 6), TLR3- (n = 8), IL-1R1- (n = 6) and TRIF-deficient (n = 6–7) independent mice. Graphs show the mean ± SD (A, H, and I) or box plots (B, J, and K). *, P < 0.05; **, P < 0.01; and ***, P < 0.005 versus day 0 (A and B), or WT at the same time point (J and K; Mann-Whitney test).
Figure 2.
Figure 2.
Skin repair is altered in PTX3-deficient mice. The skin wound healing model was used. (A) Representative macroscopic images of WT and Ptx3−/− skin wounds are shown at the indicated days after wounding. Bars, 5 mm. (B) Kinetic analysis of skin excisional wound areas was performed. Values represent mean ± SEM. *, P < 0.01 (Student’s t test). One representative experiment (n = 10 mice/group) out of 15 is shown. (C) Representative histological images (H&E) of wound healing are shown for Ptx3+/+ and Ptx3−/− mice at the indicated days after wounding. C, clot; wb, wound bed; s, scab; e, epithelialization; n, neo-formed tissue; arrowheads, hair follicles. Bars, 200 µm (2d, 7d) and 50 µm (14d). n = 8 mice. (D) Fibrin deposition and CD68+ invading cells in WT and Ptx3−/− wounds on day 2 were assessed by immunofluorescence confocal microscopy. Arrowheads: aligned CD68+ cells migrating toward the wound bed; right, dashed arrows: passages formed within the fibrin-rich wound site and directionality of invading CD68+ cells. C, clot; wb, wound bed. Representative images (n = 11 WT; n = 14 Ptx3−/− mice) are shown. Bars, 100 µm (left) and 10 µm (right). (E, left) Single fluorescence confocal microscopy images of fibrin (shown in D) are presented for Ptx3+/+ and Ptx3−/− wounds on day 2. Bars, 100 µm. (right) fibrin staining quantification in the clot or in the wound bed is shown. Data are presented as mean ± SD; n = 2–3 10X images/mouse, 5 mice/group. ****, P < 0.0001, (Mann-Whitney test). (F) PDGF, TGFβ, CD62P, serotonin (5HT), CXCL1, and CXCL2 protein levels from WT and PTX3-deficient wound lysates after skin injury (day 1) were assessed by ELISA. Graphs show the mean ± SD. *, P < 0.05, **, P < 0.01 and ***, P < 0.005 versus WT (Mann-Whitney test); n = 8–10 independent mice/group. (G, top) Western blot analysis of thrombin in WT and PTX3-deficient wound lysates (day 1) was performed. Proteins, 20 µg/lane; mouse plasma-ACD, 1 µl/lane. Vinculin (middle) used as loading control and Ponceau red (bottom) staining are also shown. (bottom) Results are expressed as mean ± SD gray values of thrombin/vinculin. (n = 6 mice/group). ***, P < 0.005 (Mann-Whitney test). (H and I) Representative confocal microscopy immunofluorescence staining images (left) and quantification (right) of α-SMA (green), FAP (red) and PAR1 (white) in WT and PTX3-deficient wounds are shown. *, P < 0.05, **, P < 0.01 and ***, P < 0.005 versus WT (Student’s t test); n = 3–4 20X images/mouse, (n = 4–7 mice/group). (J) Collagen I (COL1A1) and Sirius red staining in the wounds at day 7. Representative images are shown (n = 5 mice). Bars, 100 µm.
Figure 3.
Figure 3.
Alterations in skin wounding are rescued by exogenous PTX3. (A–C) After skin wounding in Ptx3+/+ and Ptx3−/− mice, the effect of recombinant PTX3 (A and B) and its N- or C-terminal domains (N or C domain; A and C) on wounded skin area was assessed. (A) Representative macroscopic images of skin wounds were obtained at day 2. Bars, 5 mm. (B and C) Kinetic analysis of skin excisional wound areas was performed. (B) *, P < 0.01, Ptx3−/− treated with PTX3 versus Ptx3−/− (Student’s t test). One representative experiment (n = 10–12 mice/group) out of 2 is shown. (C) #, P < 0.005, Ptx3−/− treated with the N-domain versus Ptx3−/− (Student’s t test). One representative experiment (n = 8–10 mice/group) out of 3 is shown. (D)The effect of treatment with PTX3 and its N- and C-terminal domains on wound healing was evaluated by histological (H&E) staining at the indicated days in WT versus Ptx3−/− mice. C, clot; wb, wound bed; s, scab; e, epithelialization; n, neo-formed tissue; arrowheads, hair follicles. Bars: (2 d and 7 d) 100 µm; (14 d) 20 µm. Representative images are shown (n = 4 mice). (E) Fibrin deposition and CD68+ invading cells in WT and Ptx3−/− wounds after treatment with PTX3 and N-terminal and C-terminal domains (day 2) was assessed by immunofluorescence staining. Representative confocal microscopy images are shown (n = 5–7 mice). Dashed arrows shows passages within the fibrin matrix in wound site created by CD68+ cells and direction of invasion toward the wound bed. Bars, 10 µm. (F and G) The effect of PTX3 or domain administration on Collagen I (COL1A1) deposition was assessed in the wounds at day 7 by immunofluorescence staining. (F) Bars, 100 µm. Representative confocal microscopy images are shown. G, quantification of COL1A1 deposition is shown from F. Results are mean percentage and SD (n = 2–3 10× images/mouse, 4–9 mice/group). *, P < 0.05; ***, P < 0.005 (Mann-Whitney test).
Figure 4.
Figure 4.
Liver and lung repair is altered in PTX3-deficient mice. Liver and lung injury were induced as described in Materials and methods. (A) PTX3 plasma levels after acute (8-48 h) and chronic (6 wk) CCl4 treatment, or at resolution of fibrosis were measured. -, treatment with mineral oil as vehicle. Graphs are presented as box plots. *, P < 0.05; ***, P < 0.005 (Mann-Whitney test); (n = 5–9 independent mice). (B) Representative hematoxylin-eosin and immunofluorescence confocal microscopy images of fibrin in liver sections of WT and Ptx3−/− mice are shown. Black arrowheads, centrolobular vein thrombi; blue and white arrowheads, deposits of eosinophilic material-fibrin in necroinflammatory areas (blue) at lobular spaces (24 and 48 h) and in the portal tracts (white) after chronic injury. Bars, 100 µm. (C) Quantification of fibrin staining in the liver was performed on samples from B. Mean ± SD; (B and C) n = 3–8 20× images/mouse, 4–6 mice/group. *, P < 0.05; **, P < 0.005; ***, P < 0.001; ****, P < 0.0001 (Mann-Whitney test). (D) Representative immunohistochemistry images for α-SMA (left) and quantification of the immunoreactive areas (right) are shown for WT and Ptx3−/− mice. Results are mean ± SD. ***, P < 0.005 (Student’s t test); n = 7–10). 20× images from 4 mice. (E) Collagen deposition in WT and Ptx3−/− mice was assessed after chronic injury and measured as liver OH-proline (OHpro) content. (n = 9 WT and n = 10 Ptx3−/− independent mice). Results are mean ± SD. *, P < 0.05 (Student’s t test). (F) Representative microscopy images for Sirius red and COL1A1 staining in portal septa are shown. Bars, 100 µm. (G) Quantification of liver Sirius red staining at 6 wk and in the resolution phase (res) in WT and Ptx3−/− mice after CCl4 injection from F. Results are presented as the mean percentage fibrotic area ± SD (n = 5–7 mice). *, P < 0.05; ***, P < 0.005 (Student’s t test). (H) Fibrin deposition in Ptx3−/− and WT lungs was assessed using immunofluorescence staining 7 d after injury. Representative confocal microscopy images are shown (left) and fibrin staining quantification is presented (right). Bars, 100 µm. Mean ± SD; n = 3–5 10× images/mouse, 3 mice/group. ***, P < 0.0001 (Mann-Whitney test). (I) OH-proline (OHpro) content was measured in Ptx3−/− and WT lungs, 30 d after injury. ***, P < 0.005 (Student’s t test). n = 17 WT and 29 Ptx3−/− independent mice.
Figure 5.
Figure 5.
The thrombotic response is increased in PTX3-deficient mice. A model of FeCl3-induced arterial injury was used. (A) Induction of arterial thrombosis in WT and Ptx3−/− mice was assessed after topical application of FeCl3 (10%). (B and C) The effects of PTX3 on thrombus formation in Ptx3−/− (FeCl3 10% [B]) and WT (FeCl3 20% [C]) mice were also assessed. (A–C) Left panel shows carotid artery blood flow expressed as relative percentage compared with the value before injury. Middle panels show the average of carotid artery blood flow measured in the observation period (3–30 min). Results are presented as mean percentage ± SEM. A, (n = 11 WT and 17 Ptx3−/− mice); B, (n = 4 WT and 4 Ptx3−/− mice); C, (n = 8 WT and 9 Ptx3−/− mice). (A–C) *, P < 0.05; **, P < 0.01; ***, P < 0.005 (Student’s t test). (A–C, right) Representative histological H&E microscopy images of carotid arterial thrombi. Bars, 100 µm.
Figure 6.
Figure 6.
Total leukocyte infiltration was not impaired in Ptx3−/− skin wound. Skin wounding was performed. (A) An analysis of leukocytes infiltrating the wound site (day 1) by cell flow cytometry was performed for Ptx3+/+ and Ptx3−/− mice. Quantification histograms are shown for the indicated cell populations. Results are presented as mean percentage ± SD; n = 4 independent mice each. (B) MPO content was measured in the course of wound healing at days 1, 2, 7. n = 8–10, day 1; n = 10 and 11, day 2; n = 6 and 8, day 7, WT and Ptx3−/− independent mice, respectively. (C) Representative immunofluorescence confocal microscopy images of CD45+ and Ly6G+ staining in the clot and damaged dermis 2 d after injury are shown. (left) Merged or single confocal images are shown (CD45, red; Ly6G, green; nucleus, blue). Bars, 50 µm. (right) MFI quantification in the entire field of view is shown. Data are presented as mean ± SD; (n = 5–7 mice; 4–12 images per mouse were analyzed). (D) A kinetic analysis of skin excisional wound areas in WT, Ptx3-, P-selectin-, and P-selectinPtx3–deficient mice was performed. Values represent mean ± SEM of one representative experiment out of two (n = 7–9 mice/group). #, P < 0.05, P-selectin−/−/Ptx3−/− compared with P-selectin −/− mice and *, P < 0.05, P-selectin −/− compared with WT (Student’s t test).
Figure 7.
Figure 7.
PTX3 interacts with fibrinogen, fibrin, and plasminogen. (A–D) A microtiter binding assay was performed to assess the interaction between PTX3 or CRP to fibrinogen (FG), fibrin, and plasminogen (Plg) in vitro. (A) The binding of PTX3 (22 nM) to FG, fibrin, and Plg at different pHs was assessed. Results are expressed as mean ± SD. One representative experiment in triplicate out of 5 is shown. (B) The binding of PTX3 and CRP to FG, fibrin, and Plg at pH 7.4 or 6.0 was also assessed. One representative experiment in triplicate out of three is shown. (C) Fitting analysis of biotinylated (b-) PTX3-FG–fibrin–Plg interactions. Mean values of 6 (FG and Fibrin) or 3 (Plg) experiments are shown. (D) Binding of b-PTX3 and b-C-terminal or b-N-terminal domains (4.4 nM) to FG, fibrin, Plg at pH 6.0 was assessed. One representative experiment in triplicate out of seven is shown. (E–G) Surface plasmon resonance (SPR) sensorgrams were obtained by injecting different concentrations of PTX3 (E) or PTX3 N-terminal domain (F) over immobilized Plg. (G) SPR analysis was performed at pH 6.0 flowing monomeric Plg onto immobilized PTX3 or N-terminal domain. (E–G) One representative experiment out of two is shown. (H–J) Microtiter binding assays were performed to define which PTX3 domain and plasminogen fragment are involved in the interaction. (H) PTX3 binding to fibrin and Plg in the presence of antibodies anti–N-terminal (MNB4) or anti–C-terminal (MNB5) domains or irrelevant IgG was assessed as shown. One representative experiment in triplicate out of three is shown. (I) The binding of PTX3 (top) or Plg (bottom) to fibrin in the presence of Plg or PTX3, respectively, and of CRP and BSA used as controls, at pH 6.0 was assessed as shown. One representative experiment in triplicate out of two is shown. *, P < 0.05; #, P < 0.001. Values are mean ± SD. (J) The binding of PTX3 to Plg fragments, at pH 6.0 was assessed as shown. One representative experiment in triplicate out of 4 is shown. (K) Western blot analysis of fibrin clots prepared by mixing FG and thrombin, digested at pH 6.0 by recombinant purified proteins in cell-free conditions, was performed. Red arrows indicate the presence of main products of fibrinolysis. One representative experiment out of five is shown.
Figure 8.
Figure 8.
The interaction of PTX3 with fibrin and plasminogen occurs in vivo. Skin wounding was performed in untreated WT mice (A and B) or upon treatment with DCA (C). (A–C) Colocalization of PTX3, fibrin, and Plg in clot (A) and damaged dermis (B and C) of wounded skin at day 2 were assessed. (A–C, left) Representative immunofluorescence confocal microscopy merged images of PTX3 (green), fibrin (white), Plg (red), and nucleus (blue). (A, right; B and C, middle) Representative merged images of PTX3 (green) and fibrin (white), or of PTX3 (green) and Plg (red). (B and C, right) Images of colocalization signal (yellow) of PTX3 with fibrin (PTX3-Fibrin) or plasminogen (PTX3-Plg). (B, top) Passages created by invading cells within fibrin rich-wound sites (dashed black arrows); (bottom) magnification image of PTX3 colocalization with fibrin and Plg at the pericellular matrix of cells invading the wound bed (white arrowheads) and with Plg+ invading cells (red arrowheads). Bars: (A, B [top], and C) 50 µm and (B, bottom) 5 µm. (C) The inhibition of colocalization after treatment with DCA was assessed 2 d after wounding. Representative confocal microscopy images are shown. White arrowheads denote colocalization between Plg and fibrin matrix. (A–C) n = 4–9 images/mouse, 4 mice/group. (D) Colocalization in the clot (left) and in the damaged dermis (right) of wounded skins (day 2) was quantified upon treatment with DCA (from samples in A–C and not depicted). The percentage of colocalized PTX3 with fibrin or plasminogen, and fibrin with plasminogen (top), and the relative Pearson’s coefficient (bottom) are shown. Each circle represents analysis from a single confocal image (2–3 fields of vision/mouse, n = 3–4 mice). *, P < 0.05; **, P < 0.01; ***, P < 0.005; ****, P < 0.0005; (Mann-Whitney test). (E) Measurement of pH in the skin was assessed by two-photon microscopy in unwounded skin and at the periphery of the wound. The data represent mean ± SEM. BCECF lifetime and pH as a function of depth. (n = 5 mice/group). *, P < 0.05 (Student’s t test). (F) Representative two-photon microscopy images from D are shown. A tiling presentation of images showing the colocalization of PTX3, fibrin and Plg in areas of acidic pH (blue, lower intensity) at the wound site is presented (left). Inset, unwounded skin, control. Single fluorescence images are presented (right). Images are composite maximum intensity projections in the proximity of damaged dermis. Bars, 200 µm. Representative images from one mouse out of 10 WT mice analyzed are shown. (G) Colocalization analysis (Pearson’s coefficient) was measured for PTX3-Plg and PTX3-fibrin in insets a (blue higher intensity, higher pH) and b (blue lower intensity, lower pH) of panel F of PTX3 with fibrin or plasminogen. Data are presented as mean ± SD of 14 slices (10 µm) in the z axis. (H) The binding of PTX3 (22 nM) and CRP (22 nM) to FG, fibrin, and Plg was assessed at pH 7.73, 6.7,7 and 6.0 by microtiter binding assay. Data are presented as mean ± SD of one representative experiment in triplicate out of 2. (I and J) Western blot analysis (I) and quantification (J) of fibrin clots digested at pH 7.73, 6.77, and 6.0 by recombinant purified proteins in cell-free conditions was performed. I, On the right, α polymers, γ dimers and α, β, and γ subunits are shown. One representative experiment out of four is shown. (J) Results are expressed as mean ± SD. Gray intensity values in bands of α polymers, γ dimers and α, β, and γ subunits from four Western blots performed are shown.
Figure 9.
Figure 9.
The interaction of PTX3 with fibrin and plasminogen is functionally relevant. Skin wounding was performed in Ptx3+/+ and Ptx3−/− mice. Representative confocal microscopy images (A) and Western blot analysis (B) of Plg/plasmin (white) at day 2 after skin wounding are shown. (A) Plg/plasmin (white) and cells invading the wound bed (yellow arrowheads) are shown. Bars, 20 µm. (n = 2–5 40X images/mouse, 4 mice/group). (B) one representative experiment out of 3 with 50 µg/lane of wound protein extract from 3 mice per genotype and 1 µl/lane of mouse serum is shown. Vinculin immunoblotting (loading control) is also shown. Results are expressed as mean ± SD gray intensity values of Plg or plasmin/vinculin. (n = 6 mice/group). (C) An ELISA of D-dimer in skin wound extracts on day 2 was performed. (n = 16 WT and 17 Ptx3−/− independent mice). (D and E) An ELISA (left) and a Western blot analysis (right) of soluble fibrinolysis products generated by WT or Ptx3−/− peritoneal macrophages in (D) or embryonic fibroblasts (MEFs) in (E) grown in fibrin clots as described in Materials and methods in 3 and 2 d of culture, respectively, are shown. (D) (left) Data are presented as mean ± SD of one representative experiment in triplicate with 2–3 independent mice out of 4; (right) one experiment of 2 performed is shown. (F) Representative confocal microscopy images of WT or Ptx3−/− MEF after 2 d of culture in a fibrin matrix, to assess remodeling of the matrix, as well as apparent colocalization of PTX3 and fibrin fibers in WT versus Ptx3−/− cultures. (inset) PTX3 staining (red) and nucleus (blue) are shown. Bars, 50 µm. (E and F) One representative experiment with three independent mice out of two is shown. (C–E) ***, P < 0.005 (Student’s t test).
Figure 10.
Figure 10.
Inhibitors of coagulation and fibrin deposition rescue the phenotype of Ptx3−/− mice in skin wound healing. (A–C) A kinetic analysis of skin excisional wound areas after treatment with ATIII (A), Argatroban (B), and Batroxobin (C) was performed in WT and Ptx3−/− mice; *, P < 0.005, Ptx3−/− treated versus Ptx3−/− (Student’s t test). One representative experiment with 8–10 mice/group out of 2 is shown. (D) Representative macroscopic images of WT and Ptx3−/− skin wounds after treatment with ATIII, Argatroban, and Batroxobin at the indicated days after wounding are shown. (E and F) Representative confocal microscopy images (E) and quantification (F) of COL1A1 deposition in wounded skin (on day 7) after treatment with the indicated pharmacological agents in WT and Ptx3−/− mice from A–C are shown. (E) Bars, 100 µm. (E and F) Results are presented as mean percentage of area ± SD (n = 5–8 images from 4 mice/experimental group). **, P < 0.01; ***, P < 0.005 (Mann-Whitney test).

Comment in

Similar articles

Cited by

References

    1. Barbieri S.S., Amadio P., Gianellini S., Tarantino E., Zacchi E., Veglia F., Howe L.R., Weksler B.B., Mussoni L., and Tremoli E.. 2012. Cyclooxygenase-2-derived prostacyclin regulates arterial thrombus formation by suppressing tissue factor in a sirtuin-1-dependent-manner. Circulation. 126:1373–1384. 10.1161/CIRCULATIONAHA.112.097295 - DOI - PubMed
    1. Bottazzi B., Vouret-Craviari V., Bastone A., De Gioia L., Matteucci C., Peri G., Spreafico F., Pausa M., D’Ettorre C., Gianazza E., et al. . 1997. Multimer formation and ligand recognition by the long pentraxin PTX3. Similarities and differences with the short pentraxins C-reactive protein and serum amyloid P component. J. Biol. Chem. 272:32817–32823. 10.1074/jbc.272.52.32817 - DOI - PubMed
    1. Bottazzi B., Doni A., Garlanda C., and Mantovani A.. 2010. An integrated view of humoral innate immunity: pentraxins as a paradigm. Annu. Rev. Immunol. 28:157–183. 10.1146/annurev-immunol-030409-101305 - DOI - PubMed
    1. Bugge T.H., Kombrinck K.W., Flick M.J., Daugherty C.C., Danton M.J., and Degen J.L.. 1996. Loss of fibrinogen rescues mice from the pleiotropic effects of plasminogen deficiency. Cell. 87:709–719. 10.1016/S0092-8674(00)81390-2 - DOI - PubMed
    1. Calvaruso V., Maimone S., Gatt A., Tuddenham E., Thursz M., Pinzani M., and Burroughs A.K.. 2008. Coagulation and fibrosis in chronic liver disease. Gut. 57:1722–1727. 10.1136/gut.2008.150748 - DOI - PubMed

Publication types

MeSH terms