. 2015 May 11;209(3):367-76.
doi: 10.1083/jcb.201412015.

Junctional actin assembly is mediated by Formin-like 2 downstream of Rac1

Affiliations

Junctional actin assembly is mediated by Formin-like 2 downstream of Rac1

Katharina Grikscheit et al. J Cell Biol. .

Abstract

Epithelial integrity is vitally important, and its deregulation causes early stage cancer. De novo formation of an adherens junction (AJ) between single epithelial cells requires coordinated, spatial actin dynamics, but the mechanisms steering nascent actin polymerization for cell-cell adhesion initiation are not well understood. Here we investigated real-time actin assembly during daughter cell-cell adhesion formation in human breast epithelial cells in 3D environments. We identify formin-like 2 (FMNL2) as being specifically required for actin assembly and turnover at newly formed cell-cell contacts as well as for human epithelial lumen formation. FMNL2 associates with components of the AJ complex involving Rac1 activity and the FMNL2 C terminus. Optogenetic control of Rac1 in living cells rapidly drove FMNL2 to epithelial cell-cell contact zones. Furthermore, Rac1-induced actin assembly and subsequent AJ formation critically depends on FMNL2. These data uncover FMNL2 as a driver for human epithelial AJ formation downstream of Rac1.


Figures

Figure 1.
Figure 1.
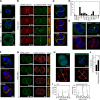
FMNL2 localizes to AJs in a 3D model for nascent cell–cell adhesion formation. (A) Confocal images of MCF10A cells in 3D stained for F-actin after 1, 4, or 14 d. (B) 3D reconstructions of MCF10A cells expressing LifeAct-mCherry and E-Cadherin–GFP during cell–cell contact formation. Merged images show magnification (bar, 2 µm). (C) MCF10A cells grown in Matrigel and labeled as indicated. The asterisk marks the junctional area. (D) Expression of formins in MCF10A cells assessed by qPCR. (E) MCF10A cells grown in Matrigel were labeled as indicated. FMNL2 localizes to the AJ (asterisk). (F) MCF10A cells expressing FMNL2-GFP were labeled for E-Cadherin. (G) 3D reconstructions of a time series of MCF10A cells expressing LifeAct-mCherry and FMNL2-GFP. Merged images magnify the AJ area (bar, 2 µm). (H) Representative images of MCF10A cells expressing GFP or FMNL2ΔDAD-GFP stained for F-actin. Arrows illustrate line scans used for quantifications. (I) Corresponding line scan profiles to H. (J) Quantification of F-actin line scan profiles (GFP, n = 47; FMNL2ΔDAD-GFP, n = 66). *, P ≤ 0.05. Error bars indicate SEM.
Figure 2.
Figure 2.
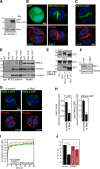
FMNL2 is required for actin turnover at the cell–cell interface. (A) Western blot analysis of MCF10A cells expressing dox-inducible control or FMNL2 shRNAs. (B) Live MCF10A cells expressing LifeAct-GFP with the indicated shRNAs (monitored through RFP) seeded in Matrigel. Arrows highlight the altered distribution of actin in FMNL2 shRNA cells. (C and D) Quantification of aberrant junctional actin as visualized by Lifeact-GFP in shRNA-expressing (C) or siRNA-treated (D) MCF10A cell pairs. (E) Western blot showing that FMNL2ΔDAD-GFP is resistant to siRNA against FMNL2 UTR. Active FMNL2 rescues junctional actin in FMNL2-depleted MCF10A cells in 3D. (F) MCF10A cell pair expressing GFP-actin. In 3D FRAP experiments, junctional GFP-actin was photobleached (white circle). Magnifications illustrate GFP-actin recovery. (G) FRAP curves comparing the effects of DMSO, Jasplakinolide, or Latrunculin B on junctional actin. (H) FRAP curves of GFP-actin MCF10A cells expressing indicated shRNAs. (I) Corresponding experiments to Fig. 2 F showing FMNL2-independent recovery of cytosolic and plasma membrane GFP-actin. (J) MCF10A cells expressing the indicated shRNAs grown for 14 d before staining for F-actin. The top right panels show an enlargement of individual cells. The bottom right panels show shRNAs as RFP. (K) Quantification of J. (L) Caco-2 cells expressing either control or FMNL2 shRNA grown in 3D for 7 d. After staining for F-actin, lumen formation was quantified (M). Error bars indicate SEM. *, P ≤ 0.05.
Figure 3.
Figure 3.
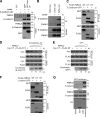
FMNL2 associates with AJ components. (A) E-Cadherin was immunoprecipitated (IP) from cells expressing GFP or GFP-Rac1-L61 to test for coprecipitation of FMNL2 by immunoblotting. (B) Detection of endogenous E-Cadherin in immunoprecipitations of FMNL2 from wild-type MCF10A cells by immunoblotting. (C) HEK cells were transfected with E-Cadherin–GFP and FLAG-tagged FMNL2 derivatives. FLAG-tagged proteins were precipitated and bound GFP-tagged protein was detected by immunoblotting. (D) HEK cells were transfected with FLAG-FMNL2 N terminus (NT) and myc-FMNL2 CT. FLAG-FMNL2 NT was precipitated and tested for coprecipitation of myc-FMNL2 CT in the presence of increasing amounts of E-Cadherin CT. Purified E-Cadherin CT peptide was visualized by Coomassie staining. Numbers indicate statistical values (n = 3, means ± SD) obtained by quantification of coprecipitated myc-FMNL2 CT. (E) Control experiment to C using purified GFP. (F) Experiments were performed as in Fig. 3 B with α-catenin–GFP. (G) GST or GST–α-catenin were purified from bacterial lysates and incubated with MCF10A cell lysate. GST–α-catenin pulled down endogenous FMNL2 as well as β-catenin.
Figure 4.
Figure 4.
Rac1 controls localization and function of FMNL2 at the cell–cell interface. (A) Western blot of dox-inducible GFP-Rac1 expression in MCF10A. (B) MCF10A cells expressing GFP or GFP-Rac1-L61 were seeded in 3D and stained for F-actin. (C) Confocal image of MCF10A cells expressing mCherry-Rac1-L61 and FMNL2-GFP in 3D. (D) Immunoprecipitations (IP) of endogenous E-Cadherin were obtained from MCF10A cells induced to express GFP, GFP-Rac1-L61, or GFP-Rac1-N17. Precipitates were equally divided to test for FMNL2 or β-catenin by immunoblotting. An unspecific mouse IgG was used as a control. (E) GST pull-down assays showing an interaction between purified GST-FMNL2 GBD+FH3 and GFP-Rac1-L61 and GFP–RhoC-V14 expressed in HEK cells. (F) Western blot demonstrating Rac1 siRNA efficiency in MCF10A cells. (G) Confocal image of MCF10A FMNL2-GFP–expressing cells transfected with the indicated siRNAs and stained for F-actin. (H) Quantification of intensity ratios of F-actin or FMNL2-GFP based on line scans of confocal images as shown in G. (I) FRAP analysis in MCF10A GFP-actin cells treated with the indicated siRNAs. Expression of mCherry-FMNL2ΔDAD rescues the effect of Rac1 silencing. (J) Statistical analysis of I. Error bars indicate SEM. *, P ≤ 0.05.
Figure 5.
Figure 5.
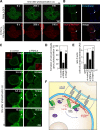
FMNL2-driven actin assembly rapidly induces de novo cell–cell adhesion formation in response to Rac1 activation. (A) Photoactivation of mCherry-PA-Rac1 in MCF10A cells coexpressing FMNL2-GFP. Rac-1 activity was uncaged through the irradiation, with 488-nm laser light simultaneously exciting FMNL2-GFP. (B) MCF10A cells expressing FMNL2-GFP and mCherry-PA-Rac1 were exposed to blue light for 16 min prior to labeling of E-Cadherin. (C) Time-lapse imaging of MCF10A cells expressing mCherry-PA-Rac1 and LifeAct-GFP transfected with the indicated siRNAs. Compared with control cells, FMNL2 suppression resulted in impaired contact formation (arrows). Insets show mCherry-PA-Rac1 expression (bar, 2 µm). (D) Quantification of C. (E) Quantification of junctional F-actin ratios obtained by line scan profiles from induced GFP- or GFP-Rac1-L61–expressing MCF10A transfected with the indicated siRNAs as in Fig. 4 B. (F) Cartoon illustrating the function of FMNL2. In the presence of active Rac1, FMNL2 becomes localized to the cell–cell contact area, where it associates with the adhesion complex to participate in junctional actin assembly. Error bars indicate SEM. *, P ≤ 0.05.

Similar articles

Cited by

References

    1. Baarlink C., Brandt D., and Grosse R.. 2010. SnapShot: Formins. Cell. 142:172–: e1. 10.1016/j.cell.2010.06.030 - DOI - PubMed
    1. Baarlink C., Wang H., and Grosse R.. 2013. Nuclear actin network assembly by formins regulates the SRF coactivator MAL. Science. 340:864–867 10.1126/science.1235038 - DOI - PubMed
    1. Baker B.M., and Chen C.S.. 2012. Deconstructing the third dimension: how 3D culture microenvironments alter cellular cues. J. Cell Sci. 125:3015–3024 10.1242/jcs.079509 - DOI - PMC - PubMed
    1. Block J., Breitsprecher D., Kühn S., Winterhoff M., Kage F., Geffers R., Duwe P., Rohn J.L., Baum B., Brakebusch C., et al. . 2012. FMNL2 drives actin-based protrusion and migration downstream of Cdc42. Curr. Biol. 22:1005–1012 10.1016/j.cub.2012.03.064 - DOI - PMC - PubMed
    1. Brandt D.T., Baarlink C., Kitzing T.M., Kremmer E., Ivaska J., Nollau P., and Grosse R.. 2009. SCAI acts as a suppressor of cancer cell invasion through the transcriptional control of beta1-integrin. Nat. Cell Biol. 11:557–568 10.1038/ncb1862 - DOI - PubMed

Publication types