Regional flux analysis for discovering and quantifying anatomical changes: An application to the brain morphometry in Alzheimer's disease
- PMID: 25963734
- PMCID: PMC6343474
- DOI: 10.1016/j.neuroimage.2015.04.051
Regional flux analysis for discovering and quantifying anatomical changes: An application to the brain morphometry in Alzheimer's disease
Abstract
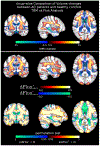
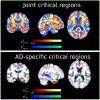
In this study we introduce the regional flux analysis, a novel approach to deformation based morphometry based on the Helmholtz decomposition of deformations parameterized by stationary velocity fields. We use the scalar pressure map associated to the irrotational component of the deformation to discover the critical regions of volume change. These regions are used to consistently quantify the associated measure of volume change by the probabilistic integration of the flux of the longitudinal deformations across the boundaries. The presented framework unifies voxel-based and regional approaches, and robustly describes the volume changes at both group-wise and subject-specific level as a spatial process governed by consistently defined regions. Our experiments on the large cohorts of the ADNI dataset show that the regional flux analysis is a powerful and flexible instrument for the study of Alzheimer's disease in a wide range of scenarios: cross-sectional deformation based morphometry, longitudinal discovery and quantification of group-wise volume changes, and statistically powered and robust quantification of hippocampal and ventricular atrophy.
Keywords: Alzheimer's disease; Demons; Longitudinal atrophy; Non-linear registration; Optimization.
Copyright © 2015 Elsevier Inc. All rights reserved.
Figures


Similar articles
-
Regional flux analysis of longitudinal atrophy in Alzheimer's disease.Med Image Comput Comput Assist Interv. 2012;15(Pt 1):739-46. doi: 10.1007/978-3-642-33415-3_91. Med Image Comput Comput Assist Interv. 2012. PMID: 23285618
-
LCC-Demons: a robust and accurate symmetric diffeomorphic registration algorithm.Neuroimage. 2013 Nov 1;81:470-483. doi: 10.1016/j.neuroimage.2013.04.114. Epub 2013 May 16. Neuroimage. 2013. PMID: 23685032
-
Sparse scale-space decomposition of volume changes in deformations fields.Med Image Comput Comput Assist Interv. 2013;16(Pt 2):328-35. doi: 10.1007/978-3-642-40763-5_41. Med Image Comput Comput Assist Interv. 2013. PMID: 24579157
-
Understanding disease progression and improving Alzheimer's disease clinical trials: Recent highlights from the Alzheimer's Disease Neuroimaging Initiative.Alzheimers Dement. 2019 Jan;15(1):106-152. doi: 10.1016/j.jalz.2018.08.005. Epub 2018 Oct 13. Alzheimers Dement. 2019. PMID: 30321505 Review.
-
The efficacy of a voxel-based morphometry on the analysis of imaging in schizophrenia, temporal lobe epilepsy, and Alzheimer's disease/mild cognitive impairment: a review.Neuroradiology. 2010 Aug;52(8):711-21. doi: 10.1007/s00234-010-0717-2. Epub 2010 May 22. Neuroradiology. 2010. PMID: 20495793 Review.
Cited by
-
Learning Biomarker Models for Progression Estimation of Alzheimer's Disease.PLoS One. 2016 Apr 20;11(4):e0153040. doi: 10.1371/journal.pone.0153040. eCollection 2016. PLoS One. 2016. PMID: 27096739 Free PMC article.
-
Assessing atrophy measurement techniques in dementia: Results from the MIRIAD atrophy challenge.Neuroimage. 2015 Dec;123:149-64. doi: 10.1016/j.neuroimage.2015.07.087. Epub 2015 Aug 11. Neuroimage. 2015. PMID: 26275383 Free PMC article.
-
Recent publications from the Alzheimer's Disease Neuroimaging Initiative: Reviewing progress toward improved AD clinical trials.Alzheimers Dement. 2017 Apr;13(4):e1-e85. doi: 10.1016/j.jalz.2016.11.007. Epub 2017 Mar 22. Alzheimers Dement. 2017. PMID: 28342697 Free PMC article. Review.
-
A discriminative feature selection approach for shape analysis: Application to fetal brain cortical folding.Med Image Anal. 2017 Jan;35:313-326. doi: 10.1016/j.media.2016.07.005. Epub 2016 Jul 25. Med Image Anal. 2017. PMID: 27498089 Free PMC article.
-
DeepAtrophy: Teaching a neural network to detect progressive changes in longitudinal MRI of the hippocampal region in Alzheimer's disease.Neuroimage. 2021 Nov;243:118514. doi: 10.1016/j.neuroimage.2021.118514. Epub 2021 Aug 24. Neuroimage. 2021. PMID: 34450261 Free PMC article.
References
-
- Arfken GB, Weber HJ, 1995. Mathematical Methods for Physicists. San Diego, Academic Press.
-
- Arsigny V, Commowick O, Pennec X, Ayache N, 2006. A Log-Euclidean framework for statistics on diffeomorphisms. MICCAI vol. 9, pp. 924–931. - PubMed
-
- Ashburner J, Friston K, 2000. Voxel-based morphometry—the methods. NeuroImage 11, 805–821. - PubMed
-
- Belkin M, Niyogi P, 2001. Laplacian eigenmaps and spectral techniques for embedding and clustering Advances in Neural Information Processing Systems 14 MIT Press, pp. 585–591.
-
- Bossa M, Zacur E, Olmos S, 2010. On changing coordinate systems for longitudinal tensor-based morphometry Spatio Temporal Image Analysis Workshop (STIA), p. 2010.
Publication types
MeSH terms
Grants and funding
LinkOut - more resources
Full Text Sources
Other Literature Sources
Medical

