

Transcriptional profiling provides insights into metronomic cyclophosphamide-activated, innate immune-dependent regression of brain tumor xenografts
- PMID: 25952672
- PMCID: PMC4523019
- DOI: 10.1186/s12885-015-1358-y
Transcriptional profiling provides insights into metronomic cyclophosphamide-activated, innate immune-dependent regression of brain tumor xenografts
Abstract
Background: Cyclophosphamide treatment on a six-day repeating metronomic schedule induces a dramatic, innate immune cell-dependent regression of implanted gliomas. However, little is known about the underlying mechanisms whereby metronomic cyclophosphamide induces innate immune cell mobilization and recruitment, or about the role of DNA damage and cell stress response pathways in eliciting the immune responses linked to tumor regression.
Methods: Untreated and metronomic cyclophosphamide-treated human U251 glioblastoma xenografts were analyzed on human microarrays at two treatment time points to identify responsive tumor cell-specific factors and their upstream regulators. Mouse microarray analysis across two glioma models (human U251, rat 9L) was used to identify host factors and gene networks that contribute to the observed immune and tumor regression responses.
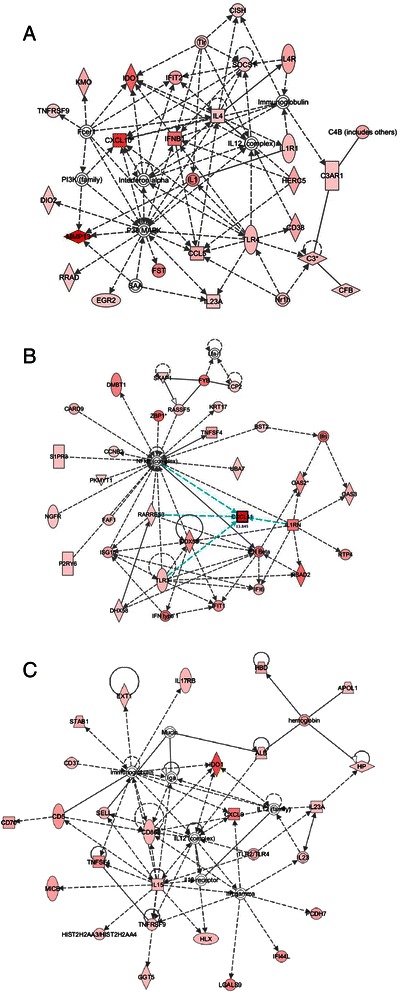
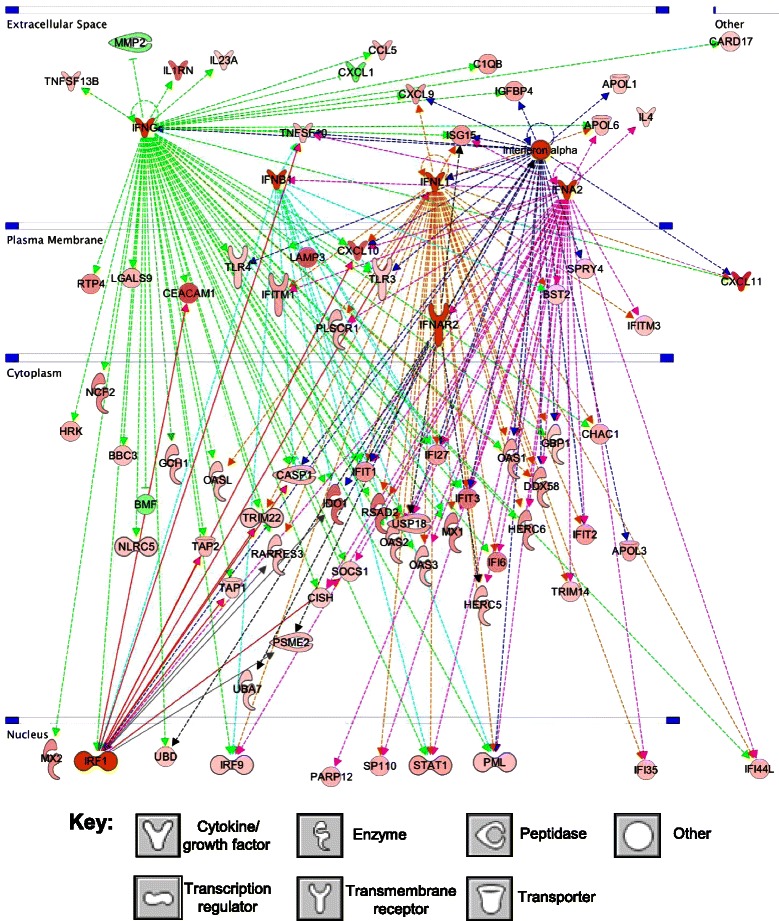
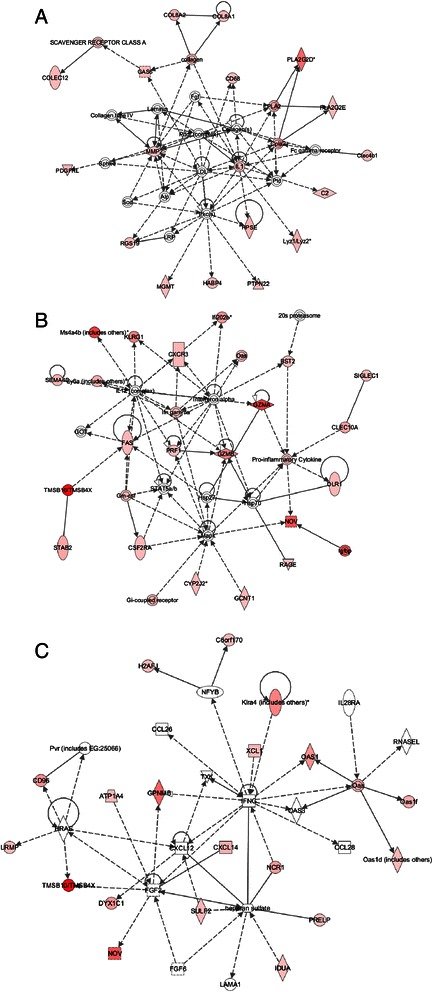
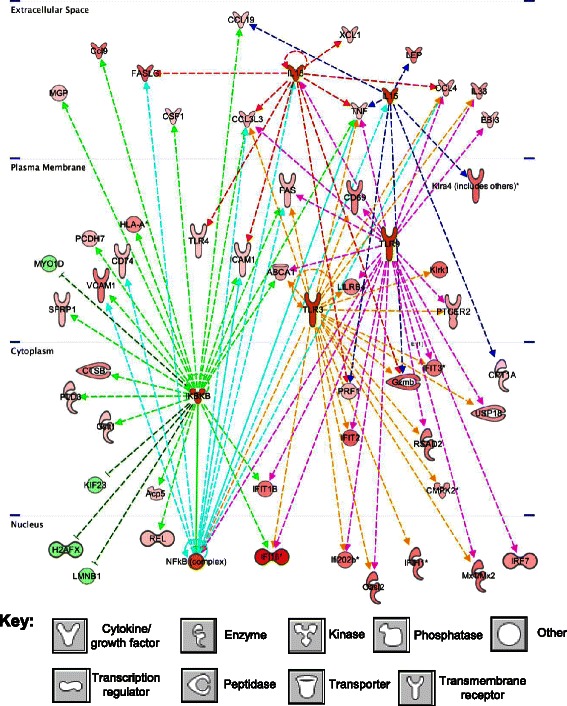
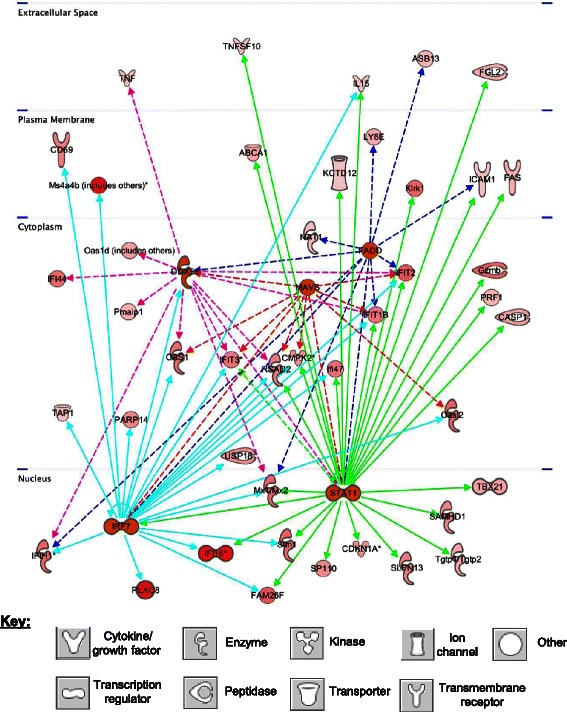
Results: Metronomic cyclophosphamide increased expression of tumor cell-derived DNA damage, cell stress, and cell death genes, which may facilitate innate immune activation. Increased expression of many host (mouse) immune networks was also seen in both tumor models, including complement components, toll-like receptors, interferons, and cytolysis pathways. Key upstream regulators activated by metronomic cyclophosphamide include members of the interferon, toll-like receptor, inflammatory response, and PPAR signaling pathways, whose activation may contribute to anti-tumor immunity. Many upstream regulators inhibited by metronomic cyclophosphamide, including hypoxia-inducible factors and MAP kinases, have glioma-promoting activity; their inhibition may contribute to the therapeutic effectiveness of the six-day repeating metronomic cyclophosphamide schedule.
Conclusions: Large numbers of responsive cytokines, chemokines and immune regulatory genes linked to innate immune cell recruitment and tumor regression were identified, as were several immunosuppressive factors that may contribute to the observed escape of some tumors from metronomic CPA-induced, immune-based regression. These factors may include useful biomarkers that facilitate discovery of clinically effective immunogenic metronomic drugs and treatment schedules, and the selection of patients most likely to be responsive to immunogenic drug scheduling.
Figures
Similar articles
-
Metronomic cyclophosphamide activation of anti-tumor immunity: tumor model, mouse host, and drug schedule dependence of gene responses and their upstream regulators.BMC Cancer. 2016 Aug 11;16:623. doi: 10.1186/s12885-016-2597-2. BMC Cancer. 2016. PMID: 27515027 Free PMC article.
-
Metronomic cyclophosphamide schedule-dependence of innate immune cell recruitment and tumor regression in an implanted glioma model.Cancer Lett. 2014 Oct 28;353(2):272-80. doi: 10.1016/j.canlet.2014.07.033. Epub 2014 Jul 25. Cancer Lett. 2014. PMID: 25069038 Free PMC article.
-
Anti-tumor innate immunity activated by intermittent metronomic cyclophosphamide treatment of 9L brain tumor xenografts is preserved by anti-angiogenic drugs that spare VEGF receptor 2.Mol Cancer. 2014 Jun 26;13:158. doi: 10.1186/1476-4598-13-158. Mol Cancer. 2014. PMID: 24965046 Free PMC article.
-
Recent advances in the role of toll-like receptors and TLR agonists in immunotherapy for human glioma.Protein Cell. 2014 Dec;5(12):899-911. doi: 10.1007/s13238-014-0112-6. Epub 2014 Nov 21. Protein Cell. 2014. PMID: 25411122 Free PMC article. Review.
-
Mechanisms and pathways of innate immune activation and regulation in health and cancer.Hum Vaccin Immunother. 2014;10(11):3270-85. doi: 10.4161/21645515.2014.979640. Hum Vaccin Immunother. 2014. PMID: 25625930 Free PMC article. Review.
Cited by
-
Low-dose metronomic cyclophosphamide complements the actions of an intratumoral C-class CpG TLR9 agonist to potentiate innate immunity and drive potent T cell-mediated anti-tumor responses.Oncotarget. 2019 Dec 31;10(68):7220-7237. doi: 10.18632/oncotarget.27322. eCollection 2019 Dec 31. Oncotarget. 2019. PMID: 31921384 Free PMC article.
-
Development of a cyclophosphamide stress test to predict resilience to aging in mice.Geroscience. 2020 Dec;42(6):1675-1683. doi: 10.1007/s11357-020-00222-z. Epub 2020 Jul 1. Geroscience. 2020. PMID: 32613492 Free PMC article.
-
Addressing Genetic Tumor Heterogeneity, Post-Therapy Metastatic Spread, Cancer Repopulation, and Development of Acquired Tumor Cell Resistance.Cancers (Basel). 2023 Dec 29;16(1):180. doi: 10.3390/cancers16010180. Cancers (Basel). 2023. PMID: 38201607 Free PMC article. Review.
-
Metronomic cyclophosphamide activation of anti-tumor immunity: tumor model, mouse host, and drug schedule dependence of gene responses and their upstream regulators.BMC Cancer. 2016 Aug 11;16:623. doi: 10.1186/s12885-016-2597-2. BMC Cancer. 2016. PMID: 27515027 Free PMC article.
-
Molecular iodine exerts antineoplastic effects by diminishing proliferation and invasive potential and activating the immune response in mammary cancer xenografts.BMC Cancer. 2019 Mar 22;19(1):261. doi: 10.1186/s12885-019-5437-3. BMC Cancer. 2019. PMID: 30902074 Free PMC article.
References
-
- Browder T, Butterfield CE, Kraling BM, Shi B, Marshall B, O’Reilly MS, et al. Antiangiogenic scheduling of chemotherapy improves efficacy against experimental drug-resistant cancer. Cancer Res. 2000;60(7):1878–86. - PubMed
-
- Pasquier E, Kavallaris M, Andre N. Metronomic chemotherapy: new rationale for new directions. Nat Rev Clin Oncol. 2010;7(8):455–65. - PubMed
-
- Lien K, Georgsdottir S, Sivanathan L, Chan K, Emmenegger U. Low-dose metronomic chemotherapy: a systematic literature analysis. Eur J Cancer. 2013;49(16):3387–95. - PubMed
Publication types
MeSH terms
Substances
Grants and funding
LinkOut - more resources
Full Text Sources
Other Literature Sources
Medical
Molecular Biology Databases
