Grade-Dependent Metabolic Reprogramming in Kidney Cancer Revealed by Combined Proteomics and Metabolomics Analysis
- PMID: 25952651
- PMCID: PMC4470795
- DOI: 10.1158/0008-5472.CAN-14-1703
Grade-Dependent Metabolic Reprogramming in Kidney Cancer Revealed by Combined Proteomics and Metabolomics Analysis
Abstract
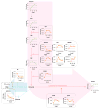
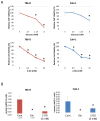
Kidney cancer [or renal cell carcinoma (RCC)] is known as "the internist's tumor" because it has protean systemic manifestations, suggesting that it utilizes complex, nonphysiologic metabolic pathways. Given the increasing incidence of this cancer and its lack of effective therapeutic targets, we undertook an extensive analysis of human RCC tissue employing combined grade-dependent proteomics and metabolomics analysis to determine how metabolic reprogramming occurring in this disease allows it to escape available therapeutic approaches. After validation experiments in RCC cell lines that were wild-type or mutant for the Von Hippel-Lindau tumor suppressor, in characterizing higher-grade tumors, we found that the Warburg effect is relatively more prominent at the expense of the tricarboxylic acid cycle and oxidative metabolism in general. Further, we found that the glutamine metabolism pathway acts to inhibit reactive oxygen species, as evidenced by an upregulated glutathione pathway, whereas the β-oxidation pathway is inhibited, leading to increased fatty acylcarnitines. In support of findings from previous urine metabolomics analyses, we also documented tryptophan catabolism associated with immune suppression, which was highly represented in RCC compared with other metabolic pathways. Together, our results offer a rationale to evaluate novel antimetabolic treatment strategies being developed in other disease settings as therapeutic strategies in RCC.
©2015 American Association for Cancer Research.
Figures


Comment in
-
Kidney cancer: Novel targets in altered tumour metabolism in kidney cancer.Nat Rev Urol. 2015 Aug;12(8):428-9. doi: 10.1038/nrurol.2015.168. Epub 2015 Jul 28. Nat Rev Urol. 2015. PMID: 26215688 No abstract available.
Similar articles
-
Distinct von Hippel-Lindau gene and hypoxia-regulated alterations in gene and protein expression patterns of renal cell carcinoma and their effects on metabolism.Oncotarget. 2015 May 10;6(13):11395-406. doi: 10.18632/oncotarget.3456. Oncotarget. 2015. PMID: 25890500 Free PMC article.
-
Metabolomics and Metabolic Reprogramming in Kidney Cancer.Semin Nephrol. 2018 Mar;38(2):175-182. doi: 10.1016/j.semnephrol.2018.01.006. Semin Nephrol. 2018. PMID: 29602399 Free PMC article. Review.
-
Metabolic reprogramming in renal cancer: Events of a metabolic disease.Biochim Biophys Acta Rev Cancer. 2021 Aug;1876(1):188559. doi: 10.1016/j.bbcan.2021.188559. Epub 2021 May 6. Biochim Biophys Acta Rev Cancer. 2021. PMID: 33965513 Free PMC article. Review.
-
(1)H NMR metabolomics analysis of renal cell carcinoma cells: Effect of VHL inactivation on metabolism.Int J Cancer. 2016 May 15;138(10):2439-49. doi: 10.1002/ijc.29947. Epub 2016 Jan 29. Int J Cancer. 2016. PMID: 26620126
-
Pathway analysis of kidney cancer using proteomics and metabolic profiling.Mol Cancer. 2006 Nov 24;5:64. doi: 10.1186/1476-4598-5-64. Mol Cancer. 2006. PMID: 17123452 Free PMC article.
Cited by
-
HADH suppresses clear cell renal cell carcinoma progression through reduced NRF2-dependent glutathione synthesis.Transl Oncol. 2024 Nov;49:102112. doi: 10.1016/j.tranon.2024.102112. Epub 2024 Sep 2. Transl Oncol. 2024. PMID: 39226735 Free PMC article.
-
Molecular and Metabolic Subtypes in Sporadic and Inherited Clear Cell Renal Cell Carcinoma.Genes (Basel). 2021 Mar 9;12(3):388. doi: 10.3390/genes12030388. Genes (Basel). 2021. PMID: 33803184 Free PMC article. Review.
-
Influence of microbiota-associated metabolic reprogramming on clinical outcome in patients with melanoma from the randomized adjuvant dendritic cell-based MIND-DC trial.Nat Commun. 2024 Feb 23;15(1):1633. doi: 10.1038/s41467-024-45357-1. Nat Commun. 2024. PMID: 38395948 Free PMC article.
-
Urinary Metabolomic and Proteomic Analyses in a Mouse Model of Prostatic Inflammation.Urine (Amst). 2019 Jun;1:17-23. doi: 10.1016/j.urine.2020.05.002. Epub 2020 May 27. Urine (Amst). 2019. PMID: 33870183 Free PMC article.
-
Proteomic approaches for characterizing renal cell carcinoma.Clin Proteomics. 2020 Jul 29;17:28. doi: 10.1186/s12014-020-09291-w. eCollection 2020. Clin Proteomics. 2020. PMID: 32742246 Free PMC article. Review.
References
Publication types
MeSH terms
Grants and funding
LinkOut - more resources
Full Text Sources
Other Literature Sources
Medical

