. 2015 May 7;11(5):e1005206.
doi: 10.1371/journal.pgen.1005206. eCollection 2015 May.

Accounting for experimental noise reveals that mRNA levels, amplified by post-transcriptional processes, largely determine steady-state protein levels in yeast

Affiliations

Accounting for experimental noise reveals that mRNA levels, amplified by post-transcriptional processes, largely determine steady-state protein levels in yeast

Gábor Csárdi et al. PLoS Genet. .

Abstract

Cells respond to their environment by modulating protein levels through mRNA transcription and post-transcriptional control. Modest observed correlations between global steady-state mRNA and protein measurements have been interpreted as evidence that mRNA levels determine roughly 40% of the variation in protein levels, indicating dominant post-transcriptional effects. However, the techniques underlying these conclusions, such as correlation and regression, yield biased results when data are noisy, missing systematically, and collinear---properties of mRNA and protein measurements---which motivated us to revisit this subject. Noise-robust analyses of 24 studies of budding yeast reveal that mRNA levels explain more than 85% of the variation in steady-state protein levels. Protein levels are not proportional to mRNA levels, but rise much more rapidly. Regulation of translation suffices to explain this nonlinear effect, revealing post-transcriptional amplification of, rather than competition with, transcriptional signals. These results substantially revise widely credited models of protein-level regulation, and introduce multiple noise-aware approaches essential for proper analysis of many biological phenomena.


Conflict of interest statement

The authors have declared that no competing interests exist.

Figures
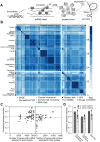
Fig 1
Fig 1. Measurements of steady-state mRNA and protein levels in budding yeast reveal wide variation in reproducibility and coverage.
A, Steady-state protein levels reflect the balance of mRNA translation and protein removal. B, Raw correlations between measurements of mRNA and protein arranged by study (denoted by the first author) with the quantification method indicated. C, Measurements vary widely in reproducibility and coverage. Each point represents a pair of studies. Dots show between-study correlations (median shown by dashed line), a measure of reliability. Dotted line, median of within-study correlations. Blue dots show pairs of studies from the same research group. D, Correlations between studies sharing the same quantification method or different methods (dark and light gray bars, respectively), using mRNA datasets with ≥ 5000 genes (4,595 genes quantified by all datasets). For example, the second column from the left shows the 18 correlations between each of three commercial microarray studies and six studies using custom microarrays or RNA-Seq.
Fig 2
Fig 2. Correlations between mRNA and protein levels vary widely and are systematically reduced by experimental noise.
A, Datasets vary widely in coverage of 5,887 yeast coding sequences and in resulting estimates of the mRNA–protein correlation. Shown are all pairwise correlations between 14 mRNA and 11 protein datasets, with within-study replicates averaged if present. Correlations are shown between mRNA and protein levels reported without correction (dots); using Spearman’s correction on pairs of datasets (binned, boxes show mean and bars indicate standard deviation); using Spearman’s correction on the largest set of paired measurements (red box); and as estimated by structured covariance modeling for 5,854 genes with a detected mRNA or protein (red diamond). B, Correlations obtained for the largest set of paired measurements, two of mRNA and two of protein levels (N = 3,418), computed individually, after averaging, and after correcting for noise using Spearman’s correction. C, Data are missing non-randomly. The distribution of protein levels, in molecules per cell, detected by western blotting [30] are shown, along with the subsets of these data corresponding to proteins detected by GFP-tagging and flow cytometry [39], LC MS/MS [75], and 2D gel [6]. D, Distribution of protein-level measurements, assessed by western blotting [30], with at least one protein-level measurement (dark gray, number of genes N 1 = 3840) and in the subset of genes with at least 8 mRNA and 8 protein measurements (light gray, number of genes N 8 = 549). E, mRNA–protein correlations between averaged mRNA and protein levels over subsets of at most 1, 2, 3, …, 8 measurements each of mRNA and protein levels drawn at random from the N 8 set. Error bars show the standard deviation of correlations from 50 random samples of the indicated number of measurements.
Fig 3
Fig 3. Correlation estimates show widely varying performance on simulated data.
(N = 5000 “genes”) against the known true correlations used to generate the data (dotted line). 50 replicates were performed at each parameter value. A, Varying true correlation from 0.1 to 1.0 with a fixed reliability (ratio of true to total variance) of 0.7. B, Varying reliability from 0.1 to 1.0 with a fixed true correlation of 0.9. C, Varying the number of genes with detected gene products from 100 (2%) to 5000 (100%) with a fixed reliability of 0.7 and fixed correlation of 0.9, with gene data missing at random. D, As in C, but with gene data missing non-randomly according to the sigmoidal model described in Methods, such that low-expression gene products are less likely to be detected.
Fig 4
Fig 4. Imputation of non-randomly missing data.
The probability of gene or protein detection is modeled in the SCM as an increasing, step-like (logistic) function of the mRNA or protein level (see Methods). Lower panel shows the inferred probability of detection as a function of the measurement value for a single mRNA dataset [76]; top shows the distribution of detected, missing (imputed), and all genes.
Fig 5
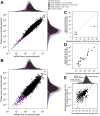
Fig 5. Integrated estimates of mRNA and protein levels using a structured covariance model (SCM).
A, Integrated estimates of mean steady-state protein and mRNA levels across 58 global measurements reveal a strong genome-wide dependence between (r = 0.93). Estimates are produced for any gene with a detected mRNA (gray marginal densities), and other densities characterize subsets by mRNA and protein detection. B, A single sample from the SCM estimates provides a representative view of mRNA and protein levels. Colors and marginal densities are the same as in A. C, Absolute mRNA level estimates versus single-molecule fluorescence in situ hybridization counts [53]. D, Absolute protein level estimates versus stable-isotope-standardized single reaction monitoring measurements [57]. Dotted lines in B and C show perfect agreement. E, Evidence for active translation of undetected proteins inferred from ribosome profiling. Dashed line shows ranged major-axis regression best fit. Marginal densities show ribosome density (median across five studies, see Methods) for all detected mRNAs (light gray), all mRNAs with a detected mRNA and protein (dark gray), and transcripts with no detected protein (blue).
Fig 6
Fig 6. Transcriptional and translational regulation act coherently to set protein levels.
A, Left, the correlation of mRNA (orange) and ribosome footprint density (green) with protein levels [40] as originally reported [18]. Results of four subsequent ribosome footprint density datasets (gray) from other groups are shown for comparison. Right, the same correlations employing SCM-estimated protein levels. The SCM mRNA–protein correlation is shown for comparison (blue). All bars show Pearson correlations between log-transformed values. B, The exponent relating protein and mRNA levels, or equivalently the slope relating log-transformed values, estimated by noise-blind (ordinary least-squares, OLS) and noise-aware (ranged major-axis, RMA) regression analyses. Gray points, all pairs of datasets; black points, pairs of datasets covering at least half the detected transcriptome (> 2927 genes). Dotted line shows perfect agreement; dashed line marks integrated SCM estimate (1.69). C, Cumulative distributions of slopes computed by OLS and RMA regression (solid lines), with medians indicated by dotted lines and the SCM slope estimate indicated by a dashed line, cf. S2 Fig. D, Relative translational activity (TA) measured by ribosome density (normalized, median over five datasets, N = 4435) correlates strongly and nonlinearly with mRNA level (SCM estimate). Dotted gray line shows linear (slope = 1) fit. Solid gray line shows RMA regression fit (slope = 1.68). E, Relative translational efficiency (TE) (ribosome density divided by mRNA level) increases with SCM mRNA level (Spearman r = 0.65). F, RMA-estimated slopes for translational activity (ribosome density) and protein level versus SCM-estimated mRNA level (left) and recent RNA-seq mRNA level (right). Dashed line shows SCM estimate of protein vs. mRNA slope. G, Distributions of per-gene steady-state levels of mRNAs (blue; SCM estimates [solid] and independent recent RNA-seq estimates [dotted]), ribosomes on steady-state mRNAs (dotted yellow), and proteins (magenta).
Fig 7
Fig 7. A simplified model captures major features of the steady-state mRNA–protein relationship.
A, mRNA and protein levels estimated by the structured covariance model (cf. Fig 5B). Dotted line shows a linear relationship. B, mRNA and protein levels generated according to a toy model (see text and Methods). Dotted line shows a linear relationship. C, Normalized translational efficiency (ribosome density per mRNA) compared to steady-state mRNA levels. D, Translation rate per mRNA versus mRNA level in the toy model.

Similar articles

Cited by

References

    1. de Sousa Abreu R, Penalva L, Marcotte E, Vogel C (2009) Global signatures of protein and mRNA expression levels. Mol Biosyst 5: 1512–1526. 10.1039/b908315d - DOI - PMC - PubMed
    1. Belle A, Tanay A, Bitincka L, Shamir R, O’Shea EK (2006) Quantification of protein half-lives in the budding yeast proteome. Proc Natl Acad Sci U S A 103: 13004–13009. 10.1073/pnas.0605420103 - DOI - PMC - PubMed
    1. Schwanhausser B, Busse D, Li N, Dittmar G, Schuchhardt J, et al. (2011) Global quantification of mammalian gene expression control. Nature 473: 337–342. 10.1038/nature10098 - DOI - PubMed
    1. Beyer A, Hollunder J, Nasheuer HP, Wilhelm T (2004) Post-transcriptional expression regulation in the yeast Saccharomyces cerevisiae on a genomic scale. Mol Cell Proteomics 3: 1083–1092. 10.1074/mcp.M400099-MCP200 - DOI - PubMed
    1. Yu EZ, Burba AEC, Gerstein M (2007) PARE: a tool for comparing protein abundance and mRNA expression data. BMC bioinformatics 8: 309 10.1186/1471-2105-8-309 - DOI - PMC - PubMed

Publication types

MeSH terms

Substances