. 2015 Jul;89(14):7248-61.
doi: 10.1128/JVI.00839-15. Epub 2015 May 6.

K1 and K15 of Kaposi's Sarcoma-Associated Herpesvirus Are Partial Functional Homologues of Latent Membrane Protein 2A of Epstein-Barr Virus

Affiliations

K1 and K15 of Kaposi's Sarcoma-Associated Herpesvirus Are Partial Functional Homologues of Latent Membrane Protein 2A of Epstein-Barr Virus

Lisa Steinbrück et al. J Virol. 2015 Jul.

Abstract

The human herpesviruses Epstein-Barr virus (EBV) and Kaposi's sarcoma-associated herpesvirus (KSHV) are associated with Hodgkin's lymphoma (HL) and Primary effusion lymphomas (PEL), respectively, which are B cell malignancies that originate from germinal center B cells. PEL cells but also a quarter of EBV-positive HL tumor cells do not express the genuine B cell receptor (BCR), a situation incompatible with survival of normal B cells. EBV encodes LMP2A, one of EBV's viral latent membrane proteins, which likely replaces the BCR's survival signaling in HL. Whether KSHV encodes a viral BCR mimic that contributes to oncogenesis is not known because an experimental model of KSHV-mediated B cell transformation is lacking. We addressed this uncertainty with mutant EBVs encoding the KSHV genes K1 or K15 in lieu of LMP2A and infected primary BCR-negative (BCR(-)) human B cells with them. We confirmed that the survival of BCR(-) B cells and their proliferation depended on an active LMP2A signal. Like LMP2A, the expression of K1 and K15 led to the survival of BCR(-) B cells prone to apoptosis, supported their proliferation, and regulated a similar set of cellular target genes. K1 and K15 encoded proteins appear to have noncomplementing, redundant functions in this model, but our findings suggest that both KSHV proteins can replace LMP2A's key activities contributing to the survival, activation and proliferation of BCR(-) PEL cells in vivo.

Importance: Several herpesviruses encode oncogenes that are receptor-like proteins. Often, they are constitutively active providing important functions to the latently infected cells. LMP2A of Epstein-Barr virus (EBV) is such a receptor that mimics an activated B cell receptor, BCR. K1 and K15, related receptors of Kaposi's sarcoma-associated herpesvirus (KSHV) expressed in virus-associated tumors, have less obvious functions. We found in infection experiments that both viral receptors of KSHV can replace LMP2A and deliver functions similar to the endogenous BCR. K1, K15, and LMP2A also control the expression of a related set of cellular genes in primary human B cells, the target cells of EBV and KSHV. The observed phenotypes, as well as the known characteristics of these genes, argue for their contributions to cellular survival, B cell activation, and proliferation. Our findings provide one possible explanation for the tumorigenicity of KSHV, which poses a severe problem in immunocompromised patients.


Figures

FIG 1
FIG 1
Mutant EBVs encoding K1 and K15 in lieu of LMP2A. (A) Genomic structure of the LMP2A locus in mutant EBVs. Nine exons encode the LMP2A gene, which flank both sides of the terminal repeats (TR) of EBV (red). LMP2A's first exon encodes the signaling domain. LMP2A and LMP2B share exons 2 to 9. The first exon of LMP2B and exon nine of LMP2A and LMP2B are noncoding (white); protein encoding exons are shown in blue. Separate promoters (arrows) drive LMP2A and LMP2B expression; the locus in wt EBV (p2089) reflects this situation (top). In the ΔLMP2A mutant, the promoter and the first exon of LMP2A were deleted, but LMP2B is not affected (4). In the K1 and K15 EBV mutants, the first exon of LMP2A was exactly replaced by the cDNAs coding for K1 or K15 P-type. The LMP2A promoter controls the expression of K1 and K15 genes. (B) Titration and linear regression of four virus stocks determine their virion concentrations. A total of 5 × 10⁴ Raji cells were infected with the indicated volumes of virus stocks. The percentage of GFP-positive cells was assessed by FACS analysis 3 days p.i. Shown are the linear regressions, goodness of fit (R2) and the calculated concentration of GRU per ml. (C) LMP2A, K1, and K15 transcript levels in established LCLs. LCLs were established by infection of primary adenoid B cells with wt EBV, K1 EBV, and K15 EBV. Steady-state mRNA levels were determined after cDNA synthesis and subsequent qPCR analysis. The levels of LMP2A, K1, and K15 cDNAs were normalized to the housekeeper CLK2. LMP2A cDNA levels were set to 1. The mean and the standard deviation of two independent experiments are shown. The steady-state levels of LMP2A and K1 mRNAs in bulk LCLs were similar, whereas the level of K15 mRNA was reduced by a factor of 2.6 compared to LMP2A transcripts.
FIG 2
FIG 2
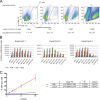
Parameters and conditions optimally supporting EBV infection of primary B lymphocytes. (A) Determination of the number of proliferating, growth transformed cells after EBV infection. EBV-infected primary B lymphocytes increase in size and granularity to become B blasts, which can be detected in flow cytometry. The FSC (forward scatter) represents the size and the SSC (sideward scatter) represents the granularity of a cell. In contrast to noninfected, primary B cells, which exhibit low FSC/SSC signals, EBV-infected lymphoblasts locate to the “LCL gate” as indicated as early as 5 days p.i. In the experimental results shown, 6 × 10⁵ adenoid B cells were infected with wt EBV (MOI = 0.1 GRU). At 1 day p.i., infected cells were supplied with fresh medium and divided into four fractions at a concentration of 1.5 × 10⁵ cells/ml each. At 1, 5, 9, and 21 days p.i., one fraction was quantitatively analyzed by flow cytometry as indicated, and the total number of growth-transformed cells was calculated with the aid of a known number of APC beads, which provide a volume standard for sample normalization. The figure shows an example of a typical experiment with BCR+ B cells infected with wt EBV. (B) Infection of primary B lymphocytes with different MOIs and cellular outgrowth over time. Unsorted B cells were infected with the indicated wt 2089 EBV. The different MOI values are designated in the figure. At the given time points, the absolute numbers of activated and proliferating cells in the LCL gate were determined by flow cytometry as in panel A. Three independent experiments are shown. (C) Titration of a wt EBV stock sample comparing the infectivity of Epstein-Barr virions in Raji versus EBV-negative Daudi cells. A total of 5 × 10⁴ Raji cells or 2 × 10⁵ Daudi cells were infected with the indicated volumes of a wt 2089 virus stock. Percentage of GFP-positive cells was assessed by FACS analysis at 3 days p.i. For comparison, the GFP values were adjusted to 105 cells total. Shown are the linear regressions and the coefficient of determination (R2) derived from three independent experiments.
FIG 3
FIG 3
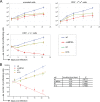
The KSHV genes K1 and K15 partially rescue BCR B cells from apoptosis. (A) Unsorted, sorted BCR+ (CD3, λ++) and BCR (CD3, λ) B cells were infected with the indicated EBV strains. At the given time points, the absolute numbers of activated proliferating cells in the LCL gate was determined by flow cytometry (Fig. 2A). The means and standard deviations of three independent experiments are shown. (B) The numbers of BCR cells (y axis, log2 scale) in the LCL FACS gate after infection with four different EBV strains was plotted over time (x axis). The doubling time is the slope of the linear fit function.
FIG 4
FIG 4
High-titer double infection with K1 EBV and K15 EBV stocks revealed no cooperativity of the two KSHV genes. In the three individual experiments shown, unsorted, sorted BCR+ (CD3, λ++), or BCR (CD3, λ) B cells were infected with wt EBV, ΔLMP2A, K1, or K15 mutant EBV strains at 0.1 GRU per cell. In coinfection experiments, all B cells were dually infected with K1 and K15 mutant EBVs at this virus dose. At the indicated time points p.i., the absolute numbers of cells in the LCL gate were determined by flow cytometry as described in Fig. 2A.
FIG 5
FIG 5
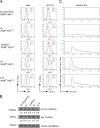
The KSHV proteins K1 and K15 do not inhibit BCR signaling. LCLs were established by infection of primary B cells with wt EBV, ΔLMP2A EBV, K1 EBV, and K15 EBV. An LCL (clone 16) generated from infection with wt 2089 EBV and unable to express a BCR was included as negative control. (A) The LCLs were cross-linked with 25 μg of α-hIgG/M antibody/ml for 10 min or left untreated. Intracellular phosphorylated Syk (pSyk) and PLCγ2 (pPLCγ2) were stained with phosphospecific antibodies. Histograms of flow cytometry analysis are shown. Numbers next to the graphs display the mean fluorescence intensities for uninduced (blue) and cross-linked (red) cells. Numbers below the graphs indicate the fold increases in the mean fluorescence intensities of the pSyk and pPLCγ2 signals after BCR stimulation. (B) Western blot immunodetection of the total levels of Syk and PLCγ2 in the LCLs used in panel A. Three independent experiments were carried out and Western blot bands corresponding to Syk and PLCγ2 were quantified and normalized against tubulin levels. The protein levels of clone A16 were set to one. (C) The LCLs were loaded with 3 μM Indo-1, and the violet/blue ratio of Indo-1 was measured over time. After 1 min of baseline measurement, the BCR was cross-linked with 25 μg of α-hIgG/A/M F(ab)2 fragment/ml.
FIG 6
FIG 6
Principal component analysis (PCA) and schematic sketch of individual steps of the independent component analysis (ICA). (A) The PCA plot of the first two principal components is shown. The analysis reveals that the measured gene expression profiles were highly biased by specific effects arising from the four individual donors of the B lymphocytes. (B) We used ICA to decompose a data matrix (X) into a matrix of independent source profiles (S) and a mixing matrix (A). The ith column of the mixing matrix forms a called feature profile that contains the mixing coefficients denoting the contribution weight of the corresponding ith source profile to the respective samples. A sample here corresponds to a single microarray measurement. (C) We selected the feature profile that displays weights that correspond to a specific experimental setup. Here, we wanted to identify a source profile that contains genes showing a maximal difference between presence or absence of LMP2A-mediated regulation. To do so, we identified the feature profile that displays strongest correlation to a design vector. The corresponding source profile was used subsequently to identify genes of interest by thresholding the source profile weights (red dashed lines). Gene expression profiles for the two identified clusters were derived from the original data matrix.
FIG 7
FIG 7
ICA and subsequent sample clustering identifies genes coregulated by LMP2A, K1, and K15. (A) Heat map displaying genes upregulated during wt (strain 2089) EBV, K1 EBV, or K15 EBV infection compared to ΔLMP2A EBV infection. (B) Genes upregulated in ΔLMP2A EBV-infected cells. After ICA, samples were clustered using two-way hierarchical clustering. The dendrograms on top of the heat maps displays sample similarities separating the four ΔLMP2A samples from wt EBV, K1 EBV, and K15 EBV samples. The indices A1, A2 … to … D3, D4 denote the 16 samples, where characters and numbers indicate the four different virus stocks and four individual B cell donors, respectively. The term prefixes “A” and “B” indicate wt EBV- and ΔLMP2A EBV-infected B cell samples, respectively. Likewise, the term prefixes “C” and “D” indicate samples infected with K1 and K15 EBV. Infected B cells were purified from adenoids of four different donors (donors 1 to 4). Individual gene expression profiles were normalized by setting the mean as 0 and the standard deviation as 1. Relative expression values were depicted as a color scale in which blue and red denote down- and upregulated gene expression, respectively. (C and D) Box plots show the distributions of the normalized gene expression of the 16 samples. In panel C, gene expression of the clustered genes in cells infected with ΔLMP2A shows remarkable downregulation compared to wt EBV, K1 EBV, and K15 EBV, whereas the genes in panel D show the reverse situation for their expression profiles. (E) One-way hierarchical clustering of the combined genes (A and B) reveals coregulated clusters that depend on LMP2A. A heat map of the combined gene clusters shown in panels A and B was produced. The dendrogram indicates two major groups encompassing genes that are upregulated in wt EBV-, K1 EBV-, and K15 EBV-infected cells but downregulated in ΔLMP2A EBV-infected cells and vice versa. Additional groups that encompass genes commonly upregulated or downregulated in B cells infected with either K1 EBV or K15 EBV (red and blue bars, respectively) are readily visible.

Similar articles

Cited by

References

    1. Kuppers R. 2009. The biology of Hodgkin's lymphoma. Nat Rev Cancer 9:15–27. doi:10.1038/nrc2542. - DOI - PubMed
    1. Matolcsy A, Nador RG, Cesarman E, Knowles DM. 1998. Immunoglobulin VH gene mutational analysis suggests that primary effusion lymphomas derive from different stages of B cell maturation. Am J Pathol 153:1609–1614. doi:10.1016/S0002-9440(10)65749-5. - DOI - PMC - PubMed
    1. Brauninger A, Schmitz R, Bechtel D, Renne C, Hansmann ML, Kuppers R. 2006. Molecular biology of Hodgkin's and Reed/Sternberg cells in Hodgkin's lymphoma. Int J Cancer 118:1853–1861. doi:10.1002/ijc.21716. - DOI - PubMed
    1. Mancao C, Hammerschmidt W. 2007. Epstein-Barr virus latent membrane protein 2A is a B-cell receptor mimic and essential for B-cell survival. Blood 110:3715–3721. doi:10.1182/blood-2007-05-090142. - DOI - PMC - PubMed
    1. Beaufils P, Choquet D, Mamoun RZ, Malissen B. 1993. The (YXXL/I)2 signalling motif found in the cytoplasmic segments of the bovine leukaemia virus envelope protein and Epstein-Barr virus latent membrane protein 2A can elicit early and late lymphocyte activation events. EMBO J 12:5105–5112. - PMC - PubMed

Publication types

Substances