Review
. 2014:79:1-9.
doi: 10.1101/sqb.2014.79.024927. Epub 2015 May 6.

A Neural Circuit That Controls Cortical State, Plasticity, and the Gain of Sensory Responses in Mouse

Affiliations
Review

A Neural Circuit That Controls Cortical State, Plasticity, and the Gain of Sensory Responses in Mouse

Michael P Stryker. Cold Spring Harb Symp Quant Biol. 2014.

Abstract

Neurons in the visual cortex were first found to be exquisitely selective for particular properties of visual stimuli in anesthetized animals, including mice. Studies of alert mice in an apparatus that allowed them to stand or run revealed that locomotion causes a change in cortical state that dramatically increases the magnitude of responses in neurons of the visual cortex without altering selectivity, effectively changing the gain of sensory responses. Locomotion also dramatically enhances adult plasticity in the recovery from long-term visual deprivation. We have studied the elements and operation of the neural circuit responsible for the enhancement of activity and shown that it enhances plasticity even in mice not free to run. The circuit consists of projections ascending from the midbrain locomotor region (MLR) to the basal forebrain, activating cholinergic and perhaps other projections to excite inhibitory interneurons expressing vasoactive intestinal peptide (VIP) in the visual cortex. VIP cells activated by locomotion inhibit interneurons that express somatostatin (SST), thereby disinhibiting the excitatory principal neurons and allowing them to respond more strongly to effective visual stimuli. These findings reveal in alert animals how the ascending reticular activating system described in anesthetized animals 50 years ago operates to control cortical state.


Figures

Figure 1
Figure 1
Multi-site recording and analysis technology that made characterization of mouse visual cortex feasible by studying an average of more than 10 neurons simultaneously, determining cortical layer containing each recording site, and classifying spike waveforms as presumptive excitatory or inhibitory with no overlap. A. Schematic of linear multi-site probe. B. Average local field potential (LFP) responses for sixteen sites through the depth of cortex. Arrows show consecutive peaks of the high frequency oscillation. C. Current source density (CSD) analysis of traces in B reveals positions of cortical layers. D. Average spike waveforms for all units analyzed (n=231), normalized by trough depth, demonstrating narrow-spiking (blue) and broad-spiking (green) units. E. Scatter plot of spike waveform parameters for all units. Data from Niell and Stryker, 2008.
Figure 2
Figure 2
Receptive fields in normal mouse visual cortex measured by spike-triggered averaging. A–C and E–H. Examples of spatial receptive fields with two, three, and one subfield, respectively, showing varying orientation, on/off centers, and spacing of subfields. Red indicates ON responses; blue indicates OFF responses. D. Distribution of oreintation selectivity in broad-spiking (presumtive excitatory) and narrow-spiking (presumptive inhibitory) cells. H. Orientation selectivity of individual neurons in relation to cortical layer. Note that nearly all broad-spiking cells in the upper layers are highly selective. Data from Niell and Stryker, 2008.
Figure 3
Figure 3
Enhancement of visual responses by locomotion in primary visual cortex of alert mice. A. Visual response to a drifting grating as a function of direction of movement during locomotion (blue) and while stationary (red). B. Average spontaneous and visually evoked responses in all broad-spiking neurons in layers 2–4. C. Average selectivity for stimulus orientation in all broad-spiking neurons in layers 2–4. Note that locomotion increases magnitude of response without changing spontaneous activity or stimulus selectivity. Data from Niell and Stryker, 2010.
Figure 4
Figure 4
Ocular dominance plasticity during the critical period in mouse visual cortex. Top. Ocular dominance histograms showing numbers of single neurons as a function of their relative responses to the two eyes before (left, green) and after (right, red) 4 days of occlusion of vision in the contralateral eye. Bottom. Time course of the critical period of sensitivity to the effects of monocular visual deprivation (MD) in the primary visual cortex of the mouse. Data from Gordon and Stryker, 1996.
Figure 5
Figure 5
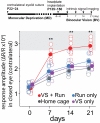
High-contrast visual stimulation during locomotion enhances recovery of visual responses from long-term monocular deprivation. Top. Experimental timeline. Bottom. Amplitude of response to contalateral eye, measured by intrinsic signal imaging, as a functions of time after re-opening following ~5 months of monocular visual deprivation beginning during the critical period. Gray bar indicates the range of response amplitudes in intact mice. Experimental condition (red) with high-contrast visual stimulation during locomotion for 4 hrs/day. Control conditions in the home cage (black), with locomotion 4 hrs/day but no high-contrast visual stimulation (blue), or with 8 hrs/day visual stimulation without locomotion in the home cage (magenta). Data from Kaneko and Stryker, 2014.
Figure 6
Figure 6
Optogenetic stimulation of excitatory neurons in the midbrain locomotor region (MLR) increases the gain of visual responses in primary visual cortex even without locomotion. A. Drawing of sagittal section showing MLR, region of channelrhodopsin transfection, and pathways projecting from MLR. Illumination through optical fiber excites MLR neuron below. B. Locomotion velocity elicited by optogenetic stimulation (green bar) at 20 Hz (red) and failure of locomotion at 10 Hz (blue). C. Increase in gamma-band local field potential in V1 with 10 Hz MLR stimulation. D. Example of increase in visual response with 10 Hz MLR stimulation, which did not elicit locomotion. E. Group data showing average increase in visual response with 10 Hz MLR stimulation. Data from Lee et al., 2014.
Figure 7
Figure 7
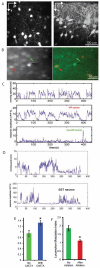
VIP cells carry the signal of locomotion to visual cortex to regulate cortical gain through inhibition of SST cells. A. VIP cells in surface view of layer 2 (left) and in coronal view (right) visualized using 2-photon microscopy in vivo of VIP-cre-Ai14 mice. B. VIP and non-VIP cells filled with Oregon Green BAPTA-AM to permit calcium recording, shown in green channel (left) and merge red and green channels (right). C. Calcium responses of a VIP- and a non-VIP-cell in relation to locomotion in the dark. D. Calcium responses of an SST-cell expressing the indicator GCaMP6 in relation to locomotion in the dark. E. Optogenetic activation of VIP-cells expressing a form of channelrhodopsin increases cotical gain (With ChETA, blue), whereas similar stimulation in VIP-cells without channelrhodopsin (No ChETA, green) does not. F. Photodynamic damage to VIP cells ((After ablation, red) blocks increase in cortical gain produced by locomotion before damage (No ablation, green). Data from Fu et al., 2014.
Figure 8
Figure 8
Blockade and activation of VIP-SST disinhibitory circuit regulate cortical plasticity. A. Expression of tetanus toxin to block synaptic release from VIP cells (green) prevents the enhancement of recovery from long-term monocular deprivation by locomotion (black). Compare to Figure 5. B. Optogenetic activation of VIP cells (VIP-ChETA, blue) during 5 days of monocular deprivation in stationary adult mice produces plasticity; similar stimulation of excitatory neurons (pyr-ChETA, magenta) or in VIP cells expressing tdTomato without channel-rhodopsin (VIP-Tdtm, red) does not. C. Expression of tetanus toxin in SST cells (TeTx, green) during 5 days of monocular deprivation in stationary adult mice produces plasticity; expression of tdTomato (Tdtm, red) does not, yielding results similar to 5-day MD in C57Bl6/J control mice (B6, magenta). ODI = Ocular dominance index of relative response to the two eyes. Data from Fu, Kaneko et al., 2015.

Similar articles

Cited by

References

    1. Antonini A, Stryker MP. Rapid remodeling of axonal arbors in the visual cortex. Science. 1993;260:1819–1821. - PubMed
    1. Antonini A, Fagiolini M, Stryker MP. Anatomical correlates of functional plasticity in mouse visual cortex. J. Neurosci. 1999;19:4388–4406. - PMC - PubMed
    1. Bear MF, Singer W. Modulation of visual cortical plasticity by acetylcholine and noradrenaline. Nature. 1986;320:172–176. - PubMed
    1. Bortone DS, Olsen SR, Scanziani M. Translaminar inhibitory cells recruited by layer 6 corticothalamic neurons suppress visual cortex. Neuron. 2014;82:474–485. - PMC - PubMed
    1. Dombeck DA, Khabbaz AN, Collman F, Adelman TL, Tank DW. Imaging large-scale neural activity with cellular resolution in awake, mobile mice. Neuron. 2007;56:43–57. - PMC - PubMed

Publication types