Differential potency of regulatory T cell-mediated immunosuppression in kidney tumors compared to subcutaneous tumors
- PMID: 25941590
- PMCID: PMC4368122
- DOI: 10.4161/21624011.2014.963395
Differential potency of regulatory T cell-mediated immunosuppression in kidney tumors compared to subcutaneous tumors
Abstract
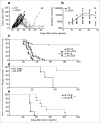
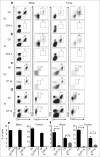
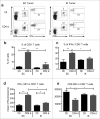
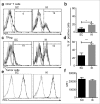
In many cancers, regulatory T cells (Treg) play a crucial role in suppressing the effector immune response thereby permitting tumor development. Indeed, in mouse models, their depletion can promote the regression of tumors of various origins, including renal cell carcinoma when located subcutaneous (SC). In the present study, we aimed to assess the importance of Treg immunosuppression in the physiologic context of metastatic renal carcinoma (Renca) disease. To that purpose we inoculated renal tumors orthotopically, intra-kidney (IK), in mice. Treg depletions were performed using anti-CD4 antibody in wild type mice or diphtheria toxin (DT) in Foxp3DTR transgenic mice. Our main observation was that Treg were not the key immunosuppressive component of the IK tumoral microenvironment, compared to the same tumors located SC. We demonstrated that the CD8+ effector immune response was still suppressed in IK tumors when compared to SC tumors, following Treg depletion. Furthermore, the level of program cell death protein (PD)-1 was increased on the surface of CD4+ T cells infiltrating IK tumors compared to SC tumors. Finally, the Treg-independent immunosuppression, occurring in IK tumors, was potent enough to inhibit regression of concomitant SC tumors, normally responsive to Treg depletion. Our findings provide further insight into the immunosuppressive nature of the immune response generated in the kidney microenvironment, suggesting that it can have additional mechanisms in addition to Treg. These observations might help to identify better targets from the kidney tumor microenvironment for future cancer therapies.
Keywords: CD, cluster of differentiation; CTLA-4, cytotoxic T lymphocyte antigen 4; DEREG, Depletion of Regulatory T cells; DT, diphtheria toxin; DTR, diphtheria toxin receptor; FCS, fetal calf serum; FR, folate receptor; Foxp3, Forkhead box protein P3; IFN, interferon; IK, intra-kidney; IL, interleukin; IP, intra-peritoneal; IV, intravenously; M2, type-2 immunosuppressive macrophages; PBS, phosphate-buffered saline; PD-1, program cell death protein 1; PD-L1, PD ligand 1; Renca Ch+ L+, Renca Cherry Luciferase; SC, subcutaneous; T regulatory cells; TCR, T cell receptor; Th, T helper cells; Treg, regulatory T cells; depletion; immunosuppression; kidney tumors; mAb, monoclonal antibody; tumor microenvironment.
Figures


Similar articles
-
Activated CTLA-4-independent immunosuppression of Treg cells disturbs CTLA-4 blockade-mediated antitumor immunity.Cancer Sci. 2023 May;114(5):1859-1870. doi: 10.1111/cas.15756. Epub 2023 Feb 26. Cancer Sci. 2023. PMID: 36762794 Free PMC article.
-
Limitations of Foxp3(+) Treg depletion following viral infection in DEREG mice.J Immunol Methods. 2014 Apr;406:58-65. doi: 10.1016/j.jim.2014.03.005. Epub 2014 Mar 15. J Immunol Methods. 2014. PMID: 24642426 Free PMC article.
-
Cross-talk between tumors can affect responses to therapy.Oncoimmunology. 2015 Jun 17;4(7):e975572. doi: 10.4161/2162402X.2014.975572. eCollection 2015 Jul. Oncoimmunology. 2015. PMID: 26140251 Free PMC article.
-
Regulatory T cells in cancer immunosuppression - implications for anticancer therapy.Nat Rev Clin Oncol. 2019 Jun;16(6):356-371. doi: 10.1038/s41571-019-0175-7. Nat Rev Clin Oncol. 2019. PMID: 30705439 Review.
-
OX40 as a novel target for the reversal of immune escape in colorectal cancer.Am J Transl Res. 2021 Mar 15;13(3):923-934. eCollection 2021. Am J Transl Res. 2021. PMID: 33841630 Free PMC article. Review.
Cited by
-
A Syngeneic Mouse Model of Metastatic Renal Cell Carcinoma for Quantitative and Longitudinal Assessment of Preclinical Therapies.J Vis Exp. 2017 Apr 12;(122):55080. doi: 10.3791/55080. J Vis Exp. 2017. PMID: 28448047 Free PMC article.
-
Immuno-Oncology: Emerging Targets and Combination Therapies.Front Oncol. 2018 Aug 23;8:315. doi: 10.3389/fonc.2018.00315. eCollection 2018. Front Oncol. 2018. PMID: 30191140 Free PMC article. Review.
-
Protean role of epigenetic mechanisms and their impact in regulating the Tregs in TME.Cancer Gene Ther. 2022 Jun;29(6):661-664. doi: 10.1038/s41417-021-00371-z. Epub 2021 Jul 28. Cancer Gene Ther. 2022. PMID: 34321625
-
Functional role of regulatory T cells in B cell lymphoma and related mechanisms.Int J Clin Exp Pathol. 2015 Aug 1;8(8):9133-9. eCollection 2015. Int J Clin Exp Pathol. 2015. PMID: 26464657 Free PMC article.
-
PD-1/PD-L1 blockade in renal cell cancer.Expert Rev Clin Immunol. 2017 Jan;13(1):77-84. doi: 10.1080/1744666X.2016.1214575. Epub 2016 Jul 28. Expert Rev Clin Immunol. 2017. PMID: 27426025 Free PMC article. Review.
References
-
- Fontenot JD, Rasmussen JP, Williams LM, Dooley JL, Farr AG, Rudensky AY. Regulatory T cell lineage specification by the forkhead transcription factor foxp3. Immunity 2005; 22:329-41; PMID:; http://dx.doi.org/10.1016/j.immuni.2005.01.016 - DOI - PubMed
-
- Malek TR, Yu A, Vincek V, Scibelli P, Kong L. CD4 regulatory T cells prevent lethal autoimmunity in IL-2Rbeta-deficient mice. Implications for the nonredundant function of IL-2. Immunity 2002; 17:167-78; PMID:; http://dx.doi.org/10.1016/S1074-7613(02)00367-9 - DOI - PubMed
-
- Sakaguchi S, Yamaguchi T, Nomura T, Ono M. Regulatory T cells and immune tolerance. Cell 2008; 133:775-87; PMID:; http://dx.doi.org/10.1016/j.cell.2008.05.009 - DOI - PubMed
-
- Berendt MJ, North RJ. T-cell-mediated suppression of anti-tumor immunity. An explanation for progressive growth of an immunogenic tumor. J Exp Med 1980; 151:69-80; PMID:; http://dx.doi.org/10.1084/jem.151.1.69 - DOI - PMC - PubMed
Publication types
LinkOut - more resources
Full Text Sources
Other Literature Sources
Research Materials
