

A study of molecular signals deregulating mismatch repair genes in prostate cancer compared to benign prostatic hyperplasia
- PMID: 25938433
- PMCID: PMC4418837
- DOI: 10.1371/journal.pone.0125560
A study of molecular signals deregulating mismatch repair genes in prostate cancer compared to benign prostatic hyperplasia
Abstract
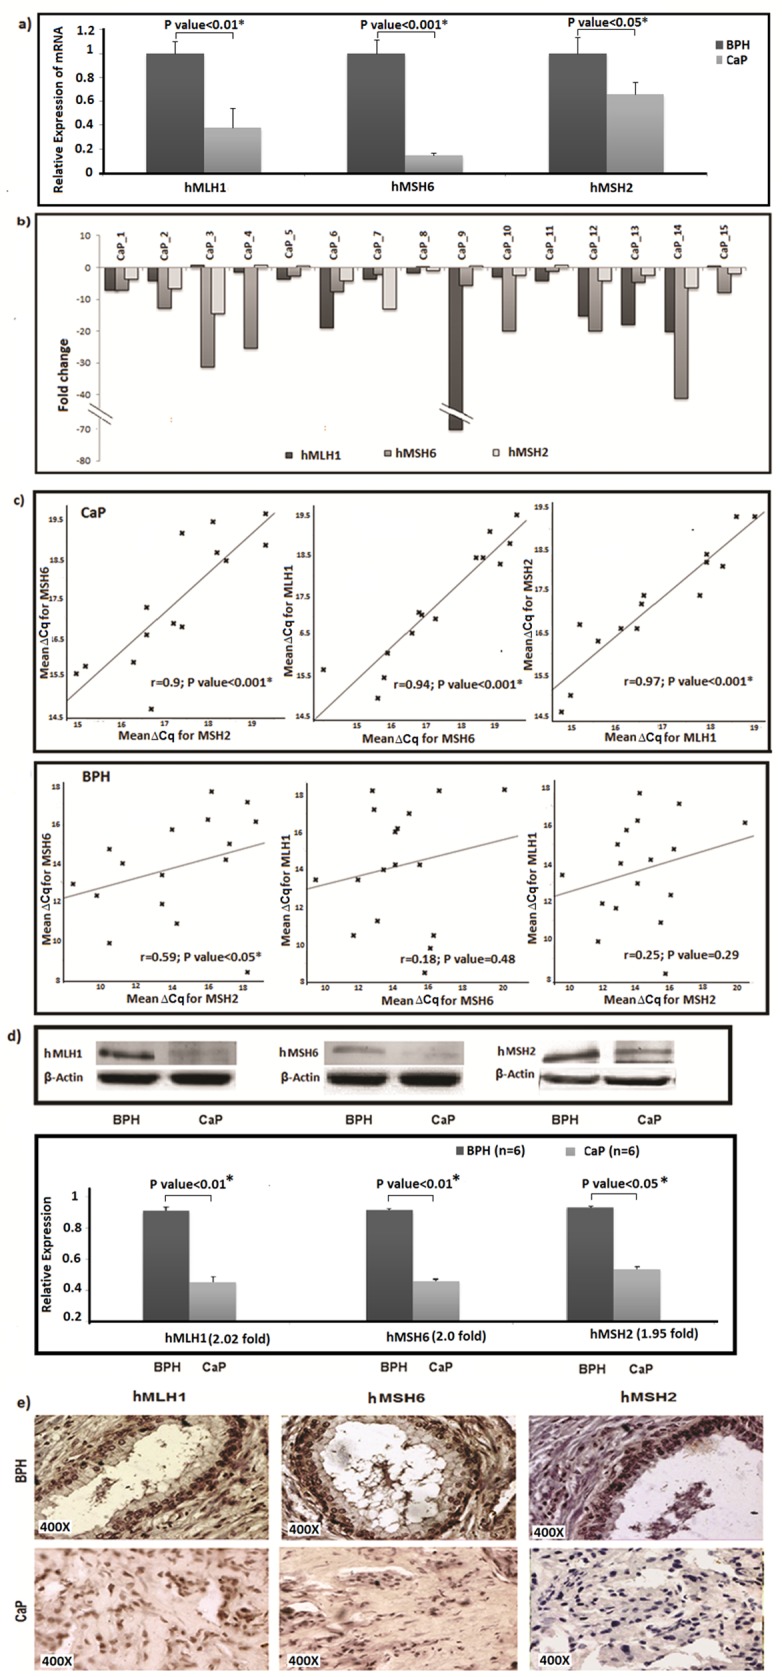
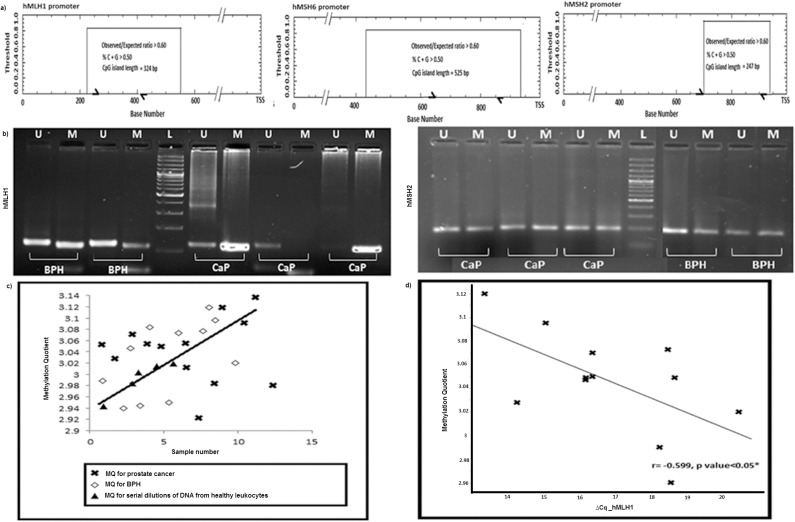
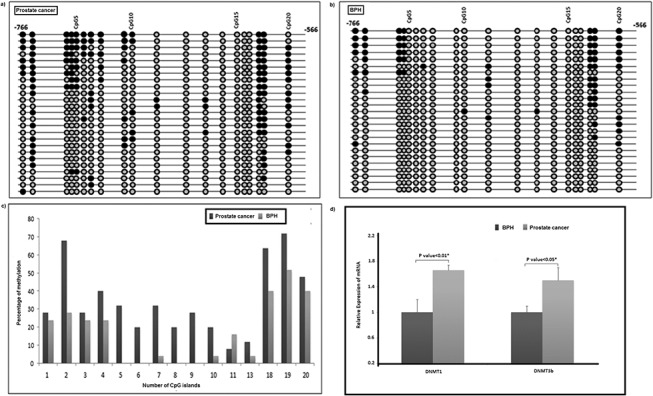
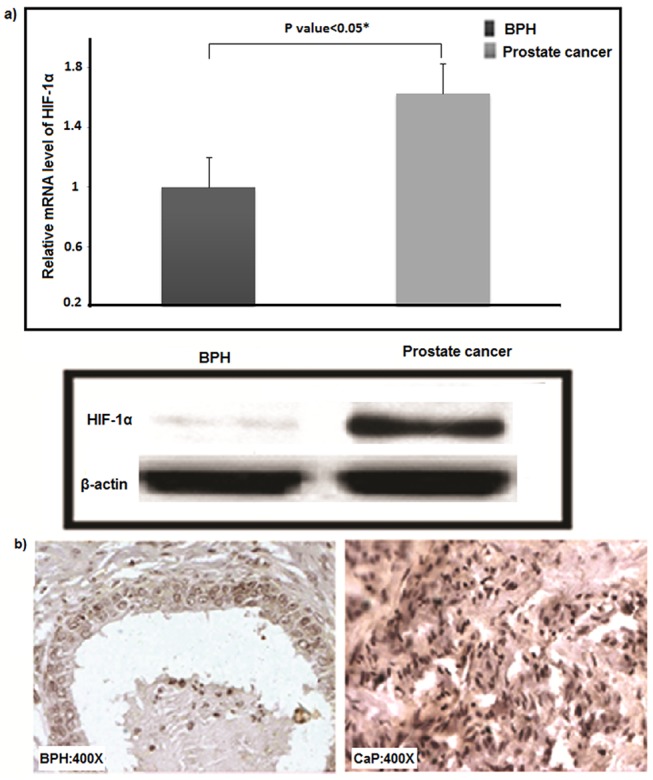
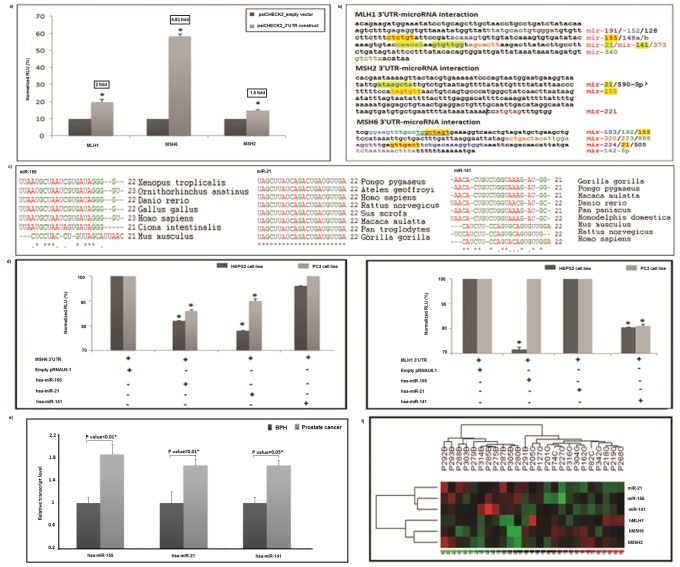
Prostate cancer is one of the leading causes of mortality among aging males. There is an unmet requirement of clinically useful biomarkers for early detection of prostate cancer to reduce the liabilities of overtreatment and accompanying morbidity. The present population-based study investigates the factors disrupting expression of multiple functionally related genes of DNA mismatch repair pathway in prostate cancer patients to identify molecular attributes distinguishing adenocarcinoma from benign hyperplasia of prostate. Gene expression was compared between tissue samples from prostate cancer and benign prostatic hyperplasia using real-time-PCR, western blot and immunohistochemistry. Assessment of genotypes of seven single-nucleotide-polymorphisms of three MMR genes was conducted using PCR-coupled RFLP and sequencing. Promoter methylation was interrogated by methylation-specific-PCR and bisulfite-sequencing. Interaction between microRNAs and MMR genes was verified by 3'UTR-based dual luciferase assays. Concurrent reduction of three MMR genes namely hMLH1, hMSH6 and hMSH2 (34-85%, P<0.05) was observed in prostate cancer tissues. hMSH6 polymorphism rs1800932(Pro92Pro) conferred a borderline protection in cancer patients (OR = 0.33, 95% CI = 0.15-0.75). Relative transcript level of hMLH1 was inversely related (r = -0.59, P<0.05) with methylation quotient of its promoter which showed a significantly higher methylation density (P = 0.008, Z = -2.649) in cancer patients. hsa-miR-155, hsa-miR-141 and hsa-miR-21 gene expressions were significantly elevated (66-85%, P<0.05) in tumor specimens and negatively correlated (r = -0.602 to -0.527, P<0.05) with that of MMR genes. hsa-miR-155 & hsa-miR-141 and hsa-miR-155 & hsa-miR-21 were demonstrated to bind to their putative seed sequences in hMLH1 and hMSH6 3'UTRs respectively. Relatively higher expression of DNA methyl-transferases (DNMT1 and DNMT3b) and HIF-1α genes (34-50%, P<0.05) were also detected in tumor tissues. This study provides statistical evidence that MMR deficiency is correlated with hypermethylation of hMLH1 promoter and upregulation of hsa-miR-155, hsa-miR-141 and hsa-miR-21 in prostate cancer. This comparative study reflects that microRNA expression level, particularly hsa-miR-155, exhibits predictive signature of prostate adenocarcinoma.
Conflict of interest statement
Figures
Similar articles
-
Gene expression profile and mutational analysis of DNA mismatch repair genes in carcinoma prostate in Indian population.OMICS. 2011 May;15(5):319-24. doi: 10.1089/omi.2010.0110. Epub 2011 Feb 24. OMICS. 2011. PMID: 21348638
-
Clinical significance of miRNA host gene promoter methylation in prostate cancer.Hum Mol Genet. 2017 Jul 1;26(13):2451-2461. doi: 10.1093/hmg/ddx138. Hum Mol Genet. 2017. PMID: 28398479
-
Concordant hypermethylation of intergenic microRNA genes in human hepatocellular carcinoma as new diagnostic and prognostic marker.Int J Cancer. 2013 Aug 1;133(3):660-70. doi: 10.1002/ijc.28068. Epub 2013 Mar 4. Int J Cancer. 2013. PMID: 23364900
-
Gene methylation in gastric cancer.Clin Chim Acta. 2013 Sep 23;424:53-65. doi: 10.1016/j.cca.2013.05.002. Epub 2013 May 10. Clin Chim Acta. 2013. PMID: 23669186 Review.
-
A MicroRNA Approach to Evaluating Elevated Prostate Cancer Risk in Cancer-Free Men.Crit Rev Eukaryot Gene Expr. 2024;34(6):61-69. doi: 10.1615/CritRevEukaryotGeneExpr.2024053672. Crit Rev Eukaryot Gene Expr. 2024. PMID: 38912963 Review.
Cited by
-
Specific nursing improves postoperative urine control function and the self-efficacy of patients undergoing radical prostatectomies.Am J Transl Res. 2022 Mar 15;14(3):1695-1704. eCollection 2022. Am J Transl Res. 2022. PMID: 35422910 Free PMC article.
-
MSH2-deficient prostate tumours have a distinct immune response and clinical outcome compared to MSH2-deficient colorectal or endometrial cancer.Prostate Cancer Prostatic Dis. 2021 Dec;24(4):1167-1180. doi: 10.1038/s41391-021-00379-4. Epub 2021 Jun 9. Prostate Cancer Prostatic Dis. 2021. PMID: 34108644
-
Deciphering the Enigmatic Influence: Non-Coding RNAs Orchestrating Wnt/β-Catenin Signaling Pathway in Tumor Progression.Int J Mol Sci. 2023 Sep 10;24(18):13909. doi: 10.3390/ijms241813909. Int J Mol Sci. 2023. PMID: 37762212 Free PMC article. Review.
-
Profiling of a panel of radioresistant prostate cancer cells identifies deregulation of key miRNAs.Clin Transl Radiat Oncol. 2017 Feb 17;2:63-68. doi: 10.1016/j.ctro.2017.01.005. eCollection 2017 Feb. Clin Transl Radiat Oncol. 2017. PMID: 29658003 Free PMC article.
-
Prostate-specific PTen deletion in mice activates inflammatory microRNA expression pathways in the epithelium early in hyperplasia development.Oncogenesis. 2017 Dec 14;6(12):400. doi: 10.1038/s41389-017-0007-5. Oncogenesis. 2017. PMID: 29284790 Free PMC article.
References
Publication types
MeSH terms
Substances
Grants and funding
LinkOut - more resources
Full Text Sources
Other Literature Sources
Medical
