

Apparent diffusion coefficient measurements and Gd-DTPA enhanced-imaging in staging hepatic fibrosis in rats
- PMID: 25932151
- PMCID: PMC4402798
Apparent diffusion coefficient measurements and Gd-DTPA enhanced-imaging in staging hepatic fibrosis in rats
Abstract
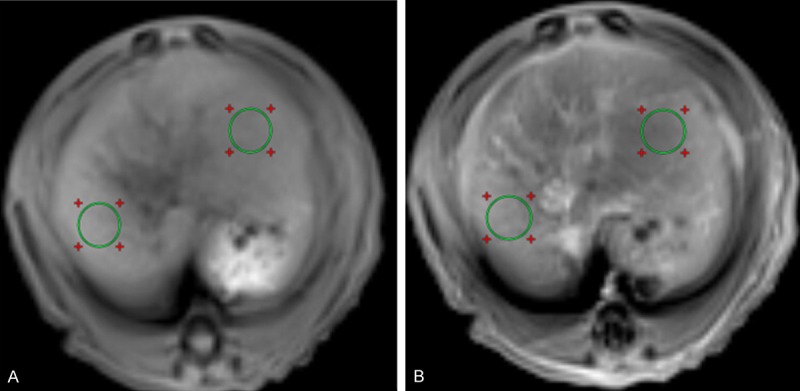
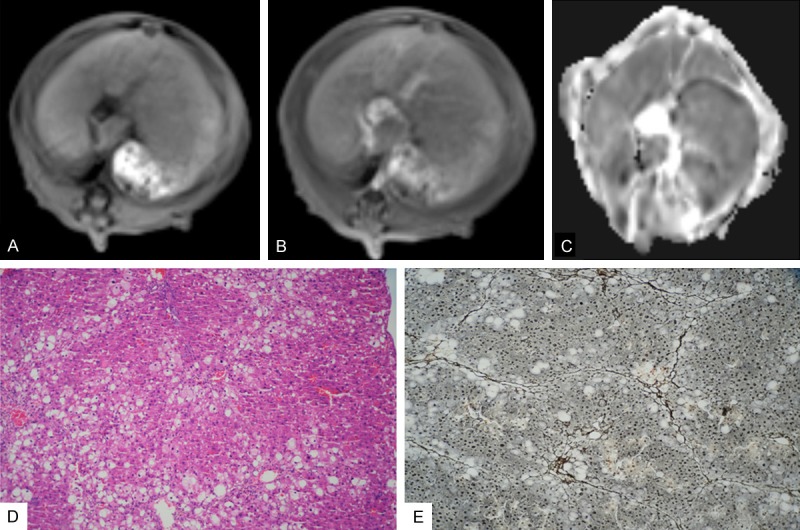
To evaluate the utility of ADC values and Gd-DTPA equilibrium phase MR imaging in staging hepatic fibrosis in rats. 48 rats were allocated into experimental and control groups. Experimental rats were subcutaneously injected with a mixture of CCl4. From 4th-12th weeks, MR images were obtained, which include pre-enhanced phase imaging, DWI and equilibrium phase imaging. Then the rat groups were subdivided according to the stages of fibrosis (S0, S1, S2, S3 and S4) after histopathological analysis. The original MRI data were forwarded to the workstation to obtain apparent diffusion coefficient (ADC) maps at b value of 500 s/mm(2). Pre-enhanced phase and equilibrium phase signal intensities and relative contrast enhancement index (RCEI) were measured as well. Lastly, the ADC values and RCEI of the experimental group were compared with each other and with the control group. All statistical analyses were carried out with SPSS, where P < 0.05 is considered to represent a significant difference. Hepatic ADC values are significantly different between the experimental and control groups (P = 0). There is a statistically significant difference between the experimental and control groups on RCEI (P = 0). Comparing the S1, S2, S3 and S4 groups, there is a statistically significant difference between the mild group (S1 and S2) and the severe group (S4) in terms of ADC values and RCEI (all P < 0.05). A statistically significant difference is also found between the moderate group (S3) and the severe group in ADC values. As the degree of fibrosis increases, there are a reduction in ADC values and an increase in RCEI. Comparing the groups with ADC values and enhancement index, there are statistically significant differences in sensitivity and specificity on diagnosis of hepatic fibrosis. The ADC values have the best sensitivity (93.1%) and specificity (83.3%). Quantitative ADC values and RCEI may be helpful to the staging of rat fibrosis, but their application in human is controversial.
Keywords: Hepatic fibrosis staging; apparent diffusion coefficient; equilibrium phase imaging; magnetic resonance imaging; rat model.
Figures


Similar articles
-
[A pilot study of hepatic fibrosis with magnetic resonance diffusion-weighted imaging in a rabbit model].Zhonghua Gan Zang Bing Za Zhi. 2008 Jul;16(7):500-4. Zhonghua Gan Zang Bing Za Zhi. 2008. PMID: 18647527 Chinese.
-
The hepatocyte phase of Gd-EOB-DTPA-enhanced MRI in the evaluation of hepatic fibrosis and early liver cirrhosis in a rat model: an experimental study.Life Sci. 2014 Jul 17;108(2):104-8. doi: 10.1016/j.lfs.2014.05.016. Epub 2014 May 29. Life Sci. 2014. PMID: 24881519
-
[Correlation between the mRNA expression of tissue inhibitor of metalloproteinase-1 and apparent diffusion coefficient on diffusion-weighted imaging in rats' liver fibrosis].Zhong Nan Da Xue Xue Bao Yi Xue Ban. 2017 Feb 28;42(2):161-167. doi: 10.11817/j.issn.1672-7347.2017.02.007. Zhong Nan Da Xue Xue Bao Yi Xue Ban. 2017. PMID: 28255117 Chinese.
-
Comparison of the DWI and Gd-EOB-DTPA-enhanced MRI on assessing the hepatic ischemia and reperfusion injury after partial hepatectomy.Biomed Pharmacother. 2017 Feb;86:118-126. doi: 10.1016/j.biopha.2016.11.123. Epub 2016 Dec 9. Biomed Pharmacother. 2017. PMID: 27951418
-
Prediction of high-stage liver fibrosis using ADC value on diffusion-weighted imaging and quantitative enhancement ratio at the hepatobiliary phase of Gd-EOB-DTPA-enhanced MRI at 1.5 T.Acta Radiol. 2018 May;59(5):509-516. doi: 10.1177/0284185117725778. Epub 2017 Aug 30. Acta Radiol. 2018. PMID: 28853292
References
-
- Safadi R, Zigmond E, Pappo O, Shalev Z, Ilan Y. Amelioration of hepatic fibrosis via beta-glucosylceramide-mediated immune modulation is associated with altered CD8 and NKT lymphocyte distribution. Int Immunol. 2007;19:1021–1029. - PubMed
-
- Afdhal NH, Nunes D. Evaluation of liver fibrosis: a concise review. Am J Gastroenterol. 2004;99:1160–1174. - PubMed
-
- Cadranel JF, Rufat P, Degos F. Practices of liver biopsy in France: results of a prospective nationwide survey. For the Group of Epidemiology of the French Association for the Study of the Liver (AFEF) Hepatology. 2000;32:477–481. - PubMed
-
- Koinuma M, Ohashi I, Hanafusa K, Shibuya H. Apparent diffusion coefficient measurements with diffusion-weighted magnetic resonance imaging for evaluation of hepatic fibrosis. J Magn Reson Imaging. 2005;22:80–5. - PubMed
-
- Lim AK, Patel N, Eckersley RJ, Kuo YT, Goldin RD, Thomas HC, Cosgrove DO, Taylor-Robinson SD, Blomley MJ. Can Doppler sonography grade the severity of hepatitis C-related liver disease? AJR Am J Roentgenol. 2005;184:1848–53. - PubMed
LinkOut - more resources
Full Text Sources
Research Materials