

Key determinants of target DNA recognition by retroviral intasomes
- PMID: 25924943
- PMCID: PMC4422553
- DOI: 10.1186/s12977-015-0167-3
Key determinants of target DNA recognition by retroviral intasomes
Abstract
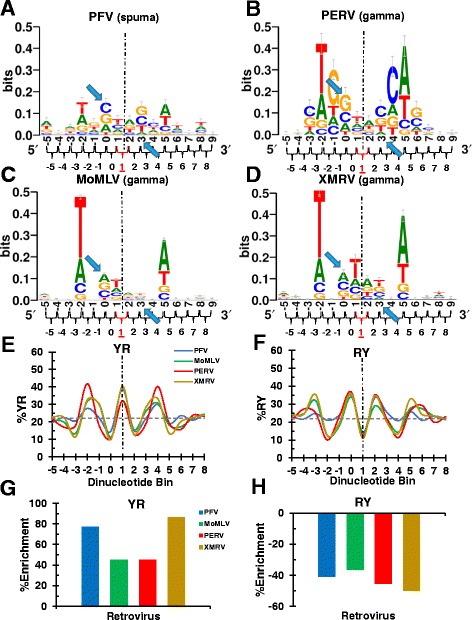
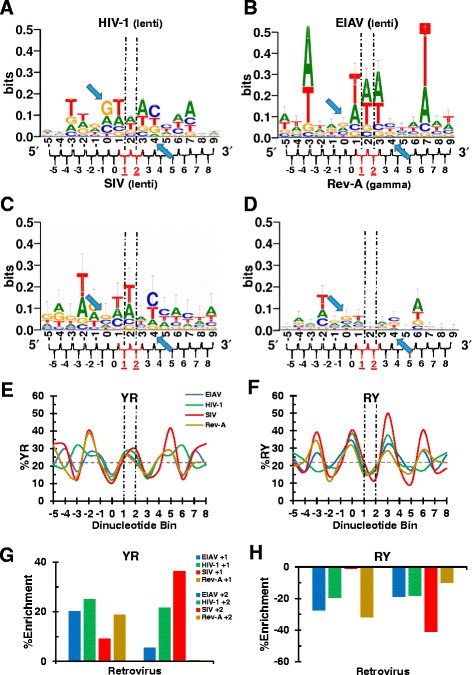
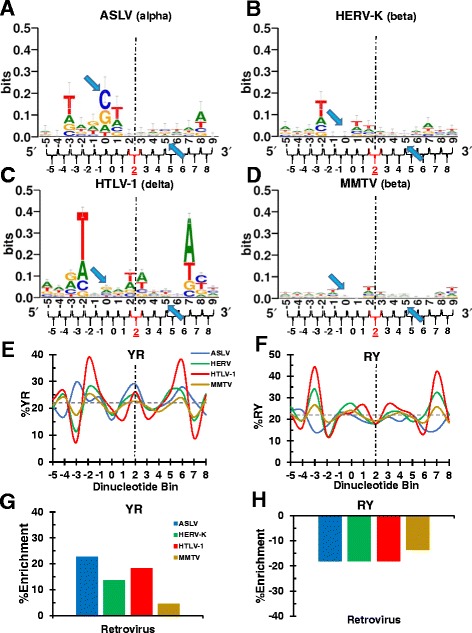
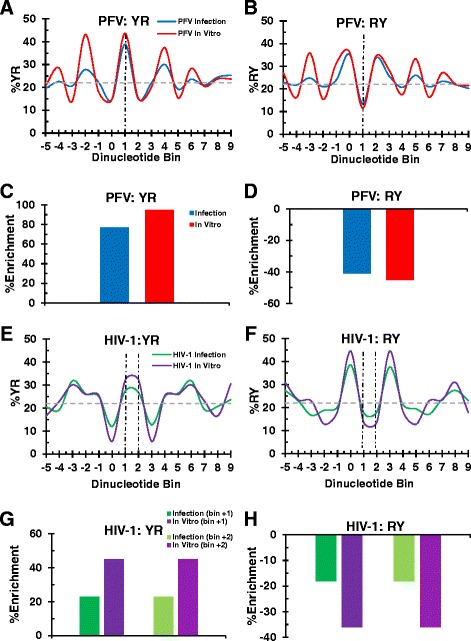
Background: Retroviral integration favors weakly conserved palindrome sequences at the sites of viral DNA joining and generates a short (4-6 bp) duplication of host DNA flanking the provirus. We previously determined two key parameters that underlie the target DNA preference for prototype foamy virus (PFV) and human immunodeficiency virus type 1 (HIV-1) integration: flexible pyrimidine (Y)/purine (R) dinucleotide steps at the centers of the integration sites, and base contacts with specific integrase residues, such as Ala188 in PFV integrase and Ser119 in HIV-1 integrase. Here we examined the dinucleotide preference profiles of a range of retroviruses and correlated these findings with respect to length of target site duplication (TSD).
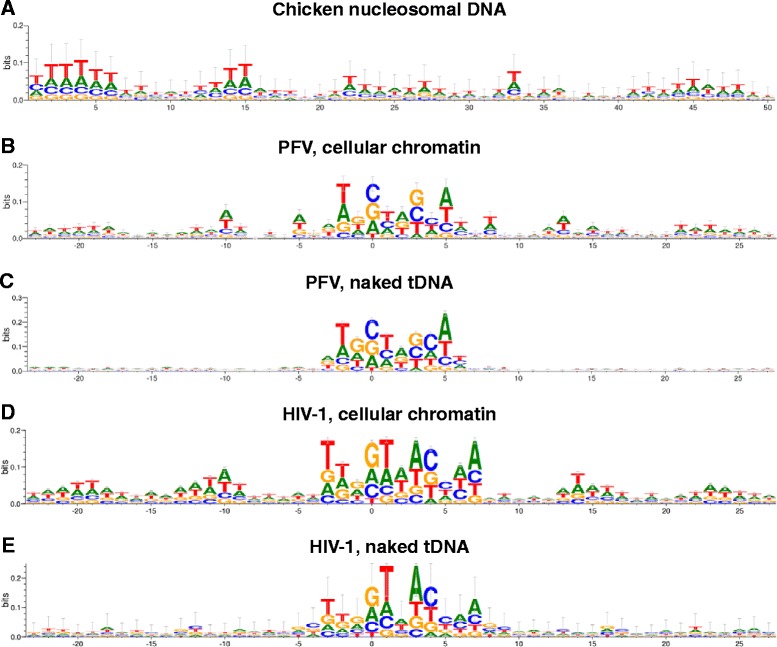
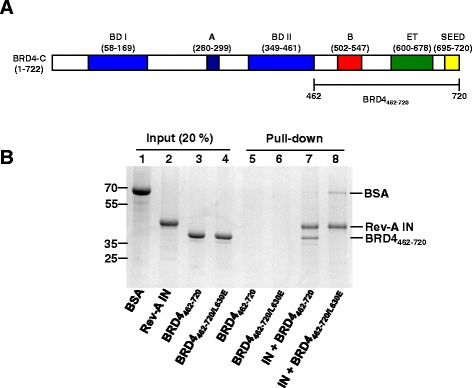
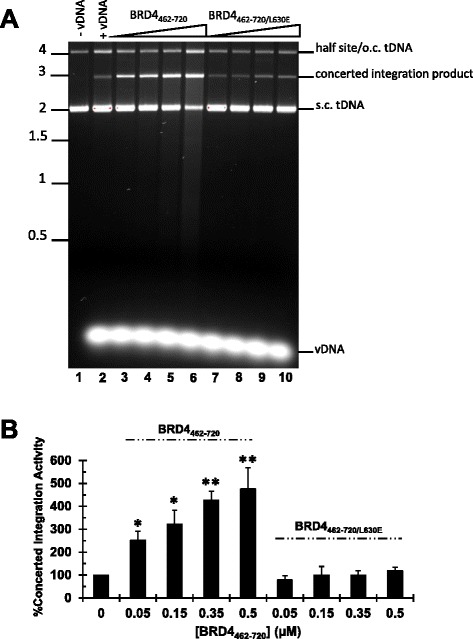
Results: Integration datasets covering six viral genera and the three lengths of TSD were accessed from the literature or generated in this work. All viruses exhibited significant enrichments of flexible YR and/or selection against rigid RY dinucleotide steps at the centers of integration sites, and the magnitude of this enrichment inversely correlated with TSD length. The DNA sequence environments of in vivo-generated HIV-1 and PFV sites were consistent with integration into nucleosomes, however, the local sequence preferences were largely independent of target DNA chromatinization. Integration sites derived from cells infected with the gammaretrovirus reticuloendotheliosis virus strain A (Rev-A), which yields a 5 bp TSD, revealed the targeting of global chromatin features most similar to those of Moloney murine leukemia virus, which yields a 4 bp duplication. In vitro assays revealed that Rev-A integrase interacts with and is catalytically stimulated by cellular bromodomain containing 4 protein.
Conclusions: Retroviral integrases have likely evolved to bend target DNA to fit scissile phosphodiester bonds into two active sites for integration, and viruses that cut target DNA with a 6 bp stagger may not need to bend DNA as sharply as viruses that cleave with 4 bp or 5 bp staggers. For PFV and HIV-1, the selection of signature bases and central flexibility at sites of integration is largely independent of chromatin structure. Furthermore, global Rev-A integration is likely directed to chromatin features by bromodomain and extraterminal domain proteins.
Figures
Similar articles
-
Integrase residues that determine nucleotide preferences at sites of HIV-1 integration: implications for the mechanism of target DNA binding.Nucleic Acids Res. 2014 Apr;42(8):5164-76. doi: 10.1093/nar/gku136. Epub 2014 Feb 11. Nucleic Acids Res. 2014. PMID: 24520116 Free PMC article.
-
Biochemical characterization of novel retroviral integrase proteins.PLoS One. 2013 Oct 4;8(10):e76638. doi: 10.1371/journal.pone.0076638. eCollection 2013. PLoS One. 2013. PMID: 24124581 Free PMC article.
-
Assembly of prototype foamy virus strand transfer complexes on product DNA bypassing catalysis of integration.Protein Sci. 2012 Dec;21(12):1849-57. doi: 10.1002/pro.2166. Epub 2012 Oct 26. Protein Sci. 2012. PMID: 23011895 Free PMC article.
-
Retroviral integrase proteins and HIV-1 DNA integration.J Biol Chem. 2012 Nov 30;287(49):40858-66. doi: 10.1074/jbc.R112.397760. Epub 2012 Oct 5. J Biol Chem. 2012. PMID: 23043109 Free PMC article. Review.
-
Structural insights into the retroviral DNA integration apparatus.Curr Opin Struct Biol. 2011 Apr;21(2):249-56. doi: 10.1016/j.sbi.2010.12.005. Epub 2011 Feb 1. Curr Opin Struct Biol. 2011. PMID: 21277766 Review.
Cited by
-
Strategies for Targeting Retroviral Integration for Safer Gene Therapy: Advances and Challenges.Front Mol Biosci. 2021 May 12;8:662331. doi: 10.3389/fmolb.2021.662331. eCollection 2021. Front Mol Biosci. 2021. PMID: 34055882 Free PMC article. Review.
-
rigrag: high-resolution mapping of genic targeting preferences during HIV-1 integration in vitro and in vivo.Nucleic Acids Res. 2021 Jul 21;49(13):7330-7346. doi: 10.1093/nar/gkab514. Nucleic Acids Res. 2021. PMID: 34165568 Free PMC article.
-
Structural basis of host protein hijacking in human T-cell leukemia virus integration.Nat Commun. 2020 Jun 19;11(1):3121. doi: 10.1038/s41467-020-16963-6. Nat Commun. 2020. PMID: 32561747 Free PMC article.
-
Integration and Fixation Preferences of Human and Mouse Endogenous Retroviruses Uncovered with Functional Data Analysis.PLoS Comput Biol. 2016 Jun 16;12(6):e1004956. doi: 10.1371/journal.pcbi.1004956. eCollection 2016 Jun. PLoS Comput Biol. 2016. PMID: 27309962 Free PMC article.
-
Clonal expansion of SIV-infected cells in macaques on antiretroviral therapy is similar to that of HIV-infected cells in humans.PLoS Pathog. 2019 Jul 10;15(7):e1007869. doi: 10.1371/journal.ppat.1007869. eCollection 2019 Jul. PLoS Pathog. 2019. PMID: 31291371 Free PMC article.
References
-
- Fujiwara T, Mizuuchi K. Retroviral DNA integration: structure of an integration intermediate. Cell. 1988;54:497–504. - PubMed
-
- Roth MJ, Schwartzberg PL, Goff SP. Structure of the termini of DNA intermediates in the integration of retroviral DNA: dependence on IN function and terminal DNA sequence. Cell. 1989;58:47–54. - PubMed
Publication types
MeSH terms
Substances
Grants and funding
LinkOut - more resources
Full Text Sources
Other Literature Sources
Research Materials
