. 2015 Apr 30:12:38.
doi: 10.1186/s12977-015-0164-6.

Impaired Th17 polarization of phenotypically naive CD4(+) T-cells during chronic HIV-1 infection and potential restoration with early ART

Affiliations

Impaired Th17 polarization of phenotypically naive CD4(+) T-cells during chronic HIV-1 infection and potential restoration with early ART

Sandrina DaFonseca et al. Retrovirology. .

Abstract

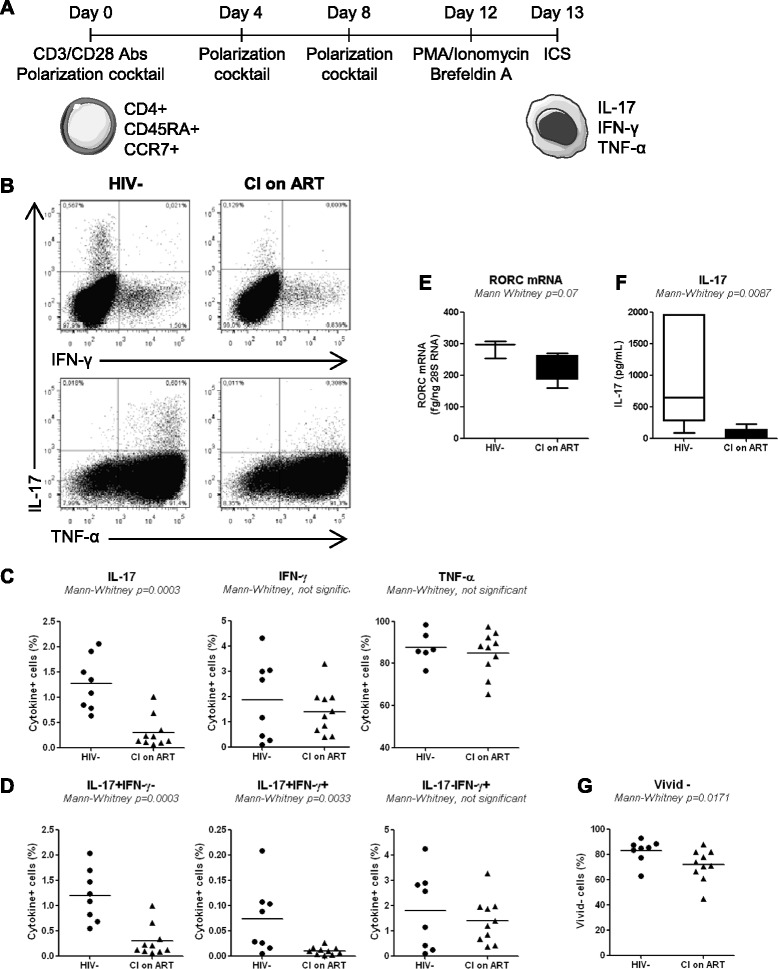
Background: Depletion of mucosal Th17 cells during HIV/SIV infections is a major cause for microbial translocation, chronic immune activation, and disease progression. Mechanisms contributing to Th17 deficit are not fully elucidated. Here we investigated alterations in the Th17 polarization potential of naive-like CD4(+) T-cells, depletion of Th17-commited subsets during HIV pathogenesis, and Th17 restoration in response to antiretroviral therapy (ART).

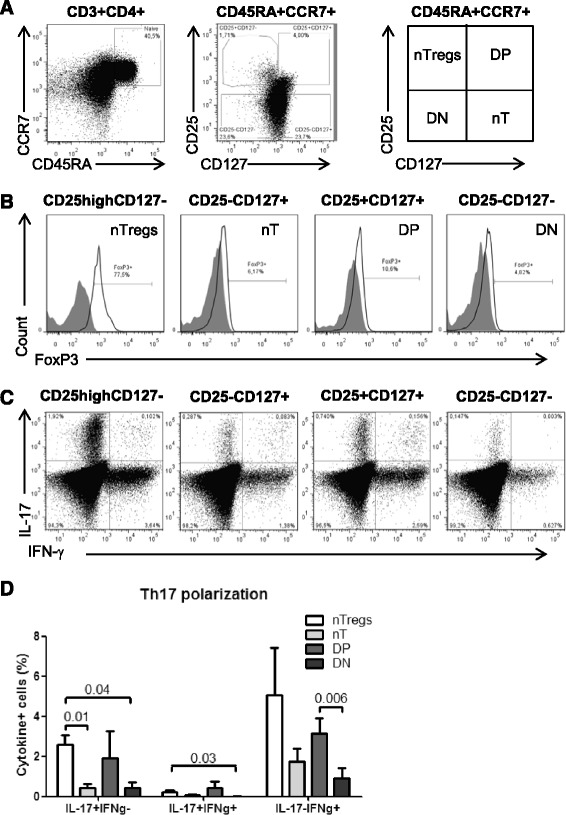
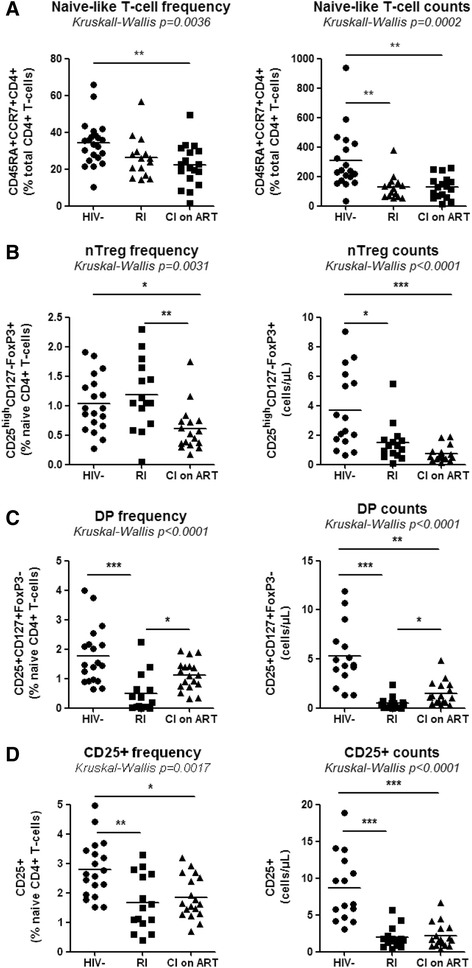
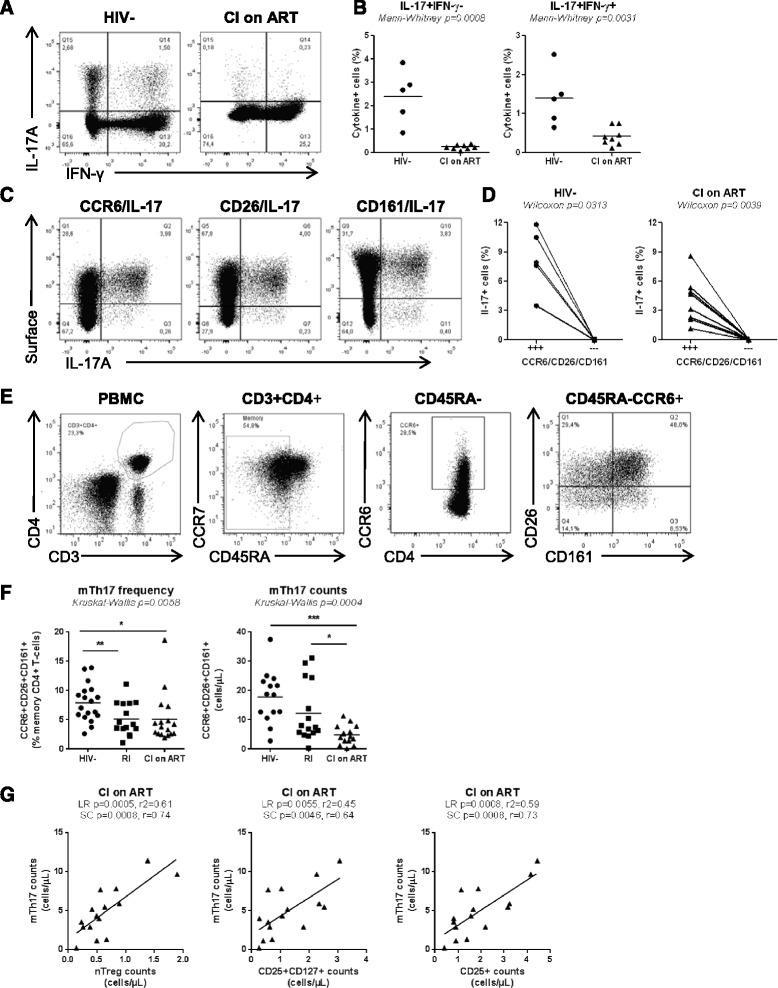
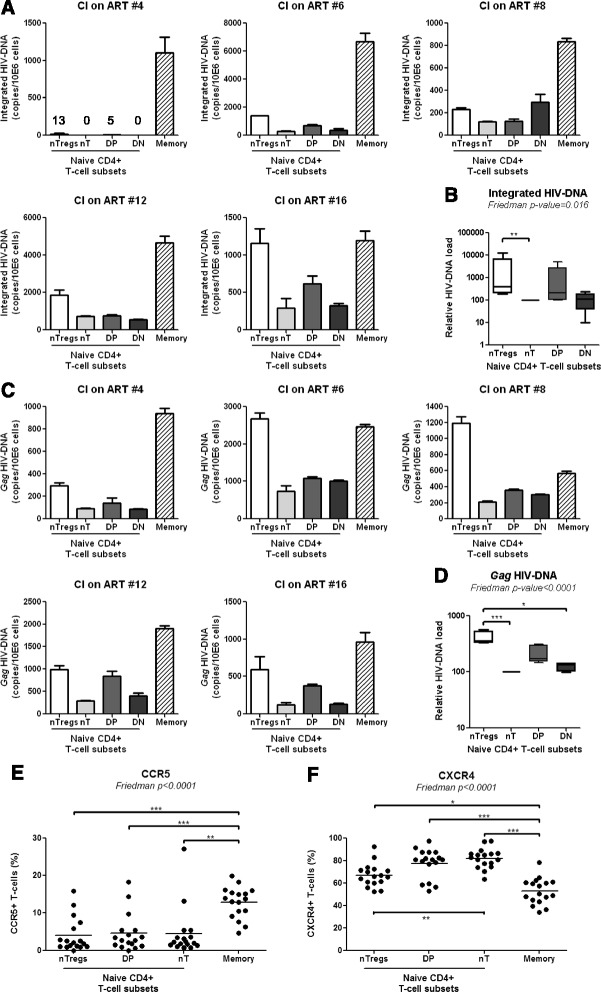
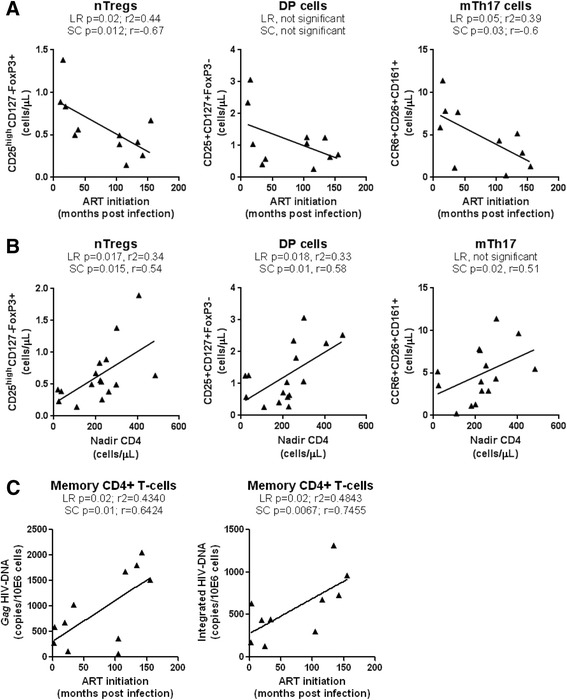
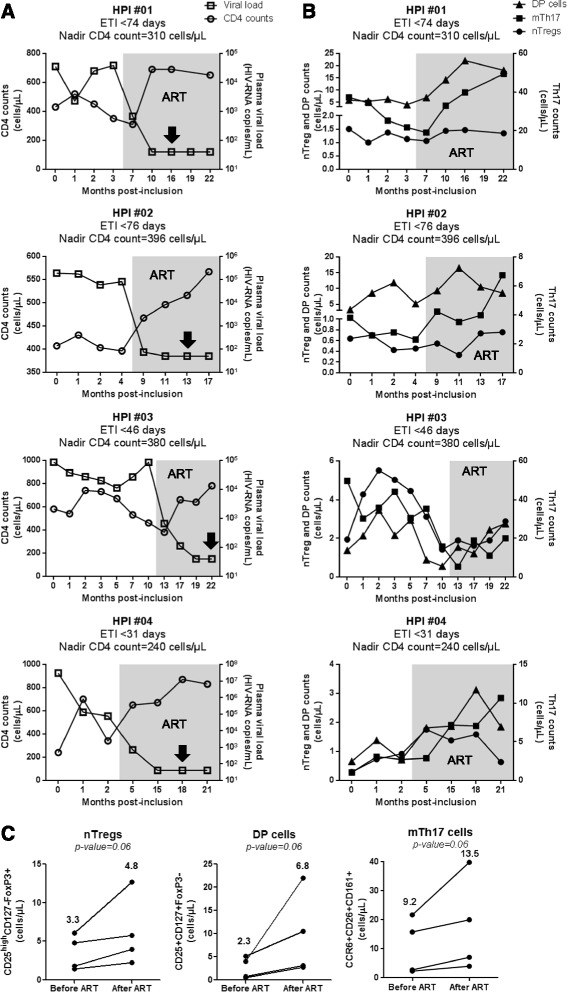
Results: Peripheral blood CD4(+) T-cells expressing a naive-like phenotype (CD45RA(+)CCR7(+)) from chronically HIV-infected subjects receiving ART (CI on ART; median CD4 counts 592 cells/μl; viral load: <50 HIV-RNA copies/ml; time since infection: 156 months) compared to uninfected controls (HIV-) were impaired in their survival and Th17 polarization potential in vitro. In HIV- controls, IL-17A-producing cells mainly originated from naive-like T-cells with a regulatory phenotype (nTregs: CD25(high)CD127(-)FoxP3(+)) and from CD25(+)CD127(+)FoxP3(-) cells (DP, double positive). Th17-polarized conventional naive CD4(+) T-cells (nT: CD25(-)CD127(+)FoxP3(-)) also produced IL17A, but at lower frequency compared to nTregs and DP. In CI on ART subjects, the frequency/counts of nTreg and DP were significantly diminished compared to HIV- controls, and this paucity was further associated with decreased proportions of memory T-cells producing IL-17A and expressing Th17 markers (CCR6(+)CD26(+)CD161(+), mTh17). nTregs and DP compared to nT cells harbored superior levels of integrated/non-integrated HIV-DNA in CI on ART subjects, suggesting that permissiveness to integrative/abortive infection contributes to impaired survival and Th17 polarization of lineage-committed cells. A cross-sectional study in CI on ART subjects revealed that nTregs, DP and mTh17 counts were negatively correlated with the time post-infection ART was initiated and positively correlated with nadir CD4 counts. Finally, a longitudinal analysis in a HIV primary infection cohort demonstrated a tendency for increased nTreg, DP, and mTh17 counts with ART initiation during the first year of infection.

Conclusions: These results support a model in which the paucity of phenotypically naive nTregs and DP cells, caused by integrative/abortive HIV infection and/or other mechanisms, contributes to Th17 deficiency in HIV-infected subjects. Early ART initiation, treatment intensification with integrase inhibitors, and/or other alternative interventions aimed at preserving/restoring the pool of cells prone to acquire Th17 functions may significantly improve mucosal immunity in HIV-infected subjects.


Figures

Figure 1
Figure 1
Phenotypically naive CD4+ T-cells from CI on ART subjects are impaired in their Th17-polarization potential in vitro. Total CD4+ T-cells were isolated by negative selection using magnetic beads (Miltenyi) and stained with a cocktail of CD8, CD19, CD56, CD45RA, and CCR7 Abs and the viability dye Vivid. (A) Shown is the schematic experimental design. Briefly, naive-like CD4+ T-cells (CD45RA+CCR7+ phenotype) lacking CD8, CD19, and CD56 expression, were sorted by flow cytometry (as in Additional file 1: Figure S1) and stimulated via CD3/CD28 under Th17 polarizing conditions for 12 days. Media containing polarizing cytokines and Abs together with IL-2 was refreshed at day 4 and 8 post-culture. At day 12, cells were stimulated with PMA and Ionomycin in the presence of Brefeldin A for 17 hours. Cells were analyzed by flow cytometry for cytokine expression upon intracellular staining with specific Abs. Vivid-positive cells were excluded from the analysis. (B) Shown is the frequency of cells expressing intracellular IL-17A, IFN-γ, and/or TNF-α in representative HIV- control and CI on ART subject. (C-D) Shown are statistical analysis of single cytokine expression (C) and cytokine co-expression (D) in Th17-polarized cells from HIV- controls (n = 8) and CI on ART (n = 10) subjects. (E-F) At day 8 of polarization cell pellets and culture supernatants were harvested for the quantification of RORC mRNA (n = 3 HIV- and n = 5 CI on ART) and IL-17A production (n = 6 HIV- and n = 6 CI on ART), respectively. The Mann Whitney p-values are indicated on the graphs. (G) Shown is statistical analysis of cell viability. Each symbol represents a different subject. The Mann–Whitney p-values are indicated on the graphs. Clinical parameters of subjects included in these studies are included in Table 1 (HIV- #03, 06, 07, 09, 14, 15, 19, 22) and Table 3 (CI #03, 04, 06–10, 16–18).
Figure 2
Figure 2
Phenotypically naive CD25highCD127FoxP3+ and CD25+CD127+FoxP3 T-cells preferentially differentiate into Th17 cells. PBMCs from HIV- controls were stained with a cocktail of CD3, CD4, CD45RA, CCR7, CD25 and CD127 Abs on the surface and intracellularly with FoxP3 Abs. (A) The differential expression of CD25 and CD127 distinguished four CD45RA+CCR7+ CD4+ T-cells subsets: CD25highCD127 (nTregs), CD25CD127+ (nT, conventional), CD25+CD127+ (DP, double positive) and CD25CD127 (DN, double negative). (B) Shown is the expression of FoxP3 on these four subsets. (C-D) The four CD45RA+CCR7+ T-cell subsets were sorted by flow cytometry as in Additional file 2: Figure S2, stimulated via CD3/CD28, and cultivated under Th17 polarizing conditions and assessed for the co-expression of IL-17A and IFN-γ as in Figure 1. Vivid staining was used to exclude dead cells. (A-C) Results are from one donor representative of experiments performed with cells from n = 4 donors. (D) Shown are statistical analysis of Th17-polarized nTregs (n = 4), nT (n = 4), DP (n = 3), and DN cells (n = 3) with differential expression of IL-17A and IFN-γ. Paired t-Test p-values are indicated on the graph. Clinical parameters of subjects included in these studies are included in Table 1 (HIV- # 3, 5, 6, 15).
Figure 3
Figure 3
Alterations in the frequency of phenotypically naive CD4+ T-cell subsets in HIV-infected subjects. PBMCs from HIV- controls and HIV-infected subjects, RI and CI on ART, were analyzed for the frequency of total CD45RA+CCR7+CD4+ T-cells (naive-like) and with a CD25highCD127FoxP3+ (nTregs) or CD25+CD127+FoxP3 (DP) phenotype, together with the frequency and counts of total CD25+ T-cells. Cells were gated as in Figure 2. The viability dye Vivid was used to exclude dead cells. (A-D) Shown are the frequency (left panel) and counts (right panel) of total naive-like (A), nTregs (B), DP cells (C), and total CD25+ T-cells (D) in the peripheral blood of HIV- (n = 19), RI (n = 15) and CI on ART (n = 18) subjects. Each symbol represents a different subject. The counts of CD45RA+CCR7+ subsets were calculated relative to their frequency and the CD4 counts. The Kruskal-Wallis and Dunns post-test p-values are indicated on the graphs (*, p < 0.05; **, p < 0.01; ***, p < 0.001). Clinical parameters of subjects used in these studies are included in Table 1(HIV- #01-03, 05, 07, 09–18, 20–23), Table 2 (RI# 1–15), and Table 3 (CI #01, 03–18).
Figure 4
Figure 4
Altered frequency of memory Th17 during HIV infection in relationship with the paucity of naive-like nTreg and DP cells. (A-D) Memory CD4+ T-cells isolated by negative selection using magnetic beads (Miltenyi) were stimulated with PMA/Ionomycin and brefeldin A for 5 hours. Shown are: (A) representative flow cytometry dot plots illustrating IL-17A and IFN-γ expression on CD3+CD8 T-cells from one HIV- and one CI on ART; (B) statistical analysis of the frequency of IL-17A+IFN-γ and IL-17A+IFN-γ+ cells in HIV- controls (n = 5; Table 1, HIV- #2, 10, 14, 31, 32) versus CI on ART subject (n = 8; Table 3, CI #3, 7–11, 14, 18); (C) the co-expression of CCR6, CD26 and CD161 with IL-17A in one representative HIV- control; and (D) statistical analysis for the frequency of IL-17A-expressing cells within CD3+CD8 T-cells co-expressing (+++) or lacking (---) CCR6, CD26, and CD161. (E) Shown is the gating strategy for memory CD4+ T-cells (CD45RA) with a mTh17 (CCR6+CD26+CD161+) phenotype in one representative donor. (F) The frequency and counts of mTh17 cells were analyzed in HIV- (n = 18; Table 1, HIV- #1-3, 5, 9–18, 20–23), RI (n = 15, Table 2, RI 11–15), and CI on ART (n = 17; Table 3, CI #1-12, 14–18) subjects. Each symbol represents a different subject. The (B) Mann–Whitney, (D) Wilcoxon, and (F) Kruskal-Wallis and Dunns post test p-values are indicated on the graphs (*, p < 0.05; **, p < 0.01; ***, p < 0.001). (G) Linear regression (LR) and Spearman correlation (SC) models were applied to determine the relationship between mTh17 cell counts and the counts of nTregs (left panel), DP (middle panel) and total naive-like CD25+ T-cells (right panel) in CI on ART. LR p and r2 and SC p and r values are indicated on the graphs. For studies in Figure 4G, subjects were identical to those included in Figure 4 F for which matched samples were available.
Figure 5
Figure 5
nTregs and DP cells exhibit superior permissiveness to infection. Matched total memory (CD45RA) and the four subsets of CD45RA+CCR7+ CD4+ T-cells (nTregs, nT, DP, and DN cells) were isolated by flow cytometry from the PBMCs of CI on ART subjects as in Additional file 1 and 2: Figure S1-S2, respectively. Levels of integrated (A) and Gag (C) HIV-DNA were quantified by real-time PCR (equivalent of 105 cells/test in triplicates) in matched samples from five CI on ART subjects (Table 3, CI #4, 6, 8, 12, 16). HIV-DNA copies were normalized to CD3 levels and expressed as HIV-DNA copies/106 cells. (A, C) Shown are results from individuals donors. (B, D) Shown are statistical analysis of relative integrated and Gag HIV-DNA levels in naive T-cell subsets (mean ± SD, n = 4); HIV-DNA levels in conventional naive cells (nT) were considered 100%. (E-F) PBMCs from HIV-uninfected subjects (n = 17) were stained on the surface with CD3, CD4, CD45RA, CCR7, CD25, CD127, and CCR5 or CXCR4 Abs. The viability dye Vivid was used to exclude dead cells. The nTregs, nT, and DP cells (identified as in Figure 2A), together with total memory CD4+ T-cells (identified as in Figure 4E), were analyzed for the expression of CCR5 and CXCR4. Shown are the frequencies of CCR5+ (E) and CXCR4+ (F) T-cells within each subset of HIV-uninfected subjects (n = 17; Table 1, HIV- #1,2,5,10,14,15,18,20,21,23-30). The Friedman and Dunns’ post-test p-values are indicated on the graphs (*, p < 0.05; **, p < 0.01; ***, p < 0.001).
Figure 6
Figure 6
Effect of early ART initiation on the pool of nTregs, DP, and mTh17 cells. The nTregs, DP, and memory Th17 cells were phenotypically identified as in Figure 2A-B and Figure 4E, respectively. CD4 counts in CI on ART subjects are listed in Table 2. (A) LR and SC models were applied to determine the relationship between the time of ART initiation (months post-infection) versus nTreg counts (left panel), DP counts (middle panel), and Th17 counts (right panel) in CI on ART subjects (n = 11; Table 3, CI #1, 4–7, 9–12, 14–15). (B) LR and SC models were applied to determine the relationship between the nadir CD4 counts versus nTreg counts (left panel), DP counts (middle panel), and Th17 counts (right panel) in CI on ART subjects (n = 16; Table 3, CI #1, 3–12, 14–18). (C) Levels of Gag and integrated HIV-DNA were quantified by real time PCR in total memory CD4+ T-cells sorted by FACS as in Additional file 1: Figure S1 from CI on ART subjects (n = 11). LR and SC models were applied to determine the relationship between the levels of Gag (left panel) and integrated (right panel) HIV-DNA versus the time of ART initiation (months post-infection) in CI on ART subjects (n = 11). LR p and r2 values together with SC p and r values are indicated on the graphs.
Figure 7
Figure 7
Longitudinal analysis of nTregs, DP, and mTh17 cell dynamics in HIV-infected subjects. Four HIV-infected subjects participating to the HIV Primary infection (HPI) cohort were analyzed longitudinally for the frequency and counts of nTregs, DP, and memory Th17 cells in the peripheral blood in relationship with plasma viral load and CD4 counts. Cell subsets were phenotypically identified as in Figure 2A-B and Figure 4E. The counts of nTregs, DP, and memory Th17 cells were calculated relative to their frequency and the CD4 counts. (A) Shown are the dynamics of CD4 counts (open circles) and plasma viral load (open squares) before and after ART initiation (grey quadrant). (B) Shown are the dynamics of nTreg (filled circles), DP cell (filled triangles) and memory Th17 counts (filled squares) before and after ART initiation (grey quadrant). The estimated time of infection (ETI) and the nadir CD4 count for each subject are indicated on the graphs. (C) Shown is statistical analyses of nTreg (left panel), DP (middle panel), and mTh17 cell counts (right panel) before and after ART. The “after ART” time points are indicated for each patient by a black arrow (A) and correspond to the second time point of the patient visit when plasma viral load was undetectable (<50 HIV-RNA copies/ml). Each symbol represents a different subject. Wilcoxon p-values are indicated on the graphs. Indicated in bold are median cell counts values before and after ART.

Similar articles

Cited by

References

    1. Kotler DP. Characterization of intestinal disease associated with human immunodeficiency virus infection and response to antiretroviral therapy. J Infect Dis. 1999;179(Suppl 3):S454–6. doi: 10.1086/314803. - DOI - PubMed
    1. Veazey RS, Lackner AA. Getting to the guts of HIV pathogenesis. J Exp Med. 2004;200:697–700. doi: 10.1084/jem.20041464. - DOI - PMC - PubMed
    1. Brenchley JM, Douek DC. Microbial translocation across the GI tract. Annu Rev Immunol. 2012;30:149–73. doi: 10.1146/annurev-immunol-020711-075001. - DOI - PMC - PubMed
    1. Klatt NR, Brenchley JM. Th17 cell dynamics in HIV infection. Curr Opin HIV AIDS. 2010;5:135–40. doi: 10.1097/COH.0b013e3283364846. - DOI - PMC - PubMed
    1. Kim CJ, McKinnon LR, Kovacs C, Kandel G, Huibner S, Chege D, et al. Mucosal Th17 cell function is altered during HIV infection and is an independent predictor of systemic immune activation. J Immunol. 2013;191:2164–73. doi: 10.4049/jimmunol.1300829. - DOI - PubMed

Publication types

MeSH terms

Substances