

A systems approach identifies networks and genes linking sleep and stress: implications for neuropsychiatric disorders
- PMID: 25921536
- PMCID: PMC4797932
- DOI: 10.1016/j.celrep.2015.04.003
A systems approach identifies networks and genes linking sleep and stress: implications for neuropsychiatric disorders
Abstract
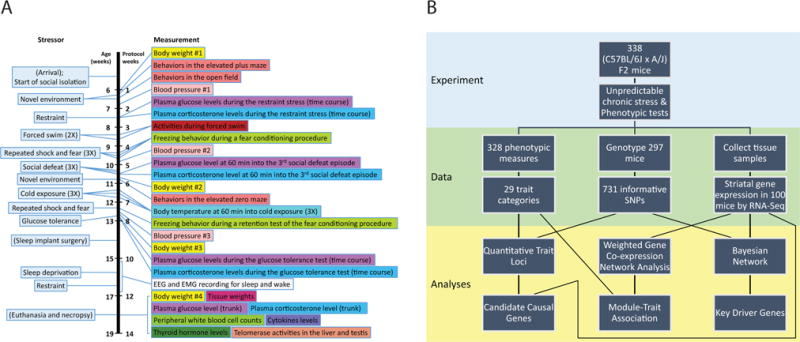
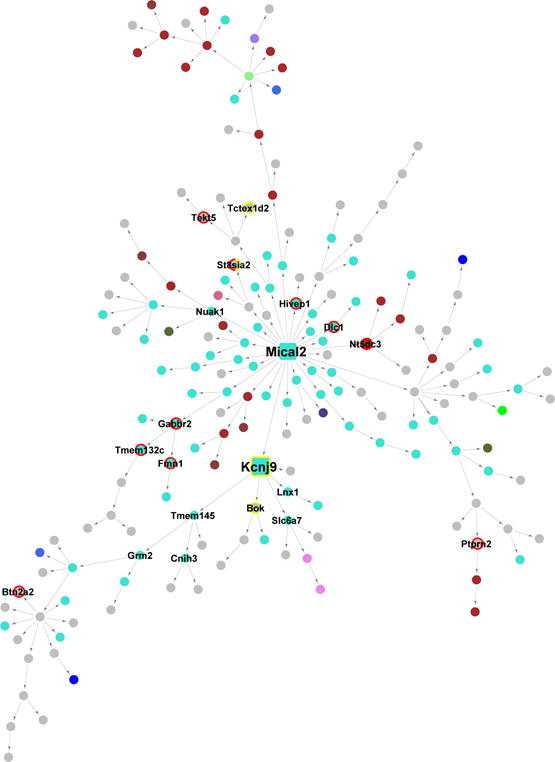
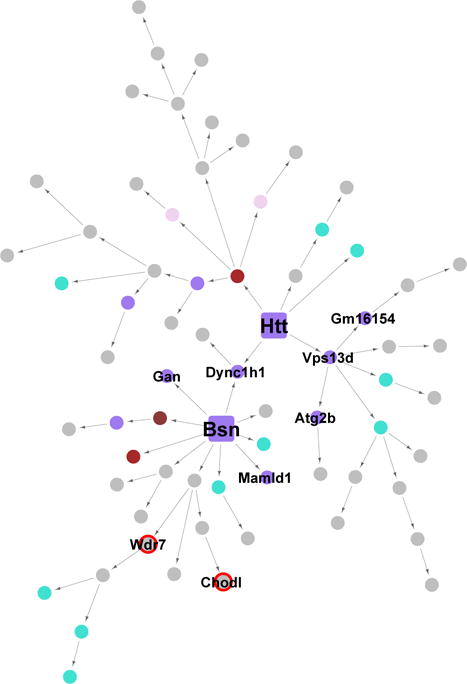
Sleep dysfunction and stress susceptibility are comorbid complex traits that often precede and predispose patients to a variety of neuropsychiatric diseases. Here, we demonstrate multilevel organizations of genetic landscape, candidate genes, and molecular networks associated with 328 stress and sleep traits in a chronically stressed population of 338 (C57BL/6J × A/J) F2 mice. We constructed striatal gene co-expression networks, revealing functionally and cell-type-specific gene co-regulations important for stress and sleep. Using a composite ranking system, we identified network modules most relevant for 15 independent phenotypic categories, highlighting a mitochondria/synaptic module that links sleep and stress. The key network regulators of this module are overrepresented with genes implicated in neuropsychiatric diseases. Our work suggests that the interplay among sleep, stress, and neuropathology emerges from genetic influences on gene expression and their collective organization through complex molecular networks, providing a framework for interrogating the mechanisms underlying sleep, stress susceptibility, and related neuropsychiatric disorders.
Copyright © 2015 The Authors. Published by Elsevier Inc. All rights reserved.
Figures

Similar articles
-
Systems Genetic Analyses Highlight a TGFβ-FOXO3 Dependent Striatal Astrocyte Network Conserved across Species and Associated with Stress, Sleep, and Huntington's Disease.PLoS Genet. 2016 Jul 8;12(7):e1006137. doi: 10.1371/journal.pgen.1006137. eCollection 2016 Jul. PLoS Genet. 2016. PMID: 27390852 Free PMC article.
-
Cross-species systems analysis identifies gene networks differentially altered by sleep loss and depression.Sci Adv. 2018 Jul 25;4(7):eaat1294. doi: 10.1126/sciadv.aat1294. eCollection 2018 Jul. Sci Adv. 2018. PMID: 30050989 Free PMC article.
-
Integrative genetic analysis of transcription modules: towards filling the gap between genetic loci and inherited traits.Hum Mol Genet. 2006 Feb 1;15(3):481-92. doi: 10.1093/hmg/ddi462. Epub 2005 Dec 21. Hum Mol Genet. 2006. PMID: 16371421
-
Identification of common regulators of genes in co-expression networks affecting muscle and meat properties.PLoS One. 2015 Apr 14;10(4):e0123678. doi: 10.1371/journal.pone.0123678. eCollection 2015. PLoS One. 2015. PMID: 25875247 Free PMC article.
-
Molecular network analysis enhances understanding of the biology of mental disorders.Bioessays. 2014 Jun;36(6):606-16. doi: 10.1002/bies.201300147. Epub 2014 Apr 14. Bioessays. 2014. PMID: 24733456 Free PMC article. Review.
Cited by
-
Onset of regular cannabis use and adult sleep duration: Genetic variation and the implications of a predictive relationship.Drug Alcohol Depend. 2019 Nov 1;204:107517. doi: 10.1016/j.drugalcdep.2019.06.019. Epub 2019 Aug 30. Drug Alcohol Depend. 2019. PMID: 31698253 Free PMC article.
-
Comparing Alzheimer's and Parkinson's diseases networks using graph communities structure.BMC Syst Biol. 2016 Mar 2;10:25. doi: 10.1186/s12918-016-0270-7. BMC Syst Biol. 2016. PMID: 26935435 Free PMC article.
-
Sleep deficits and cannabis use behaviors: an analysis of shared genetics using linkage disequilibrium score regression and polygenic risk prediction.Sleep. 2021 Mar 12;44(3):zsaa188. doi: 10.1093/sleep/zsaa188. Sleep. 2021. PMID: 32935850 Free PMC article.
-
The pink salmon genome: Uncovering the genomic consequences of a two-year life cycle.PLoS One. 2021 Dec 17;16(12):e0255752. doi: 10.1371/journal.pone.0255752. eCollection 2021. PLoS One. 2021. PMID: 34919547 Free PMC article.
-
Quantitative phosphoproteomic analysis of the molecular substrates of sleep need.Nature. 2018 Jun;558(7710):435-439. doi: 10.1038/s41586-018-0218-8. Epub 2018 Jun 13. Nature. 2018. PMID: 29899451 Free PMC article.
References
-
- Ahmad A, Rasheed N, Banu N, Palit G. Alterations in monoamine levels and oxidative systems in frontal cortex, striatum, and hippocampus of the rat brain during chronic unpredictable stress. Stress. 2010;13:355–364. - PubMed
-
- Altrock WD, tom Dieck S, Sokolov M, Meyer AC, Sigler A, Brakebusch C, Fässler R, Richter K, Boeckers TM, Potschka H, et al. Functional inactivation of a fraction of excitatory synapses in mice deficient for the active zone protein bassoon. Neuron. 2003;37:787–800. - PubMed
-
- Armario A, Martí O, Gavaldà A, Giralt M, Jolín T. Effects of chronic immobilization stress on GH and TSH secretion in the rat: Response to hypothalamic regulatory factors. Psychoneuroendocrinology. 1993;18:405–413. - PubMed
Publication types
MeSH terms
Substances
Grants and funding
LinkOut - more resources
Full Text Sources
Other Literature Sources
Medical
Molecular Biology Databases
Miscellaneous
