. 2015 May 4;212(5):715-28.
doi: 10.1084/jem.20141518. Epub 2015 Apr 27.

ICOS and Bcl6-dependent pathways maintain a CD4 T cell population with memory-like properties during tuberculosis

Affiliations

ICOS and Bcl6-dependent pathways maintain a CD4 T cell population with memory-like properties during tuberculosis

Albanus O Moguche et al. J Exp Med. .

Abstract

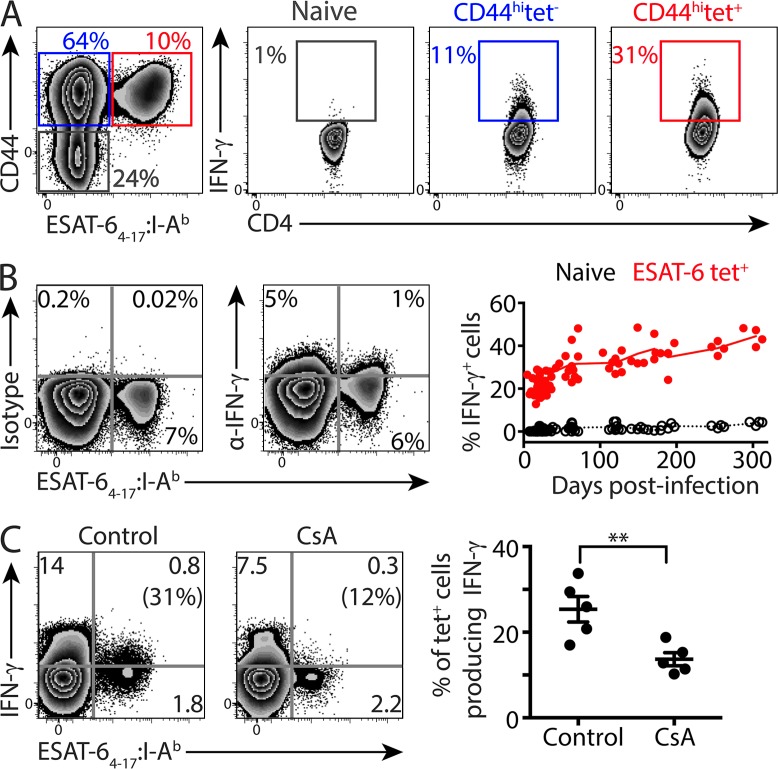
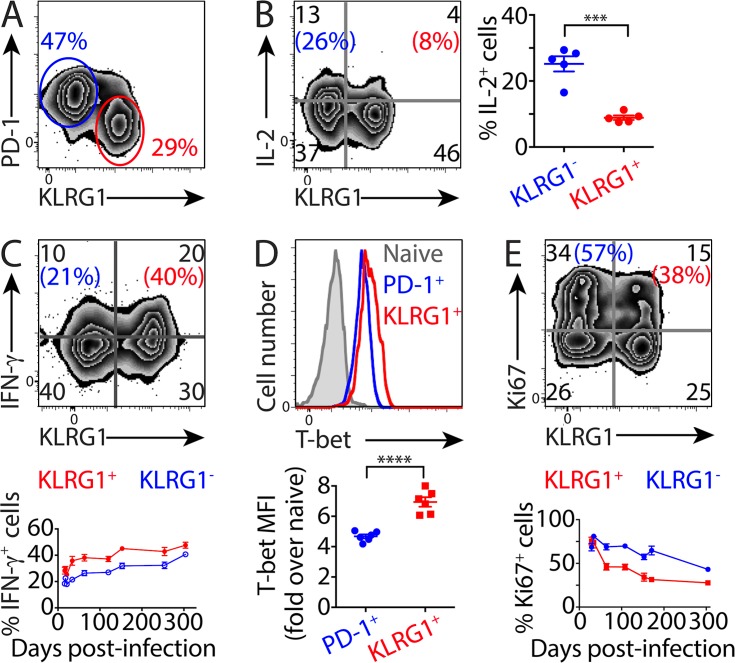
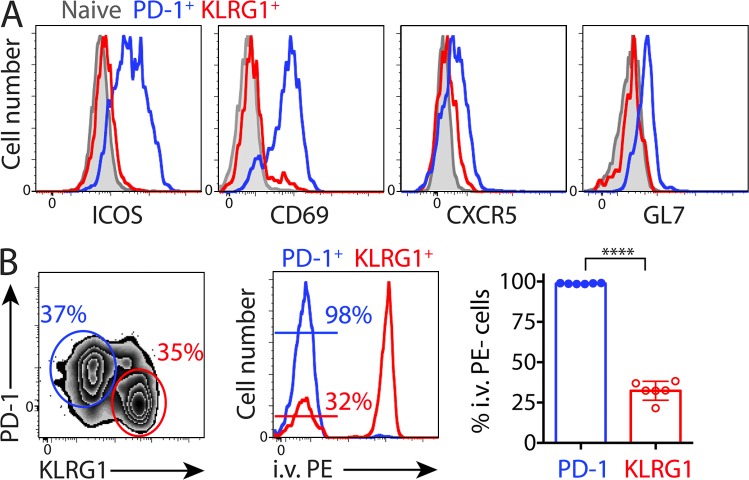
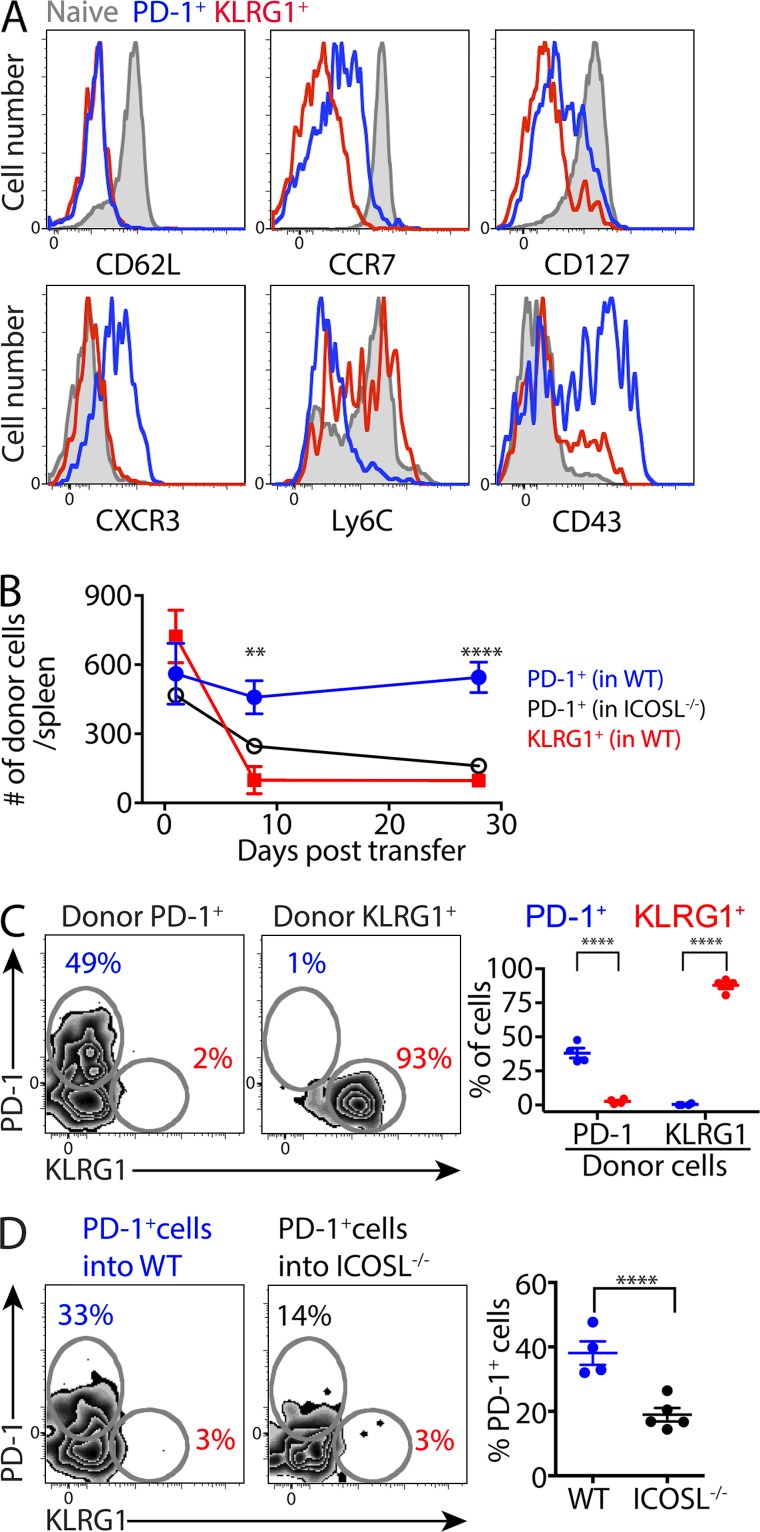
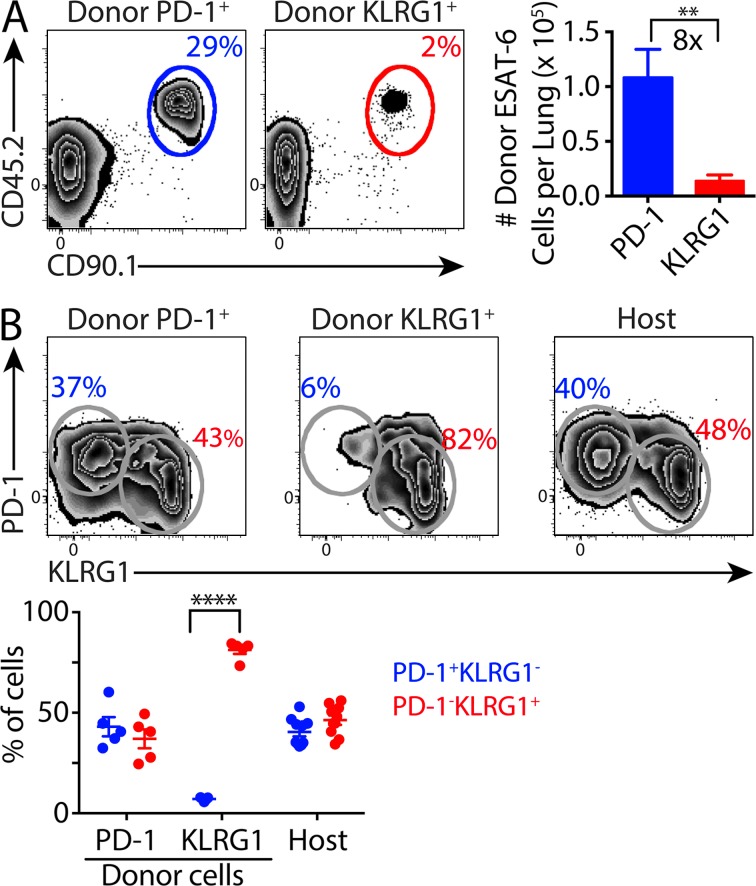
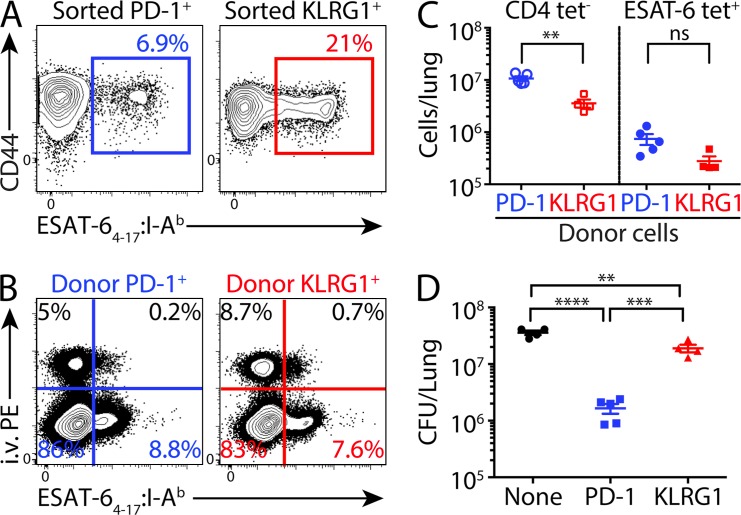
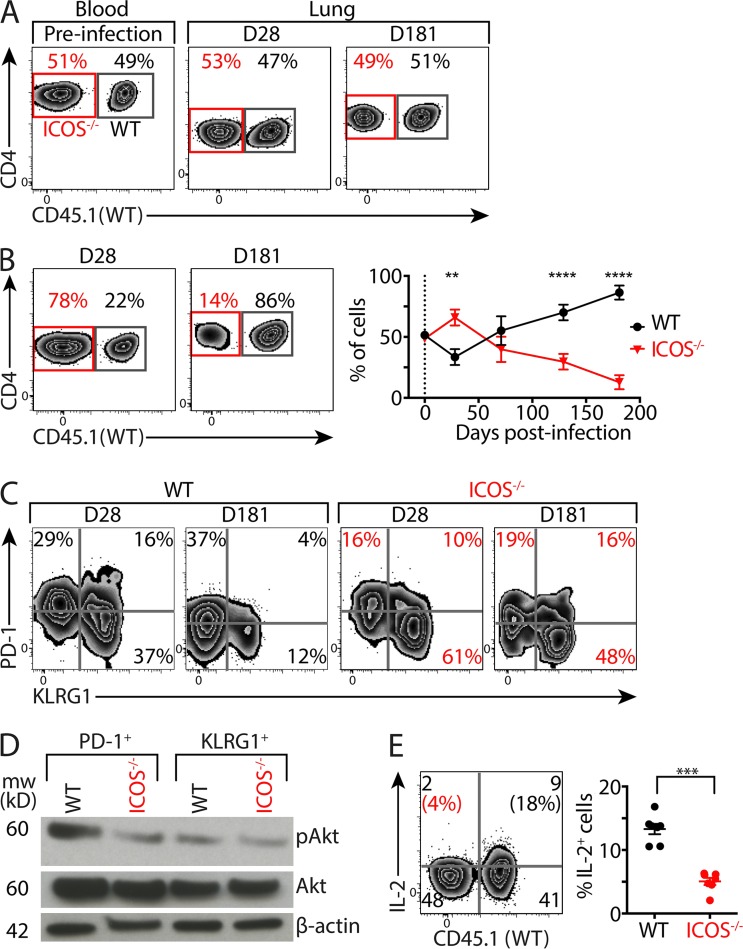
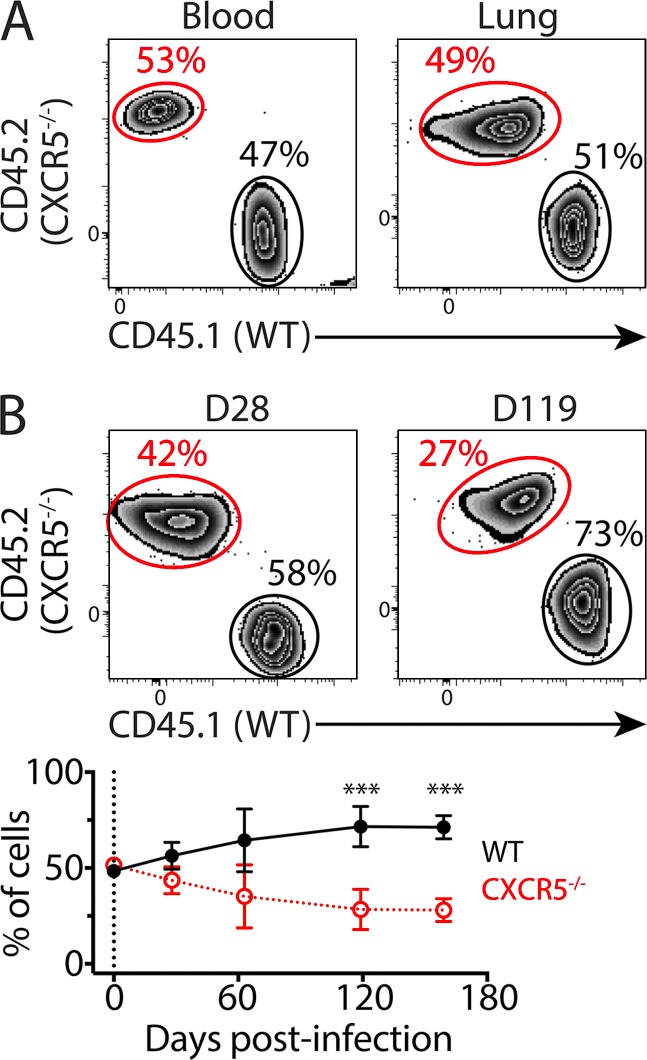
Immune control of persistent infection with Mycobacterium tuberculosis (Mtb) requires a sustained pathogen-specific CD4 T cell response; however, the molecular pathways governing the generation and maintenance of Mtb protective CD4 T cells are poorly understood. Using MHCII tetramers, we show that Mtb-specific CD4 T cells are subject to ongoing antigenic stimulation. Despite this chronic stimulation, a subset of PD-1(+) cells is maintained within the lung parenchyma during tuberculosis (TB). When transferred into uninfected animals, these cells persist, mount a robust recall response, and provide superior protection to Mtb rechallenge when compared to terminally differentiated Th1 cells that reside preferentially in the lung-associated vasculature. The PD-1(+) cells share features with memory CD4 T cells in that their generation and maintenance requires intrinsic Bcl6 and intrinsic ICOS expression. Thus, the molecular pathways required to maintain Mtb-specific CD4 T cells during ongoing infection are similar to those that maintain memory CD4 T cells in scenarios of antigen deprivation. These results suggest that vaccination strategies targeting the ICOS and Bcl6 pathways in CD4 T cells may provide new avenues to prevent TB.


Figures

Figure 1.
Figure 1.
ESAT-6–specific CD4 T cells are subjected to chronic stimulation by antigen. C57BL/6 mice were infected with aerosolized Mtb (~100 CFU/mouse). (A) Lung bacterial loads were assessed by serial plating at the indicated time points. (B) ESAT-6–specific CD4 T cells in the lung were enumerated by flow cytometry. Representative flow cytometry plots and total cell numbers shown. (C) Proportion of Ki67-expressing CD4 T cells among naive CD44low (left) and ESAT-6–specific (right) cells. (D) CFSE-labeled ESAT-6–specific (C7 TCRtg) and ovalbumin-specific (OT-II TCRtg) CD4 T cells were adoptively transferred into Mtb-infected mice at various time points. CFSE dilution was assessed 5 d after transfer, at each of the indicated time points. Data are representative of three independent experiments with three to five mice per group at each time point and cumulative data are represented as mean ± SEM.
Figure 2.
Figure 2.
ESAT-6–specific CD4 T cells produce IFN-γ in a TCR signaling–dependent manner. Mice were infected as described in Fig. 1. (A) Intracellular IFN-γ was assessed by flow cytometry directly ex vivo using lung cells (150 d after infection) processed in the presence of Brefeldin A. Gating strategy and representative flow cytometry plots for naive CD44low (gray), nontetramer-binding CD44hi (blue), and ESAT-6 tetramer-binding CD44hi (red) CD4 T cells are shown. (B) Flow cytometry plots show intracellular IFN-γ, or staining with isotype matched control, in ESAT-6–specific CD4 T cells (70 d after infection). Graph shows the percentage of ESAT-6 tetramer-binding or naive CD44low T cells producing IFN-γ at the indicated time points. (C) Mice infected with Mtb 35 d prior were treated intraperitoneally with either cyclosporine-A (CsA) or vehicle, and ESAT-6–specific cells in the lung were assessed for intracellular IFN-γ as in A and B. Numbers in parentheses represent the percentage of ESAT-6 tetramer-binding CD4 T cells producing IFN-γ and the graph shows this value for each mouse and the mean ± SEM for each group. Significance was determined by two-tailed Student’s t test (**, P < 0.01). Data are representative of two independent experiments with four to five mice per group.
Figure 3.
Figure 3.
ESAT-6–specific CD4 T cells cluster into distinct functional subsets. Mice were infected as described in Figure 1 and lung CD4 T cells were analyzed by flow cytometry. (A) Representative flow cytometry plot depicts KLRG1 and PD-1 expression by ESAT-6 tetramer-binding CD4 T cells in the lung 90 d after infection. (B) Single-cell suspensions from the lungs of Mtb-infected mice (150 d after infection) were stimulated with ESAT-64-17 in vitro and intracellular cytokine staining was performed. A representative flow plot depicts KLRG1 and IL-2 expression within CD4 T cells coproducing IFN-γ and TNF (gate not depicted), and numbers in parentheses represent the percentage of KLRG1 (blue) and KLRG1+ (red) cells within this population that express IL-2. The graph shows this value for each mouse and the mean ± SEM for each group. (C) Flow cytometry plot shows direct ex vivo intracellular IFN-γ versus KLRG1 expression for ESAT-6 tetramer-binding CD4 T cells 34 d after infection. Numbers in parentheses denote the percentage of KLRG1 (blue) or KLRG1+ (red) cells, and the graph below shows the mean ± SEM of these values for each group at various time points after infection. (D) Flow cytometry histograms show T-bet expression by naive CD44low (gray), PD-1+KLRG1 (blue), and PD-1KLRG1+ (red) ESAT-6 tetramer-binding CD4 T cells 90 d after infection. Graph below shows the T-bet mean fluorescent intensity (MFI) for each T cell subset in individual mice, and the mean ± SEM for each group. (E) Flow cytometry plot shows Ki67 versus KLRG1 expression for ESAT-6 tetramer-binding CD4 T cells 70 d after infection. Numbers in parentheses denote the percentage of KLRG1 (blue) or KLRG1+ (red) cells that express Ki67 and the graph below shows the mean ± SEM of these values for each group at various time points after infection. Significance was determined by two-tailed Student’s t test (***, P < 0.001; ****, P < 0.0001). Data are representative of three independent experiments with three to five mice per group at each time point.
Figure 4.
Figure 4.
Mtb-specific PD-1+ CD4 T cells express Tfh-associated markers and reside within the lung parenchyma. Mice were infected as described in Fig. 1. (A) Representative flow cytometry histograms show expression of ICOS, CD69, CXCR5, and GL7 by naive CD44low (gray), ESAT-6 tetramer-binding PD-1+KLRG1 (blue), or PD-1KLRG1+ (red) CD4 T cells recovered from the lungs 60 d after infection. (B) Day 90 after infection, mice were administered i.v. phycoerythrin (PE)-conjugated anti-CD90.2 antibodies 10 min before sacrificing. Representative flow cytometry plot depict gating strategy to identify PD-1+ (blue) and KLRG1+ (red) tetramer-binding CD4 T cells. The flow cytometry histograms show i.v. labeling status of lung tetramer-binding PD-1+ and KLRG1+ CD4 T cells. Numbers in the histogram denotes the percentage of PD-1+ (blue) or KLRG1+ (red) cells that were protected from i.v. PE labeling and are shown for individual mice in the graph on the right. The mean ± SEM for each group is shown; significance was determined by a two-tailed Student’s t test (****, P < 0.0001). Data are representative of three independent experiments with four to five mice per group.
Figure 5.
Figure 5.
ESAT-6–specific PD-1+CD4 T cells express memory associated markers and survive in the absence of antigen via ICOSL signaling. Mice were infected as described in Fig. 1. (A) Representative flow cytometry histograms show expression of the indicated markers by naive CD44low (gray), ESAT-6 tetramer-binding PD-1+KLRG1 (blue) or PD-1KLRG1+ (red) CD4 T cells (day 120 after infection). (B) PD-1+KLRG1 or PD-1KLRG1+ CD4 T cells sorted from lungs of Mtb-infected mice (day 119 after infection) were adoptively transferred (105 cells/recipient) into uninfected WT or ICOSL−/− mice. The graph shows the number of donor cells recovered from the spleens of WT recipients of donor PD-1+ cells (blue), WT recipients of donor KLRG1+ cells (red), and ICOSL−/− recipients of donor PD-1+ cells (black) at days 1, 8, and 28 after transfer. (C) Flow cytometry plots denote PD-1 and KLRG1 expression by donor-derived (transferred as PD-1+KLRG1 or PD-1KLRG1+ cells) CD4 T cells in the spleens of WT recipients (28 d after transfer) as described in B. The graph depicts the frequency of cells within each donor-derived population expressing PD-1 (blue) or KLRG1 (red) in individual mice. (D) Flow cytometry plots denote PD-1 and KLRG1 expression by donor-derived PD-1+KLRG1 cells in the spleens of WT or ICOSL−/− recipients (28 d after transfer). The graph below depicts the frequency of PD-1+ cells within the donor-derived CD4 T cell population in individual mice of each group. The mean ± SEM are shown for each group and statistical significance was determined by a two-tailed Student’s t test (**, P < 0.01; ****, P < 0.0001). Data in A are representative of three independent experiments with four to five mice per group. Transfer of PD-1+ and KLRG1+ cells into WT mice was performed twice with three to five mice per group and per time point whereas transfer of PD-1+ cells into ICOSL−/− mice was done once with four to five mice in each of the three time points.
Figure 6.
Figure 6.
ESAT-6–specific PD-1+ CD4 T cells undergo a robust recall response. Mice were infected as described in Fig. 1. 5 mo after infection, PD-1+KLRG1 or PD-1KLRG1+ CD4 T cells were purified by FACS from lungs of congenically marked donor mice and adoptively transferred (normalized for transfer of 5.5 × 10⁴ ESAT-6 tetramer-binding cells/recipient) into uninfected WT mice. Recipients were challenged 10 d after transfer with Mtb and assessed 28 d after infection. (A) Flow cytometry plots depict the percentage of donor-derived cells (CD45.2+CD90.1+) within the ESAT-6 tetramer-binding CD4 T cell population in recipients receiving either PD-1+KLRG1 (left panel) or PD-1KLRG1+ (right panel) cells. The bar graph shows the absolute number of donor-derived ESAT-6 tetramer-binding CD4 T cells in the lungs of mice that received PD-1+KLRG1 (blue) and PD-1KLRG1+ (red) donor cells. (B) Flow cytometry plots depict PD-1 and KLRG1 expression by donor-derived (transferred as PD-1+KLRG1 or PD-1KLRG1+ cells) and endogenous ESAT-6 tetramer-binding CD4 T cells in recipient lungs. The graph depicts the frequency of PD-1+KLRG1 (blue) or PD-1KLRG1+ (red) cells within each donor-derived and endogenous ESAT-6 tetramer-binding population in individual mice. The mean ± SEM are shown for each group. Statistical significance was determined by two-tailed Student’s t test. **, P < 0.01; ****, P < 0.0001. Data are representative of two independent experiments with five mice per group.
Figure 7.
Figure 7.
PD-1+ CD4 T cells confer superior protection against Mtb compared with their KLRG1+ counterparts. PD-1+KLRG1 or PD-1KLRG1+ CD4 T cells were purified by FACS from the lungs of congenically marked Mtb-infected mice (80 d after infection) and transferred into T cell–deficient (TCRβ−/−δ−/−) mice that had been infected with Mtb 7 d prior. Recipients were assessed 28 d after infection (21 d after transfer). (A) Flow cytometry plots depict proportion of ESAT-6 tetramer-binding cells within sorted PD-1+KLRG1 (left) and PD-1KLRG1+ (right) CD4 T cells before adoptive transfer. (B) Representative flow cytometry plots show ESAT-6 tetramer binding and i.v. PE-antibody labeling for donor-derived CD4 T cells transferred as either PD-1+KLRG1 (left) or PD-1KLRG1+ (right) cells. (C) Graph shows the number of donor-derived CD4 T cells within the lung parenchyma (i.v. PE) that either did not (left) or did (right panel) bind the ESAT-6 tetramer in individual recipients after transfer of either PD-1+KLRG1 (blue) or PD-1KLRG1+ (red) CD4 T cells. (D) Graph depicts lung bacterial burdens in recipients of no T cells (black), PD-1+KLRG1 (blue), or PD-1KLRG1+ (red) CD4 T cells. The mean ± SEM are shown and statistical significance was determined by two-tailed Student’s t test (**, P < 0.01; ***, P < 0.001; ****, P < 0.0001). Data are representative of two independent experiments with four to seven mice per group.
Figure 8.
Figure 8.
T cell–intrinsic ICOS signaling is required to maintain ESAT-6–specific CD4 T cells. TCRβ−/−δ−/− mice were sublethally irradiated (600 rads) and reconstituted with a 1:1 mix of congenically marked WT and ICOS−/− bone marrow cells. 10 wk after reconstitution, the mice were infected with Mtb as described in Fig. 1. (A) Representative flow cytometry plots depict the ratio of WT (black) and ICOS−/− (red) CD4 T cells in blood 10 wk after reconstitution and among naive lung (CD44low) CD4 T cells at days 28 and 181 after infection. (B) Flow cytometry plots and graph show the frequency of WT (black) and ICOS−/− (red) cells within the ESAT-6–specific CD4 T cell population at the indicated time points. (C) Representative flow cytometry plots depict the expression of PD-1 and KLRG1 by WT and ICOS−/− ESAT-6–specific CD4 T cells at the indicated time points. (D) PD-1+ or KLRG1+ CD4 T cells (WT or ICOS−/−) were sorted by FACS from the lungs of chimeric mice (70 d after infection) and analyzed by Western blot for Akt phosphorylation. (E) Single cell suspensions from the lungs of chimeric mice were stimulated with ESAT-64-17 in vitro and intracellular cytokine staining was performed. A representative flow plot depicts CD45.1 (WT cells) and IL-2 expression within CD4 T cells coproducing IFN-γ and TNF (gate not depicted), and numbers in parentheses represent the percentage of WT (black) and ICOS−/− (red) cells within this population that express IL-2. The graph shows this value for each population within individual chimeric mice. The mean ± SEM are shown. Statistical significance was determined by two-tailed Student’s t test (**, P < 0.01; ***, P < 0.001; ****, P < 0.0001). Data shown in A–C and E are representative of three independent experiments with four to seven mice per group and per time point, and data in D are representative of two independent experiments with cells pooled from four mice.
Figure 9.
Figure 9.
T cell–intrinsic Bcl6 signaling is required to generate an ESAT-6–specific Th1 response. C57BL/6 WT mice were lethally irradiated (1000 Rads) and reconstituted with a 1:1 mix of congenically WT and Bcl6−/− fetal liver cells. 10 wk after reconstitution, mice were infected with Mtb as described in Fig. 1. (A) Representative flow cytometry plots depict the frequency of WT (blue) and Bcl6−/− (red) CD4 T cells in blood 10 wk after immune reconstitution and among naive lung (CD44low) CD4 T cells at days 27 and 44 after infection. (B) Flow cytometry plots depict the frequency of WT (blue) and Bcl6−/− (red) derived cells within the ESAT-6 tetramer-binding CD4 T cell population in the lungs of chimeric mice at the indicated time points. The graph depicts the percentage of WT (blue) and Bcl6−/− (red) cells within the donor-derived ESAT-6 tetramer-binding CD4 T cell populations (excludes host-derived cells). (C) Representative flow cytometry plots depict the percentage of WT or Bcl6−/− ESAT-6 tetramer-binding CD4 T cells that express Ki67 at day 27 after infection. (D) Representative flow cytometry plots show PD-1 and KLRG1 expression by WT or Bcl6−/− ESAT-6 tetramer-binding CD4 T cells at the indicated time points after infection. (E) Representative flow cytometry histograms (left) show T-bet expression by naive CD4 T cells (gray), WT (blue), and Bcl6−/− (red) ESAT-6 tetramer-binding CD4 T cells (27 d after infection). The graph (middle) shows the T-bet MFI for WT and Bcl6−/−populations relative to expression in naive CD4 T cells. The graph on the right depicts the percentage of WT and Bcl6−/− lung ESAT-6 tetramer-binding CD4 T cells producing IFN-γ directly ex vivo (27 d after infection). The mean ± SEM are shown. Statistical significance was determined by two-tailed Student’s t test (****, P < 0.0001). Data are representative of two independent experiments with 3–7 mice per group at each time point.
Figure 10.
Figure 10.
CXCR5 is required in a cell-intrinsic manner to maintain ESAT-6–specific CD4 T cells during chronic Mtb infection. TCRβ−/−δ−/− mice were sublethally irradiated (600 rads) and reconstituted with a 1:1 mix of congenically marked WT and CXCR5−/− bone marrow cells. Mice were infected as described in Fig. 1 at 10 wk after reconstitution. (A) Representative flow cytometry plots denote the frequency of WT (black) and CXCR5−/− (red) CD4 T cells in blood 10 wk after bone marrow reconstitution (left) and among naive lung CD4 T cells at 119 d after infection. (B) Representative flow cytometry plots and graph shows the frequency of WT (black) and CXCR5−/− (red) ESAT-6 tetramer-binding CD4 T cells within the lung at the indicated time points. The mean ± SEM are shown. Significance was determined by two-tailed Student’s t test (**, P < 0.001). Data are representative of three independent experiments with three to seven mice per group at time point.

Similar articles

Cited by

References

    1. Andersen P., and Woodworth J.S.. 2014. Tuberculosis vaccines—rethinking the current paradigm. Trends Immunol. 35:387–395 10.1016/j.it.2014.04.006 - DOI - PubMed
    1. Anderson K.G., Mayer-Barber K., Sung H., Beura L., James B.R., Taylor J.J., Qunaj L., Griffith T.S., Vezys V., Barber D.L., and Masopust D.. 2014. Intravascular staining for discrimination of vascular and tissue leukocytes. Nat. Protoc. 9:209–222 10.1038/nprot.2014.005 - DOI - PMC - PubMed
    1. Barber D.L., Wherry E.J., Masopust D., Zhu B., Allison J.P., Sharpe A.H., Freeman G.J., and Ahmed R.. 2006. Restoring function in exhausted CD8 T cells during chronic viral infection. Nature. 439:682–687 10.1038/nature04444 - DOI - PubMed
    1. Barber D.L., Mayer-Barber K.D., Feng C.G., Sharpe A.H., and Sher A.. 2011. CD4 T cells promote rather than control tuberculosis in the absence of PD-1-mediated inhibition. J. Immunol. 186:1598–1607 10.4049/jimmunol.1003304 - DOI - PMC - PubMed
    1. Barnden M.J., Allison J., Heath W.R., and Carbone F.R.. 1998. Defective TCR expression in transgenic mice constructed using cDNA-based alpha- and beta-chain genes under the control of heterologous regulatory elements. Immunol. Cell Biol. 76:34–40 10.1046/j.1440-1711.1998.00709.x - DOI - PubMed

Publication types

MeSH terms

Substances