. 2015 Jun 15;402(2):291-305.
doi: 10.1016/j.ydbio.2015.04.010. Epub 2015 Apr 24.

Imprinted expression in cystic embryoid bodies shows an embryonic and not an extra-embryonic pattern

Affiliations

Imprinted expression in cystic embryoid bodies shows an embryonic and not an extra-embryonic pattern

Tomasz M Kulinski et al. Dev Biol. .

Abstract

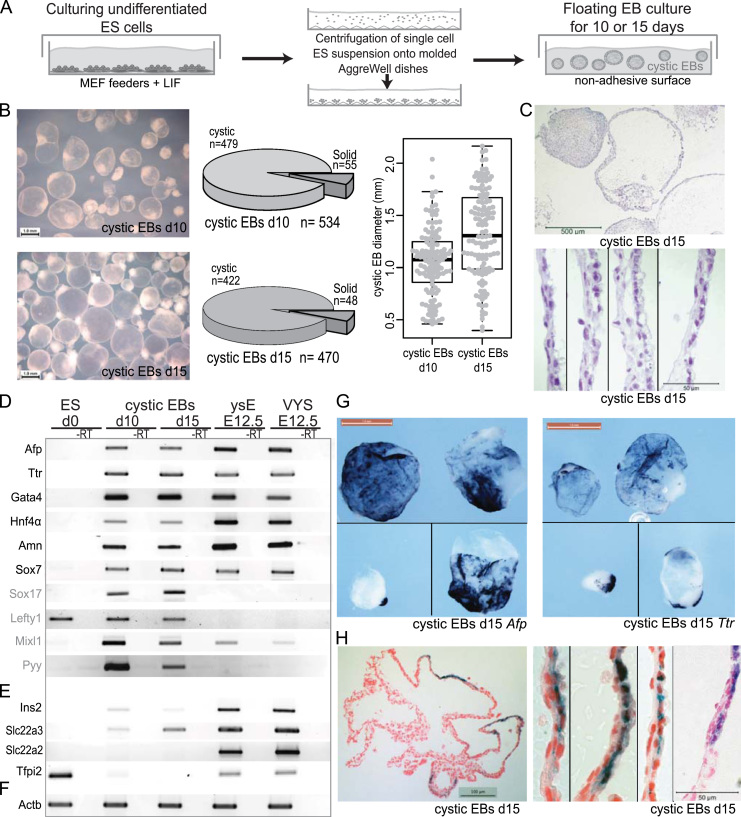
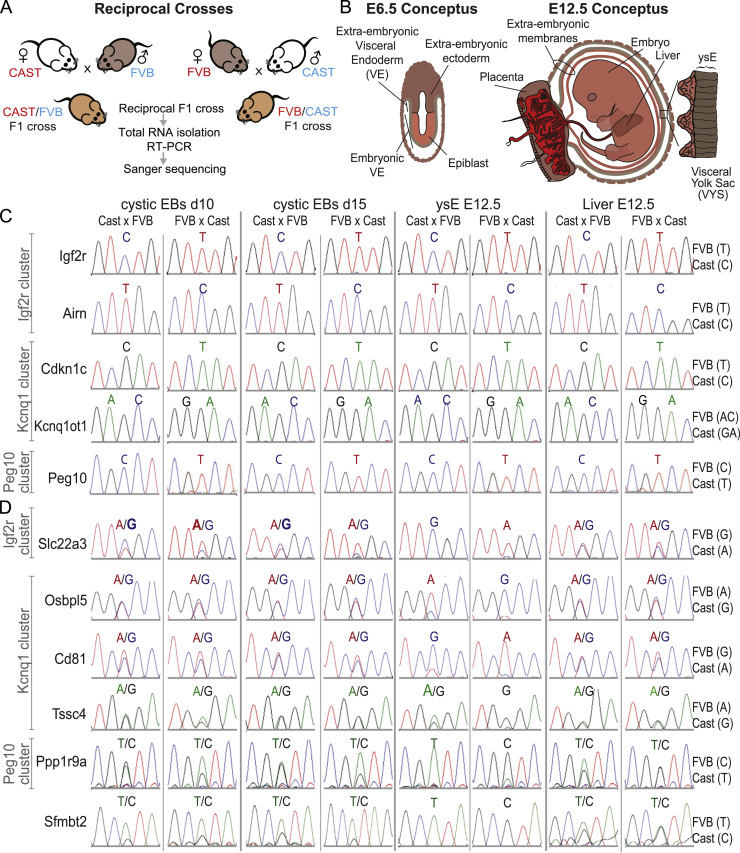
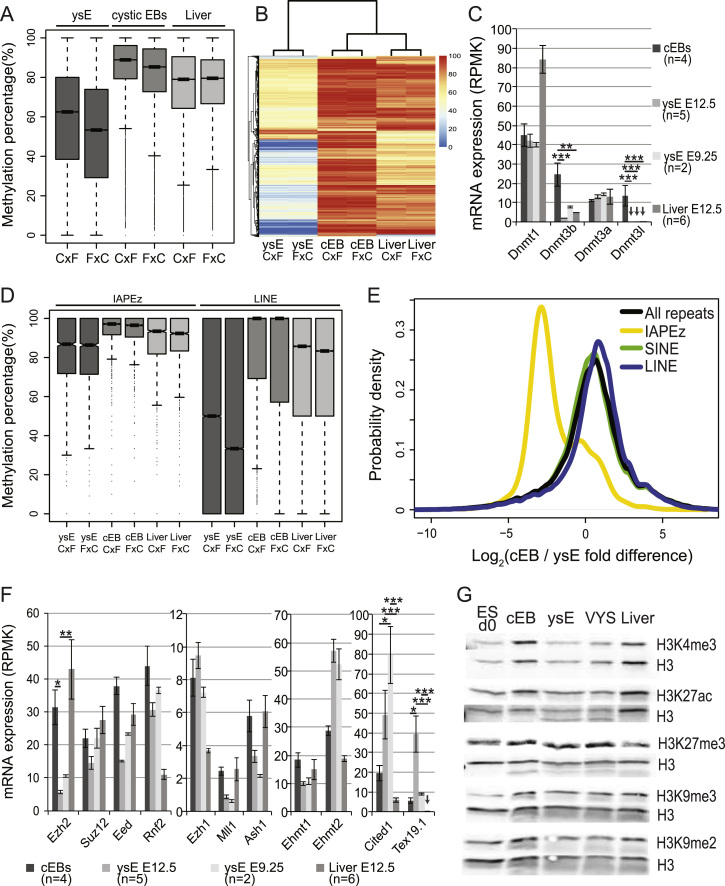
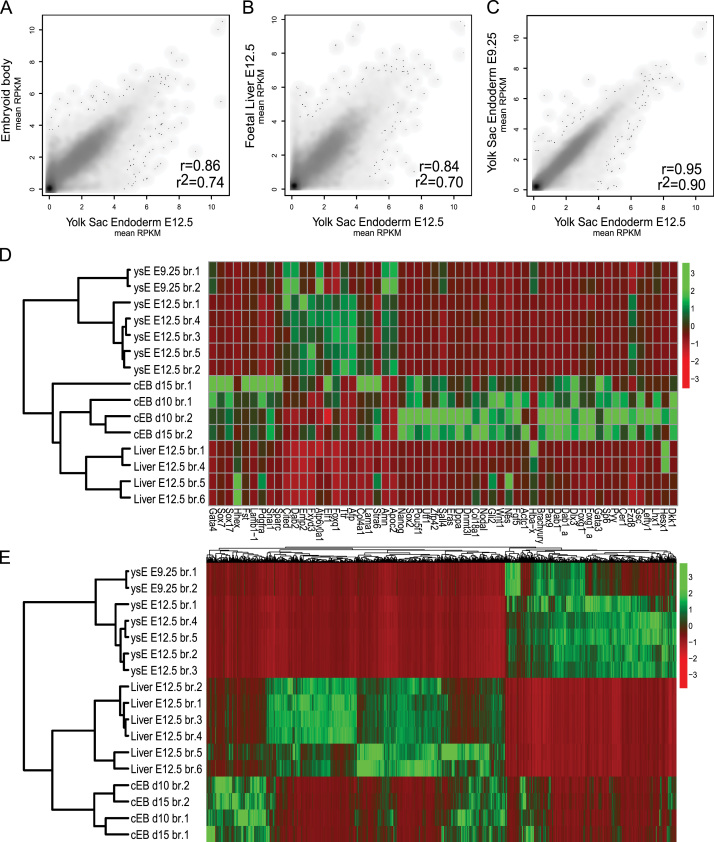
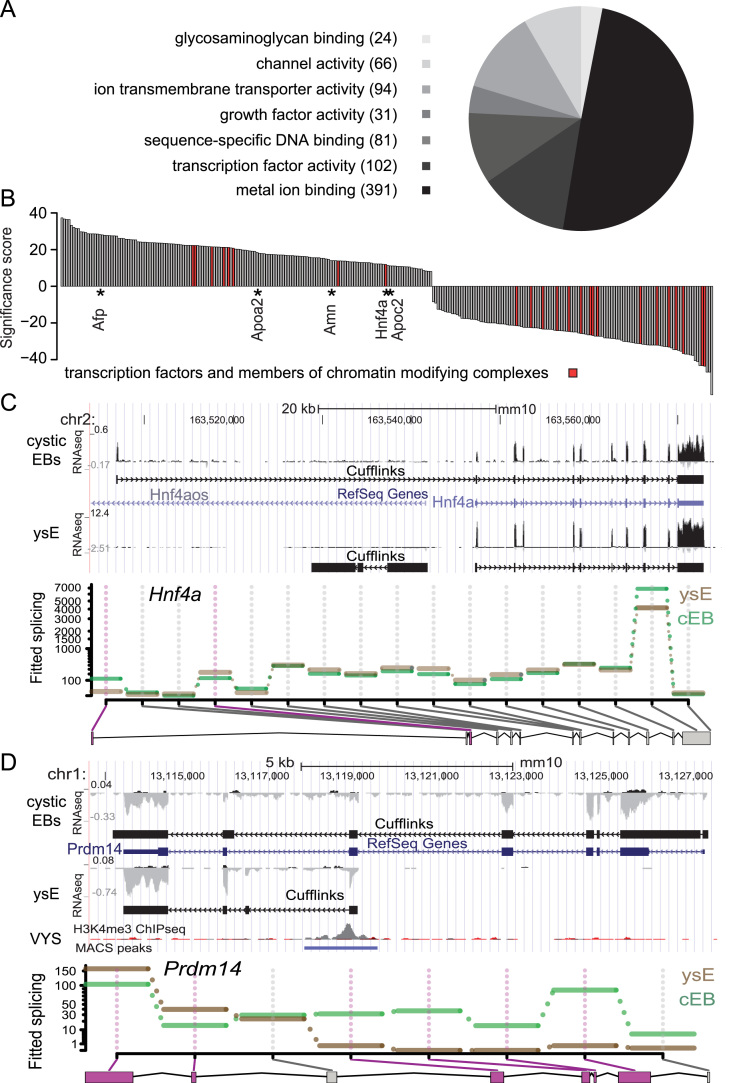
A large subset of mammalian imprinted genes show extra-embryonic lineage (EXEL) specific imprinted expression that is restricted to placental trophectoderm lineages and to visceral yolk sac endoderm (ysE). Isolated ysE provides a homogenous in vivo model of a mid-gestation extra-embryonic tissue to examine the mechanism of EXEL-specific imprinted gene silencing, but an in vitro model of ysE to facilitate more rapid and cost-effective experiments is not available. Reports indicate that ES cells differentiated into cystic embryoid bodies (EBs) contain ysE, so here we investigate if cystic EBs model ysE imprinted expression. The imprinted expression pattern of cystic EBs is shown to resemble fetal liver and not ysE. To investigate the reason for this we characterized the methylome and transcriptome of cystic EBs in comparison to fetal liver and ysE, by whole genome bisulphite sequencing and RNA-seq. Cystic EBs show a fetal liver pattern of global hypermethylation and low expression of repeats, while ysE shows global hypomethylation and high expression of IAPEz retroviral repeats, as reported for placenta. Transcriptome analysis confirmed that cystic EBs are more similar to fetal liver than ysE and express markers of early embryonic endoderm. Genome-wide analysis shows that ysE shares epigenetic and repeat expression features with placenta. Contrary to previous reports, we show that cystic EBs do not contain ysE, but are more similar to the embryonic endoderm of fetal liver. This explains why cystic EBs reproduce the imprinted expression seen in the embryo but not that seen in the ysE.

Keywords: Cystic embryoid bodies (EBs); DNA methylation; Genomic imprinting; Visceral endoderm (VE); Visceral yolk sac (VYS); Visceral yolk sac Endoderm (ysE).


Figures

Fig. 1
Fig. 1
Cystic embryoid bodies (EBs) express a subset of endoderm markers and have a membrane-like morphology. (A) The protocol used to differentiate ES cells into cystic EBs. (B) Left: light microscope image of cystic EBs (scale bar: 1 mm) differentiated for 10 (d10) and 15 (d15) days. Middle: the relative abundance of cystic and solid EBs at d10 and d15. Right: the diameter of cystic EBs at d10 and d15. (C) Histological section of d15 cystic EBs stained with haematoxylin and eosin showing their characteristic organization with a solid node of cells localized to one end and an outer bi-laminar layer containing columnar epithelium (scale bar top: 500 µm, bottom: 50 µm). (D) RT-PCR shows that general endoderm markers (black font) and specific anterior and definitive endoderm markers (gray font) are robustly detected in cystic EBs, but the latter markers are not found in E12.5 visceral yolk sac endoderm (ysE) or visceral yolk sac (VYS) (ES d0: undifferentiated ES cells). (E) RT-PCR shows that four extra-embryonic lineage (EXEL) specific imprinted genes are either lowly expressed (Slc22a3, Ins2) or not detectable after 40 PCR cycles in d10/d15 cystic EBs, whereas they are robustly expressed in ysE and VYS. With the exception of Tfpi2, ES d0 cells also do not express the EXEL genes tested. (F) Control actin RT-PCR. (G) Whole mount in situ hybridization (WISH) detects the expression of endoderm markers Afp and Ttr in cystic EBs (scale: 1 mm). (H) Histological sections of WISH stained cystic EBs localize Afp and Ttr expression to the outer columnar epithelium layer (scale left: 100 µm, right: 50 µm).
Fig. 2
Fig. 2
Cystic EBs show multi-lineage (ML) but not extra-embryonic lineage (EXEL) specific imprinted gene expression. (A) The breeding scheme used to obtain reciprocal crosses between the FVB/N (FVB) and CAST/EiJ (CAST) mouse strains for imprinted expression analysis using single nucleotide polymorphisms (SNPs). (B) Embryos at E6.5 and E12.5 indicating embryonic and extra-embryonic tissues (VYS diagram adapted from Hudson et al. (2011)). (C) The ML imprinted genes Igf2r, Cdkn1c (maternally-expressed), and Kcnq1ot1, Airn, Peg10 (paternally-expressed) that represent 3 out of 4 imprinted clusters that contain EXEL genes, show the expected reciprocal imprinted expression pattern in cystic EBs, E12.5 yolk sac endoderm (ysE) and E12.5 fetal liver. The expressed SNP is shown above each Sanger sequencing chromatogram, FVB and CAST alleles are indicated on the right. (D) The EXEL genes Osbpl5, Cd81, Tssc4, and Ppp1r9a from the Kcnq1 and Peg10 imprinted clusters show biallelic expression in cystic EBs. The solo EXEL gene Sfmbt2 shows a strain bias between FVB and CAST so biallelic expression in cystic EBs was validated in B6/129 ES cells (Fig. S2B). The Slc22a3 EXEL gene from the Igf2r cluster shows a reciprocal bias in cystic EBs with very low expression requiring 40 PCR cycles and multiple reactions to acquire enough DNA for sequencing. Each EXEL gene shows imprinted expression in E12.5 ysE and biallelic expression in E12.5 fetal liver. SNPs are displayed above the chromatograms with a single base indicating robust imprinted expression, both SNP bases indicating biallelic expression, and both SNP bases with one in bolded font indicating biased expression. The maternal allele is written on the left.
Fig. 3
Fig. 3
Cystic EBs lack epigenetic features of visceral yolk sac endoderm. (A) Global DNA methylation in E12.5 yolk sac endoderm (ysE) is lower than in d15 cystic EBs, which shows greater similarity with the DNA methylation level of E12.5 fetal liver. Whole genome bisulfite sequencing (WGBS) data was analyzed using 5 kb windows across the genome. Box plots show the range of DNA methylation for each tissue indicating the median and the interquartile range (IQR). (B) Cystic EBs (d15) cluster closer to E12.5 fetal liver than E12.5 ysE by DNA methylation levels. Hierarchical clustering was done using 5 kb windows (n=4996) that showed the greatest similarity between replicates, but differed with at least one other tissue (details in Supplementary materials). (C) De novo DNA methyltransferases Dnmt3b and Dnmt3l are more highly expressed (reads per kilobase per million reads (RPKM)) in RNA-seq data from cystic EBs than in E9.5, 12.5 ysE and fetal liver. (D) IAPEz repeats are highly methylated, but show a lower level of DNA methylation in E12.5 ysE compared to d15 cystic EBs, which show levels more similar to E12.5 fetal liver. LINE repeats are less methylated, but show a similar pattern with E12.5 ysE showing a lower level of DNA methylation than d15 cystic EBs, which show levels more similar to fetal liver. Box plots (shaded as in 3A) show the percentage of methylation for each sample indicting the median and IQR. (E) E12.5 ysE expresses IAPez repeats at a higher level than cystic EBs, while SINEs, LINEs, and all repeats show no difference in expression. The Kernel density plot displays the probability of repeats showing different expression in these two tissues (x-axis: log2 fold difference in expression, negative values represent overexpression in E12.5 ysE, positive values represent overexpression in cystic EBs). (F) The expression of selected genes from chromatin modifying complexes from RNA-seq data. (G) No difference in the global level of histone modifications was detected by Western blot analysis for H3K4me3, H3K27ac, H3K27me3, H3K9me3 and H3K9me2 histone modifications in undifferentiated ES cells, cystic EBs d15, E12.5 ysE, E12.5 total VYS and E12.5 fetal liver. A pan-H3 antibody is provided below each of the modifications as a loading control. Error bars in (C) and (F) show the standard error of the mean (*P≤0.05, **P≤0.01, and ***P≤0.001).
Fig. 4
Fig. 4
Transcriptome analysis shows that cystic EBs resemble fetal liver more than yolk sac endoderm. (A–C) Scatter plots comparing mean RPKM values from RNA-seq of yolk sac endoderm (ysE) and cystic EBs shows a weak correlation (left: r2=0.74), more similar to distantly related tissues such as E12.5 yolk sac endoderm and E12.5 fetal liver (middle: r2=0.70), than to closely related E12.5 and E9.25 yolk sac endoderm (right: r2=0.90). r is the Pearson coefficient of correlation. (D) Supervised clustering by expression of selected developmental markers shows a high similarity in expression patterns of ysE from two developmental stages (E12.5 and E9.25), while the expression pattern of cystic EBs clusters closer to the expression pattern of E12.5 liver. (E) Unsupervised classification by all RefSeq protein coding genes that show a highly significant (P<10−3) difference in expression between E12.5 fetal liver and E12.5 ysE (Fig. S4E), showed that cystic EBs cluster closer to fetal liver than to ysE. Hierarchical clustering for (D) and (E) detailed in Supplementary materials.
Fig. 5
Fig. 5
Cystic EBs have a different regulatory network than the yolk sac endoderm. (A) Pie chart representation of gene ontology (GO) analysis of differentially expressed genes between E12.5 ysE and cystic EBs. Significantly differentially expressed genes detected with a FDR of 1% were analyzed using DAVID (Huang et al., 2009). Over represented GO groups/terms (based on an EASE score <10−3) are listed. (B) Genes that show significant differential expression between both developmental stages of ysE (E9.25 and E12.5) and cystic EBs and E12.5 liver are plotted (272 genes, FDR<5%, Fig. S5E). To indicate the direction of differential expression, genes expressed higher in E12.5 ysE are displayed as positive (156 genes) and higher in cystic EBs as negative (118 genes) log2 P values (Table S1). Members of chromatin modifying complexes and transcription factors are highlighted in red. Transcripts that were previously published as markers of ysE are marked with an asterisk. (C) E12.5 ysE expresses the RefSeq annotated shorter isoform of the endoderm specific regulator Hnf4a, while cystic EBs use an alternative promoter to express a longer form that includes a new first exon. Top: UCSC genome browser screenshot showing the RNA-seq tracks and de novo annotation using Cufflinks in cystic EBs and E12.5 ysE (black). Bottom: DEXSeq differential exon usage analysis shows significant differential first exon usage. (D) A novel isoform of the Prdm14 transcription factor distinguishes cystic EBs and E12.5 ysE. Top: A UCSC genome browser screenshot showing RNA-seq for cystic EBs and E12.5 ysE, Cufflinks de novo annotation for both tissues (black), H3K4me3 ChIP-seq for E12.5 VYS (gray, input red) and significant H3K4me3 peaks called using the MACS program. The novel Prdm14 isoform in ysE is supported by a H3K4me3 peak in VYS indicating a novel promoter for this gene. Bottom: DEXSeq differential exon usage analysis shows a significant differential isoform expression between E12.5 ysE and cystic EBs.

Similar articles

Cited by

References

    1. Abe K., Niwa H., Iwase K., Takiguchi M., Mori M., Abe S.I., Yamamura K.I. Endoderm-specific gene expression in embryonic stem cells differentiated to embryoid bodies. Exp. Cell Res. 1996;229:27–34. - PubMed
    1. Anders S., Huber W. Differential expression analysis for sequence count data. Genome Biol. 2010;11:R106. - PMC - PubMed
    1. Antonchuk J. Formation of embryoid bodies from human pluripotent stem cells using AggreWell plates. Methods Mol. Biol. 2013;946:523–533. - PubMed
    1. Artus J., Douvaras P., Piliszek A., Isern J., Baron M.H., Hadjantonakis A.-K. BMP4 signaling directs primitive endoderm-derived XEN cells to an extraembryonic visceral endoderm identity. Dev. Biol. 2012;361:245–262. - PMC - PubMed
    1. Barlow D.P., Bartolomei M.S. Genomic imprinting in mammals. Cold Spring Harb. Perspect. Biol. 2014;6(2) http://dx.doi.org/10.1101/cshperspect.a018382, pii: a018382. - DOI - PMC - PubMed

Publication types