A primer to single-particle cryo-electron microscopy
- PMID: 25910204
- PMCID: PMC4409659
- DOI: 10.1016/j.cell.2015.03.050
A primer to single-particle cryo-electron microscopy
Abstract
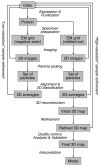
Cryo-electron microscopy (cryo-EM) of single-particle specimens is used to determine the structure of proteins and macromolecular complexes without the need for crystals. Recent advances in detector technology and software algorithms now allow images of unprecedented quality to be recorded and structures to be determined at near-atomic resolution. However, compared with X-ray crystallography, cryo-EM is a young technique with distinct challenges. This primer explains the different steps and considerations involved in structure determination by single-particle cryo-EM to provide an overview for scientists wishing to understand more about this technique and the interpretation of data obtained with it, as well as a starting guide for new practitioners.
Copyright © 2015 Elsevier Inc. All rights reserved.
Figures


Similar articles
-
Cryo electron microscopy to determine the structure of macromolecular complexes.Methods. 2016 Feb 15;95:78-85. doi: 10.1016/j.ymeth.2015.11.023. Epub 2015 Nov 27. Methods. 2016. PMID: 26638773 Free PMC article. Review.
-
Electron cryo-microscopy for elucidating the dynamic nature of live-protein complexes.Biochim Biophys Acta Gen Subj. 2020 Feb;1864(2):129436. doi: 10.1016/j.bbagen.2019.129436. Epub 2019 Sep 13. Biochim Biophys Acta Gen Subj. 2020. PMID: 31525409 Review.
-
Sample preparation of biological macromolecular assemblies for the determination of high-resolution structures by cryo-electron microscopy.Microscopy (Oxf). 2016 Feb;65(1):23-34. doi: 10.1093/jmicro/dfv367. Epub 2015 Dec 15. Microscopy (Oxf). 2016. PMID: 26671943 Review.
-
Cryo-electron microscopy and X-ray crystallography: complementary approaches to structural biology and drug discovery.Acta Crystallogr F Struct Biol Commun. 2017 Apr 1;73(Pt 4):174-183. doi: 10.1107/S2053230X17003740. Epub 2017 Mar 29. Acta Crystallogr F Struct Biol Commun. 2017. PMID: 28368275 Free PMC article. Review.
-
Cryo-electron microscopy and the amazing race to atomic resolution.Biochemistry. 2015 May 26;54(20):3133-41. doi: 10.1021/acs.biochem.5b00114. Epub 2015 May 14. Biochemistry. 2015. PMID: 25955078 Review.
Cited by
-
Pre-pro is a fast pre-processor for single-particle cryo-EM by enhancing 2D classification.Commun Biol. 2020 Sep 11;3(1):508. doi: 10.1038/s42003-020-01229-0. Commun Biol. 2020. PMID: 32917929 Free PMC article.
-
Miniaturized Sample Preparation for Transmission Electron Microscopy.J Vis Exp. 2018 Jul 27;(137):57310. doi: 10.3791/57310. J Vis Exp. 2018. PMID: 30102271 Free PMC article.
-
Deciphering a hexameric protein complex with Angstrom optical resolution.Elife. 2022 May 26;11:e76308. doi: 10.7554/eLife.76308. Elife. 2022. PMID: 35616526 Free PMC article.
-
Fusion protein strategies for cryo-EM study of G protein-coupled receptors.Nat Commun. 2022 Jul 28;13(1):4366. doi: 10.1038/s41467-022-32125-2. Nat Commun. 2022. PMID: 35902590 Free PMC article.
-
The transition structure of chromatin fibers at the nanoscale probed by cryogenic electron tomography.Nanoscale. 2019 Aug 7;11(29):13783-13789. doi: 10.1039/c9nr02042j. Epub 2019 Jun 18. Nanoscale. 2019. PMID: 31211313 Free PMC article.
References
-
- Adiga PS, Malladi R, Baxter W, Glaeser RM. A binary segmentation approach for boxing ribosome particles in cryo EM micrographs. J Struct Biol. 2004;145:142–151. - PubMed
-
- Bai XC, McMullan G, Scheres SH. How cryo-EM is revolutionizing structural biology. Trends Biochem Sci. 2015;40:49–57. - PubMed
-
- Beckmann R, Bubeck D, Grassucci R, Penczek PA, Verschoor A, Blobel G, Frank J. Alignment of conduits for the nascent polypeptide chain in the ribosome-Sec61 complex. Science. 1997;278:2123–2126. - PubMed
Publication types
MeSH terms
Substances
Grants and funding
LinkOut - more resources
Full Text Sources
Other Literature Sources

