. 2015 Apr 24:5:9993.
doi: 10.1038/srep09993.

MicroRNA transcriptomes of distinct human NK cell populations identify miR-362-5p as an essential regulator of NK cell function

Affiliations

MicroRNA transcriptomes of distinct human NK cell populations identify miR-362-5p as an essential regulator of NK cell function

Fang Ni et al. Sci Rep. .

Abstract

Natural killer (NK) cells are critical effectors in the immune response against malignancy and infection, and microRNAs (miRNAs) play important roles in NK cell biology. Here we examined miRNA profiles of human NK cells from different cell compartments (peripheral blood, cord blood, and uterine deciduas) and of NKT and T cells from peripheral blood, and we identified a novel miRNA, miR-362-5p, that is highly expressed in human peripheral blood NK (pNK) cells. We also demonstrated that CYLD, a negative regulator of NF-κB signaling, was a target of miR-362-5p in NK cells. Furthermore, we showed that the over-expression of miR-362-5p enhanced the expression of IFN-γ, perforin, granzyme-B, and CD107a in human primary NK cells, and we found that silencing CYLD with a small interfering RNA (siRNA) mirrored the effect of miR-362-5p over-expression. In contrast, the inhibition of miR-362-5p had the opposite effect in NK cells, which was abrogated by CYLD siRNA, suggesting that miR-362-5p promotes NK-cell function, at least in part, by the down-regulation of CYLD. These results provide a resource for studying the roles of miRNAs in human NK cell biology and contribute to a better understanding of the physiologic significance of miRNAs in the regulation of NK cell function.


Figures
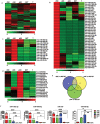
Figure 1
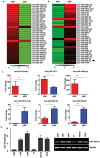
Figure 1. Expression profiles of miRNAs among different lymphocyte subsets.
(a) Hierarchical cluster analysis of differentially expressed miRNAs in various cell subsets. (b–d) Heat map of the signature miRNAs for the dNK (b), cNK (c) and pNK (d) subsets: miRNAs with differences were selected by the expression with a fold change of two or greater in each subset when compared with the remaining four subsets. (e) The Venn diagram shows the number of all differentially expressed miRNAs across the following comparisons: dNK vs. NKT and T, cNK vs. NKT and T, and pNK vs. NKT and T. The number of differentially expressed miRNAs from each comparison is indicated. (f) Quantitative RT-PCR validation of the expression of miR-130a, miR-199b-5p, miR-210, and miR-362-5p in dNK, cNK, pNK, NKT, and T cells. RNU6B was used as an internal control for real-time PCR. Data are representative of three to six experiments. *P < 0.05, **P < 0.01, and ***P < 0.005 (Student's t-test).
Figure 2
Figure 2. MiRNA profiles of various human NK populations.
(a) Heat map of differentially expressed miRNAs in various human NK populations (dNK, cNK, and pNK). Each row represents an individual miRNA and each column represents an individual cell subset. Red, black, and green pseudocolors indicate transcripts levels below, equal, or above the mean, respectively, on a scale representing gene expression ratios from −2 to 2 on a log 2 scale. (b) The Venn diagram shows the number of all differentially expressed miRNAs across different comparisons (dNK vs. cNK, dNK vs. pNK, and cNK vs. pNK. The number of differentially expressed microRNAs from each comparison is indicated. (c) Heat map of the signature microRNAs with a fold change of two or greater in all three of the comparisons (dNK vs. pNK, dNK vs. cNK, cNK vs. pNK). Each row represents an individual miRNA, and each column represents an individual cell subset. Red, black, and green pseudocolors indicate transcripts levels below, equal, or above the mean, respectively, on a scale representing gene expression ratios from −1 to 1 on a log 2 scale. (d–f) Log base 2 intensity plots of miRNA levels for cNK vs. pNK samples (d), cNK vs. dNK samples (e), and dNK vs. pNK samples (f). The middle diagonal line represents equal expression, and the lines to each side represent 2-fold enrichment in either cell population. The labels of axes are log 2 scaled. Pearson correlation r values were used to establish the linear fit of the data.
Figure 3
Figure 3. MiR-362-5p is highly expressed in human pNK cells.
(a–b) miRNAs that were differentially expressed in dNK and pNK populations were divided into two groups consisting of (a) the top 30 miRNAs up-regulated in dNK cells and (b) the top 30 miRNAs up-regulated in pNK cells according to their distinct expression patterns based on hierarchical clustering. Each row represents an individual miRNA, and each column represents an individual cell subsets. Red and green pseudocolors indicate transcripts levels below or above the mean, respectively, on a log 2 scale representing gene expression ratios from 0 to 6. (c) Real-time PCR analysis of the expression of miR-10b-5p, miR-1471, miR-199a-5p, miR-181a-2-3p, miR-26b-3p, and miR-362-5p. (d) Quantitative RT-PCR analysis of miR-362-5p expression in various human primary NK cells and NK cell lines. The expression level was normalized to that of RNU6B. Data are representative of six independent experiments. *P < 0.05, **P < 0.01 and ***P < 0.005 (Student's t-test).
Figure 4
Figure 4. MiR-362-5p directly regulates CYLD expression in human NK cells.
(a) Dual-luciferase assay of HEK-293T cells transfected with luciferase constructs containing genes (n = 5) predicted to be regulated by miR-362-5p, together with synthetic mature miR-362-5p (Synth miR-362-5p) or a synthetic control miRNA with scrambled sequence (Scr ctrl). (b) Diagram of the construction of wild-type (WT) or mutant CYLD 3′ UTR vectors. The mutant binding sequences are underlined. (c) Dual-luciferase assays of miR-362-5p co-transfected with luciferase constructs containing CYLD wild-type 3′ UTR (WT 3′ UTR) or mutated 3′ UTR into HEK 293T cells. The relative luciferase activity was normalized to the Renilla expression activity of the same vector. (d) Quantitative RT-PCR analysis of the expression of CYLD in dNK cells overexpressing miR-362-5p. (e) Western blot analysis of the expression of CYLD in dNK cells overexpressing miR-362-5p. Cropped blots are used. Full-length blots are presented in Supplementary Figure S7. Results are representative of three independent experiments. (f–g) Quantitative RT-PCR analysis (f), and Western blot analysis (g) of CYLD in sort-purified pNK cells transfected with FAM-labeled-miR-362-5p inhibitors (anti-miR-362-5p) or negative control miRNA. Full-length blots are presented in Supplementary Figure S7. Data are from three independent experiments with similar results. *P < 0.05, **P < 0.01 (Student's t-test).
Figure 5
Figure 5. Overexpression of miR-362-5p promotes human NK cell effector function.
(a–b) Quantitative RT-PCR assay of miR-362-5p (a) and PRF1, GzmB, and IFNG (b) in dNK cells transfected with miR-362-5p mimics. (c) Flow cytometry analysis of the expression of perforin, granzyme-B in purified human dNK cells transfected with miR-362-5p mimics or miRNA with scrambled sequence (Control). The graphs show the average relative frequency of all perforin+ or granzyme B+ dNK cells. (d) ELISA of IFN-γ in the supernatants of purified dNK cells transfected with miR-362-5p mimics or control miRNA that were stimulated overnight with IL-2 (100 U/ml), IL-12 (10 ng/ml), and IL-18 (100 ng/ml), beginning 20 h after transfection. Data represent mean of three independent wells. *P < 0.05 among all three donors for control versus miR-362-5p. (e) Flow cytometry analysis of the surface expression of NKp30, NKp44, NKp46, CD69, and NKG2D in dNK cells in c. The graphs show the average relative frequency of all NKp30+, NKp44+, NKp46+, CD69+, and NKG2D+ dNK cells. (F) Flow cytometry for CD107a expression in dNK in c. The graphs show the average relative frequency of CD107a+ dNK cells as above. (g) Flow cytometry assay evaluating the cytotoxic activity of dNK cells in c. Results are expressed as mean ± SEM of triplicate wells from one representative experiment of three experiments completed. (h) Quantitative RT-PCR analysis of PRF1, GzmB, IFNG, and CYLD expression in dNK cells transfected with CYLD siRNA or control siRNA (Ctrl siRNA). Data are representative of three independent experiments with similar results. (i) Intracellular staining of perforin and granzyme-B in purified dNK cells transfected by nucleofection with miR-362-5p mimics, negative control, or CYLD siRNA. (j) ELISA of IFN-γ in the supernatants of purified dNK cells in I. that were stimulated overnight with IL-2 (100 U/ml), IL-12 (10 ng/ml), and IL-18 (100 ng/ml), beginning 20 h after transfection. (K) Flow cytometry for CD107a expression in purified dNK cells in i. Data are representative of three independent experiments (mean ± SEM). *P < 0.05, **P < 0.01 and ***P < 0.005 (Student's t-test).
Figure 6
Figure 6. Inhibition of miR-362-5p acts through CYLD to suppress human NK cell function.
(a–b) Quantitative RT-PCR assay of miR-362-5p (a), and PRF1, GzmB, and IFNG (b) in sort-purified pNK cells transfected with synthetic FAM-labeled-miR-362-5p inhibitor (anti-miR-362-5p) or a synthetic control miRNA (Control). (c–d) Flow cytometry of the expression of perforin, granzyme-B, and IFN-γ; (c), and CD107a (d) in purified human pNK cells transfected with FAM-labeled-anti-miR-362-5p or negative control miRNA (Control). FAM positive pNK cells were gated and analyzed. The graphs show the average relative frequency of perforin+, granzyme-B+, IFN-γ, or CD107a+ pNK cells as determined above. (e) Flow cytometry assay evaluating the cytotoxic activity of pNK cells transfected with anti-miR-362-5p or control miRNA. Results are expressed as mean ± SEM of triplicate wells from one representative experiment of three experiments completed. (f–g) Flow cytometry analysis of the expression of perforin, granzyme-B and IFN-γ (f); and CD107a (g) in purified pNK cells transfected with FAM-anti-miR-362-5p in the presence or absence of CYLD siRNA. Representative FACS plots from FAM+ cells are shown. The graphs show the average relative frequency of all perforin+, granzyme-B+, IFN-γ+, or CD107a+ pNK cells as above. Data are representative of three independent experiments (mean ± SEM). *P < 0.05, **P < 0.01 and ***P < 0.005 (Student's t-test).

Similar articles

Cited by

References

    1. Di Santo J. P. Natural killer cell developmental pathways: a question of balance. Annu Rev Immunol. 24, 257–286 (2006). - PubMed
    1. Yokoyama W. M., Kim S., & French A. R. The dynamic life of natural killer cells. Annu. Rev. Immunol. 22, 405–429 (2004). - PubMed
    1. Smyth M. J., Hayakawa Y., Takeda K., Yagita H. New aspects of natural-killer-cell surveillance and therapy of cancer. Nat. Rev. Cancer. 2, 850–861(2002). - PubMed
    1. Lodoen M. B, Lanier LL. Natural killer cells as an initial defense against pathogens. Curr. Opin. Immunol. 18, 391–398 (2006). - PMC - PubMed
    1. Baginska J. et al. The critical role of the tumor microenvironment in shaping natural killer cell-mediated anti-tumor immunity. Front Immunol. 4, 490 (2013). - PMC - PubMed

Publication types