. 2015 Apr 23;10(4):e0124966.
doi: 10.1371/journal.pone.0124966. eCollection 2015.

Antibodies to the core proteins of Nairobi sheep disease virus/Ganjam virus reveal details of the distribution of the proteins in infected cells and tissues

Affiliations

Antibodies to the core proteins of Nairobi sheep disease virus/Ganjam virus reveal details of the distribution of the proteins in infected cells and tissues

Lidia Lasecka et al. PLoS One. .

Abstract

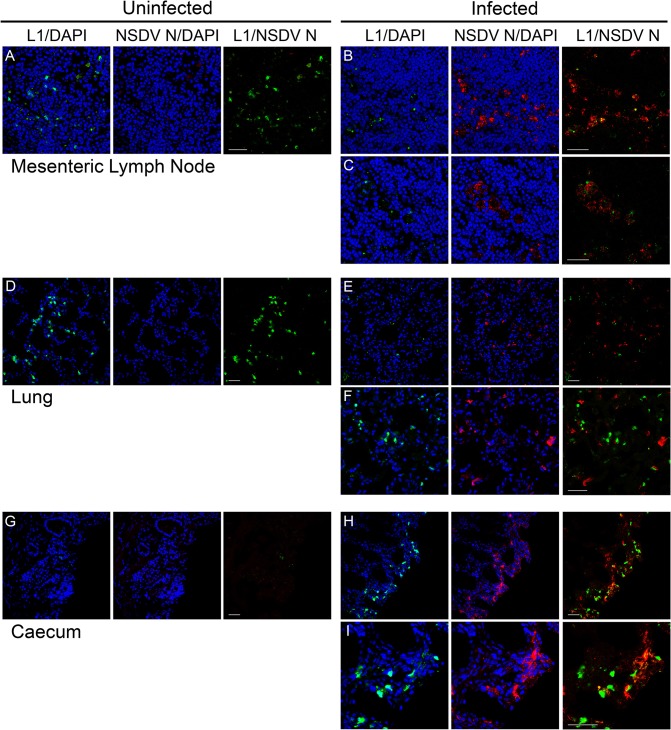
Nairobi sheep disease virus (NSDV; also called Ganjam virus in India) is a bunyavirus of the genus Nairovirus. It causes a haemorrhagic gastroenteritis in sheep and goats with mortality up to 90%. The virus is closely related to the human pathogen Crimean-Congo haemorrhagic fever virus (CCHFV). Little is currently known about the biology of NSDV. We have generated specific antibodies against the virus nucleocapsid protein (N) and polymerase (L) and used these to characterise NSDV in infected cells and to study its distribution during infection in a natural host. Due to its large size and the presence of a papain-like protease (the OTU-like domain) it has been suggested that the L protein of nairoviruses undergoes an autoproteolytic cleavage into polymerase and one or more accessory proteins. Specific antibodies which recognise either the N-terminus or the C-terminus of the NSDV L protein showed no evidence of L protein cleavage in NSDV-infected cells. Using the specific anti-N and anti-L antibodies, it was found that these viral proteins do not fully colocalise in infected cells; the N protein accumulated near the Golgi at early stages of infection while the L protein was distributed throughout the cytoplasm, further supporting the multifunctional nature of the L protein. These antibodies also allowed us to gain information about the organs and cell types targeted by the virus in vivo. We could detect NSDV in cryosections prepared from various tissues collected post-mortem from experimentally inoculated animals; the virus was found in the mucosal lining of the small and large intestine, in the lungs, and in mesenteric lymph nodes (MLN), where NSDV appeared to target monocytes and/or macrophages.


Conflict of interest statement

Competing Interests: The authors have declared that no competing interests exist.

Figures

Fig 1
Fig 1. Characterisation of NSDV core proteins in infected cells.
(A) Vero cells were infected with the NSDVi isolate at a MOI of 5 TCID50 (NSDV) or left uninfected (uninf.). After 16 h, cells were harvested, lysed in sample buffer and proteins separated by SDS-PAGE; proteins were detected by Western blot using sera raised against the NSDV N protein, the C-terminus of the L protein or the N-terminus of the L protein, as indicated. (B) Sheep kidney epithelial cells (PO) or Vero cells were infected with the NSDVi isolate at a MOI of 0.3 TCID50. After 16 h, cells were fixed using 4% PFA followed by ice cold methanol, and immunolabelled using sera raised against the NSDV N- or the C-terminus of the L protein followed by AlexaFluor-568 goat anti-rabbit IgG (red). DAPI was used as a counterstain (blue). Bars indicate 20 μm.
Fig 2
Fig 2. Detection of the full length L protein in NSDV-infected cells.
Vero cells were infected with the NSDVi isolate at a MOI of 6 TCID50 or left uninfected (uninf.). After 16 h, infected and uninfected cells were harvested using SDS Sample Buffer containing protease inhibitors, and proteins were separated on 5% acrylamide SDS-PAGE gels and transferred onto polyvinylidene difluoride (PVDF) membrane. The membrane was cut vertically along the middle of the track containing proteins from infected cell lysate. Blots were then incubated with the indicated antiserum or purified antibodies before developing with HRP-anti-rabbit IgG. (A) Filters were incubated with diluted antiserum raised against the N-terminus of the L protein (anti-L(NT)) or the C-terminus of the L protein (anti-L(CT)). (B) Filters were incubated with the pre-immune sera corresponding to the sera used in A. (C) Membranes were incubated with affinity purified antibodies extracted from the sera used in A. For all immunoblots the migration position of protein size markers are indicated. The star (*) indicates a non-L protein peptide labelled by crude antiserum but not by affinity-purified antibody.
Fig 3
Fig 3. Colocalisation of the N-terminal and the C-terminal part of the L protein in NSDV-infected cells.
Vero cells were infected with the NSDVi isolate at a MOI of 1 TCID50. After 16 h, cells were fixed using 4% PFA followed by ice cold methanol. (A-H): Cells were stained sequentially with affinity-purified antibodies directed against the N-terminus of the L protein, Zenon AlexaFluor 488 (green) rabbit IgG labelling reagent (Fab:antibody ratio 5.6), and pre-made complex of affinity purified antibodies against the C-terminus of the L protein with Zenon AlexaFluor 594 (red) rabbit IgG labelling reagent (Fab:antibody ratio 3). (I-P): Cells were stained sequentially with affinity purified anti-L(C-terminus) antibodies, Zenon Alexa Fluor 488 (green) rabbit IgG labelling reagent (Fab:antibody ratio 3.6), and then again with pre-made complex of affinity purified anti-L(C-terminus) antibodies with Zenon Alexa Fluor 594 (red) rabbit IgG labelling reagent (Fab:antibody ratio 3). Nuclei were counterstained using DAPI (blue). Representative focal planes from Z-stack series are shown. The ImarisColoc function of the Imaris x64 version 7.4.2 software was used to generate a colocalisation channel (D, H, L, P) from each 3D image, each of which was generated from eight focal planes through the thickness of an infected cell. Dashed white boxes in A-D and I-L indicate the area enlarged to show in E-H and M-P. Scale bars are shown.
Fig 4
Fig 4. Quantitative analysis of colocalisation of the L protein N- and C-termini in infected cells.
Three 3D images of infected cells, prepared as described for Fig 3 and each composed of eight focal slices, were analysed by the ImarisColoc function of the Imaris x64 version 7.4.2 software, using automatic threshold determination. (A-D) 2D plots of light intensity for each voxel in the 3D image for different pairs of channels for different pairs of antibodies: (A) plot of single channel against itself to illustrate theoretically perfect colocalisation; (B) plot of cytoplasmic L protein staining (green) vs nuclear DNA staining (blue) to illustrate perfect absence of colocalisation; (C) plot of actual perfect colocalisation, from staining infected cells with the same antibody (anti-L(CT)) labelled with two different fluorophores (Zenon 488 (green) or with Zenon 594 (red)); (D) plot of signal intensities given by anti-L(NT) and anti-L(CT). (E) Histogram showing average percentage of colocalisation (expressed as average “Pearson's coefficient in dataset volume”) between 488 and 594 signals from three analysed 3D images for each of control (infected cells stained only with anti-L(CT)) and experimental (infected cells co-stained with affinity purified anti-L(NT) and anti-L(CT)) samples. Error bars represent standard deviation.
Fig 5
Fig 5. Distribution of the N and L proteins in NSDV-infected cells.
Vero cells were infected with the NSDVi isolate at a MOI of 1 TCID50. After 8, 12 or 16 h cells were fixed with 4% PFA followed by ice cold methanol and were stained sequentially with affinity purified anti-L(CT) antibodies, Zenon AlexaFluor 594 (red) (Fab:antibody ratio 3.5) and pre-made complex of affinity purified rabbit anti-N antibodies with Zenon AlexaFluor 488 (green) (Fab:antibody ratio 3). Nuclei were counterstained using DAPI (blue). Representative focal planes from Z-stack series are shown. The ImarisColoc function of the Imaris x64 version 7.4.2 software was used to generate a colocalisation channel (D, I, N, S) for each time post infection using images composed of 6 (P-R), 10 (A-C) or 14 (F-H and K-M) focal planes through the thickness of an infected cell. To highlight areas where the L protein is present in the absence of the N protein, the colocalisation channel was subtracted from the L channel (red) (E, J, O, T). Bars correspond to 20 μm unless otherwise indicated. Dashed white boxes in (K-O) indicate the area shown enlarged in (P-T). Arrowheads in A highlight the punctate distribution of the N protein at 8 hpi.
Fig 6
Fig 6. Quantitative analysis of colocalisation of the N and L proteins in infected cells.
For each time point post infection, three 3D images, prepared as described for Fig 5 and each composed of 10 (8hpi) or 14 (12 and 16 hpi) focal slices, were analysed by the ImarisColoc function of the Imaris x64 version 7.4.2 software, using automatic threshold determination. (A-I) 2D plots of channel intensity in each voxel of the 3D images. (A-C) Plots showing the spatial correlation (colocalisation) of the N (green signal) and L (red signal) proteins over time (N+L); (D-F) plots showing the correlation between the total N-specific signal and the signal in the N-L colocalisation channel calculated by Imaris (white) over time (Col.+N); (G-I) corresponding plots of the correlation between the total L-specific signal and the signal in the N-L colocalisation channel (Col.+L). (J) Histogram showing normalised average percentage of colocalisation analysed for three different 3D images for each time point (expressed as average “Pearson's coefficient in dataset volume” between the N and L signal divided by average “Pearson's coefficient in dataset volume” of the positive control where infected cells were stained only with anti-L(CT), labelled independently with both fluorophores). Error bars represent standard deviation; p-values are for statistical comparison of colocalisation at 8 hpi compared to 12 and 16 hpi.
Fig 7
Fig 7. NSDV N protein distribution in caecum, duodenum and lung of infected sheep.
Tissue samples were taken post-mortem from animals infected with the NSDVi isolate in a study previously described [18], or from healthy animals that were not subject to any experimental procedures. Cryosections were prepared and sections were fixed and stained as described in Methods, using mouse monoclonal anti-collagen IV antibody (Coll) and affinity-purified rabbit anti-NSDV N protein antibodies (NSDV N), followed by AlexaFluor 488 goat anti-mouse IgG (green) and AlexaFluor 568 goat anti-rabbit IgG (red). DAPI was used as a counterstain (blue). Scale bars indicate 40 μm (A, B, D, E, G, H) or 10 μm (C, F, I).
Fig 8
Fig 8. NSDV N protein distribution in lymph node, spleen, liver and kidney of infected sheep.
Cryosections were prepared and stained as described for Fig 7. Scale bars indicate 40 μm (A, B, D, E, G, H, J, K) or 10 μm (C, F, I).
Fig 9
Fig 9. Effect of NSDV infection on distribution of macrophages/monocytes in experimentally inoculated sheep.
Cryosections were prepared as described for Fig 7 and stained with mouse monoclonal anti-calprotectin/L1 antibody (L1) and affinity-purified rabbit anti-NSDV N protein antibodies (NSDV N), followed by Alexa Fluor 488 goat anti-mouse IgG (green) and Alexa Fluor 568 goat anti-rabbit IgG (red). DAPI was used as a counterstain (blue). Scale bars indicate 40 μm.

Similar articles

Cited by

References

    1. Casals J, Tignor GH. The Nairovirus genus: serological relationships. Intervirology. 1980;14(3–4):144–147. Epub 1980/01/01. PubMed . - PubMed
    1. Clerx JP, Casals J, Bishop DH. Structural characteristics of nairoviruses (genus Nairovirus, Bunyaviridae). J Gen Virol. 1981;55(Pt 1):165–178. Epub 1981/07/01. PubMed . - PubMed
    1. Zeller HG, Karabatsos N, Calisher CH, Digoutte JP, Cropp CB, Murphy FA, et al. Electron microscopic and antigenic studies of uncharacterized viruses. II. Evidence suggesting the placement of viruses in the family Bunyaviridae. Arch Virol. 1989;108(3–4):211–227. PubMed . - PubMed
    1. White WR. Nairobi Sheep Disease In: 7th, editor. Foreign Animal Disease: Boca Publications Group; 2008. p. 335–342.
    1. Uilenberg G. General review of tick-borne diseases of sheep and goats world-wide. Parassitologia. 1997;39(2):161–165. Epub 1997/06/01. PubMed . - PubMed

Publication types

Substances

LinkOut - more resources