. 2015 Jul;23(7):1262-1277.
doi: 10.1038/mt.2015.77. Epub 2015 Apr 23.

Bioengineering Thymus Organoids to Restore Thymic Function and Induce Donor-Specific Immune Tolerance to Allografts

Affiliations

Bioengineering Thymus Organoids to Restore Thymic Function and Induce Donor-Specific Immune Tolerance to Allografts

Yong Fan et al. Mol Ther. 2015 Jul.

Abstract

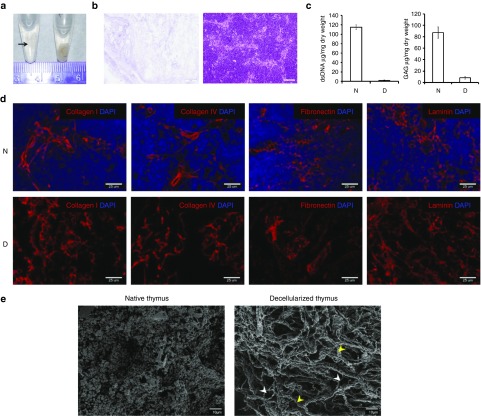
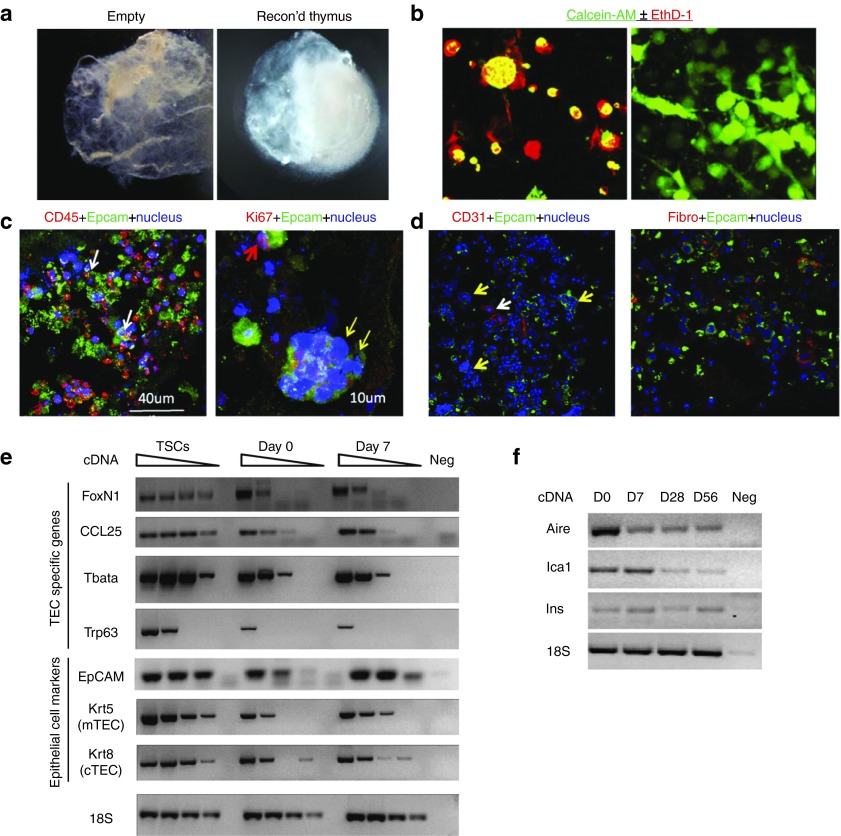
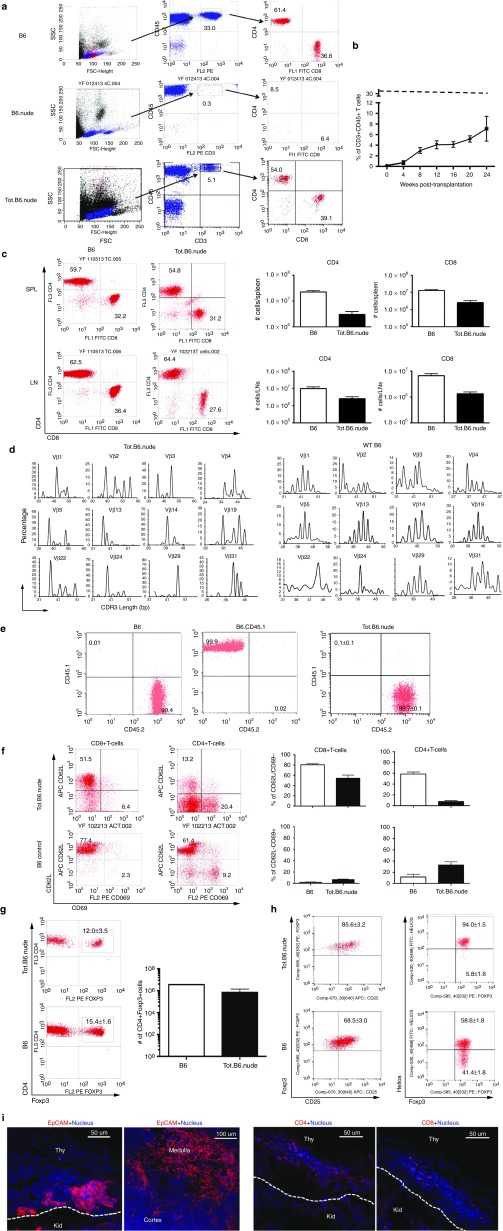
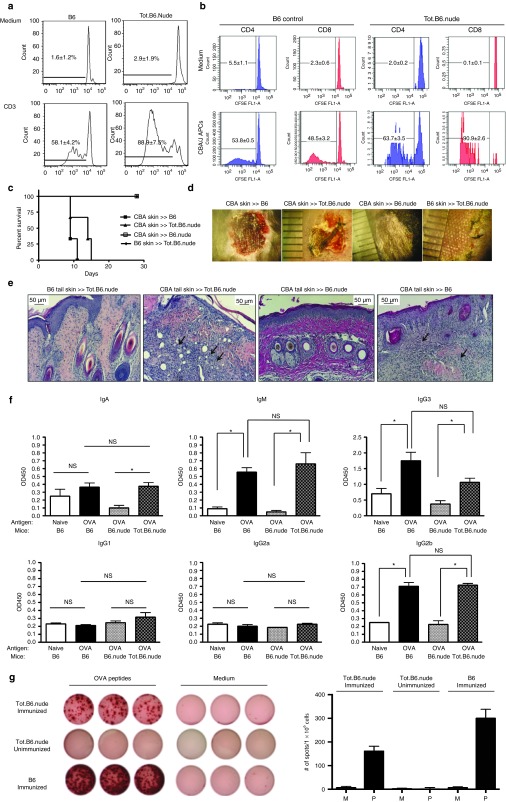
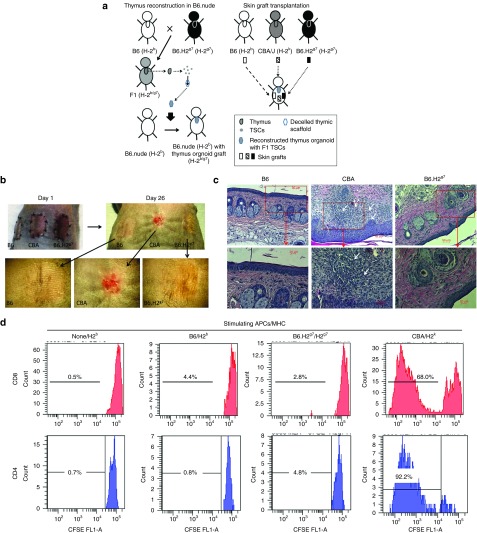
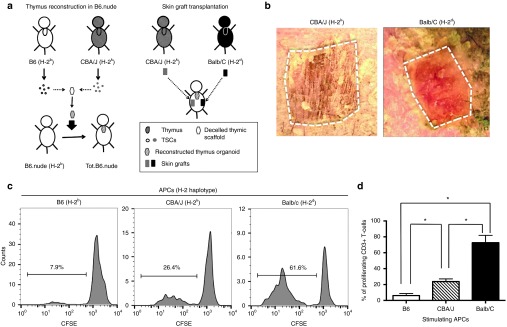
One of the major obstacles in organ transplantation is to establish immune tolerance of allografts. Although immunosuppressive drugs can prevent graft rejection to a certain degree, their efficacies are limited, transient, and associated with severe side effects. Induction of thymic central tolerance to allografts remains challenging, largely because of the difficulty of maintaining donor thymic epithelial cells in vitro to allow successful bioengineering. Here, the authors show that three-dimensional scaffolds generated from decellularized mouse thymus can support thymic epithelial cell survival in culture and maintain their unique molecular properties. When transplanted into athymic nude mice, the bioengineered thymus organoids effectively promoted homing of lymphocyte progenitors and supported thymopoiesis. Nude mice transplanted with thymus organoids promptly rejected skin allografts and were able to mount antigen-specific humoral responses against ovalbumin on immunization. Notably, tolerance to skin allografts was achieved by transplanting thymus organoids constructed with either thymic epithelial cells coexpressing both syngeneic and allogenic major histocompatibility complexes, or mixtures of donor and recipient thymic epithelial cells. Our results demonstrate the technical feasibility of restoring thymic function with bioengineered thymus organoids and highlight the clinical implications of this thymus reconstruction technique in organ transplantation and regenerative medicine.


Figures

Figure 1
Figure 1
Preservation of 3-D ECM architecture in decellularized mouse thymus scaffolds. (a) Mouse thymus was decellularized with detergent and preserved in PBS. D, decellularized thymus (arrow); N, naive thymus. (b) H&E images of 7um paraffin sections of decellularized thymus scaffolds (D, left panel) and naive thymus (N, right panel). No remnant cell is detected after the completion of decellularization. White scale bar, 50 µm. (c) Left panel, Picogreen analysis of DNA contents in decellularized thymus scaffolds (D, n = 3), showing the removal of up to 99% of DNA materials, in comparison to the naive thymi (N, n = 3). Right panel, glycosaminoglycan (GAG) content in the decellularized thymus scaffolds. About 7.5% of sulfated GAG contents are preserved in the scaffolds. (d) Immunohistochemical analysis of the preservation of the extracellular matrix (ECM) components (red) in the thymus scaffolds. Cryosections of naive thymus (N, upper panels) and decellularized thymus scaffolds (d, lower panels) were stained with antibodies against ECM proteins (red, Collagen I, Collagen IV, fibronectin, and laminin), and counterstained with DAPI (4′,6-diamidino-2-phenylindole) for nucleus (blue). (e) Ultrastructure characterization of native and decellularized thymus. Left panel, representative scanning electron microscopy (SEM) image of native thymus (N) showing distinct individual cells. Right panel, SEM image of decellularized thymus (D) shows the preservation of 3D meshwork within the parenchymal space composed of variety of fibers, including large bundle of Type I collagen (yellow arrowhead) associated with a variety of smaller fibers (white arrowhead). No cell is detected throughout all tissue layers, indicating complete removal of the cellular components.
Figure 2
Figure 2
Reconstruction of thymus organoids from decellularized thymus scaffolds. (a) Light microscopic images of a decellularized thymus scaffold (left panel) and a reconstructed thymus organoid (with CD45 thymic stromal cells and bone marrow cells of Lin population at 1 : 1 ratio) cultured overnight in vitro (right panel). (b) Fluorescent microscopic images of thymic stromal cells (TSCs) cultured either as “hanging drop” overnight (left panel) or in the 3-D scaffold for 7 days (right panel). Live cells were discriminated from the dead cells by their intracellular esterase activities to generate green fluorescent calcein-AM (green) and their capabilities to exclude the red-fluorescent ethidium homodimer-1 (EthD-1, red) from entering the nucleus. (c,d) Representative immunohistochemical images of reconstructed thymus organoids cultured in vitro for 7 (d) or 21 (c) days. (c) Cryosections were stained with antibodies against Epcam (green), counterstained with either anti-CD45 (red, left panel) or anti-Ki67 (red, right panel) antibodies. In the left panel, white arrows show the presence of close interactions between the CD45+ thymocytes and the Epcam+ thymic epithelial cells (TECs). In the right panel, the yellow arrows show the presence of multicellular thymus nurse cell complex, whereas the red arrow shows a Ki67+Epcam+ TEC. (d) Cryosections were stained with endothelial cell-specific anti-CD31 antibodies (red, left panel) and fibroblast-specific antibodies (red, fibro, right panel). Both sections are counterstained with the anti-Epcam antibodies (green) and the Hoechst 33342 dye (blue) for TECs and nuclei, respectively. (e) Semiquantitative RT-PCR analyses of CD45 thymic stroma specific gene expression in TSCs, reconstructed thymus organoids cultured in vitro for 0 and 7 days (day 0 and day 7, respectively). Sample dilutions: undiluted, 1/4, 1/16, and 1/64. (f) RT-PCR analyses of tissue-specific antigen transcription in reconstructed thymus organoids cultured in vitro for 0, 7, 28, and 56 days. All the experiments were repeated at least once with similar results.
Figure 3
Figure 3
Reconstructed thymus organoids support T lymphopoiesis in athymic hosts in vivo. (a) Representative flow cytometric (FCM) profiles for both CD3+CD4+ and CD3+CD8+ T-cells in the blood circulation of B6.nude mice transplanted with reconstructed thymus organoids (Tot.B6.nude, 16-weeks post-transplantation, lower panels), in comparison to the profiles of either the wild-type (WT) C57BL/6 (B6, 16 weeks old, top panels) or the athymic B6.nude (16 weeks old, middle panels) mice. Numbers indicate the frequencies of cells within the indicated areas. (b) Progression of T-cell development in Tot.B6.nude mice. Percentages of CD3+CD45+ T-cells in peripheral blood leukocytes (PBLs) of Tot.B6.nude mice (n = 4–15) were analyzed by FCM every 4 weeks post-thymus organoid transplantation. Dashed line shows the percentage of T-cells in PBLs of 8-week old, WT B6 mice (33.5 ± 2.2%, n = 5). Data were presented as mean ± SEM. (c) Analyses of T lymphocytes in Tot.B6.nude mice. Splenocytes and lymph node (LN) cells were stained for CD3, CD45, CD4, and CD8 and were gated on the CD45+CD3+ population. Left panels, representative FCM profiles for CD4+ and CD8+ T-cells in the spleens (SPL, upper panels) and LNs (lower panels) of Tot.B6.nude mice (n = 5, 20 weeks postoperatively) and B6 controls (n = 3, 8 weeks old). Right panels, the total numbers of CD4 and CD8 T-cells in the SPL and LNs of Tot.B6.nude (n = 5) and B6 (n = 3) mice. Data were presented as mean ± SEM. (d) Spectratyping analysis of the CDR3 Vβ regions of mouse T-cells isolated from the SPL of Tot.B6.nude (n = 3) and WT B6 (n = 3). (e) FCM analyses of the origins of peripheral T-cells in Tot.B6.nude mice (n = 5). CD4 T-cells harvested from LNs of WT B6 (n = 3), B6.CD45.1 congenic (n = 3), and Tot.B6.nude mice were stained with CD45.1 and CD45.2 congenic markers. (f) FCM analyses of activation status of peripheral CD4 and CD8 T-cells. T-cells harvested from SPL of WT B6 (open bar, n = 5) and Tot.B6.nude (filled bar, n = 5) mice were stained for CD62L and CD69. Left panel, representative dot blots. Numbers in the representative FCM profiles indicate the frequencies of cells within the indicated areas. Right panel, percentages of CD8+ (left columns) and CD4+ (right columns) T-cells displayed naive (CD62L+CD69, top panels) or activated (CD62LCD69+, lower panels) phenotypes. Data were presented as mean ± SEM. (g) FCM analyses of the frequencies of Foxp3+ regulatory cells in the CD4 T-cell population. T-cells were harvested from SPL of WT B6 (n = 5) and Tot.B6.nude (n = 5) mice were stained intracellularly for Foxp3. Left panel, representative dot blots of CD4+Foxp3+ regulatory T-cells. Numbers in the representative FCM profiles indicate the frequencies of cells within the indicated areas. Right panel, numbers of CD4+Foxp3+ T-cells in the SPL of Tot.B6.nude mice (filled bar, n = 5) and WT B6 controls (open bar, n = 5). Data were presented as mean ± SEM. (h) FCM analyses of CD4+Foxp3+ regulatory cells in the SPL of WT B6 (n = 5) and Tot.B6.nude (n = 5) mice. Representative dot blots showing CD25 (left panels) and Helios (right panels) expression in CD4+Foxp3+ regulatory T-cells. Numbers in the representative FCM profiles indicate the frequencies of cells within the indicated areas. Data were presented as mean ± SEM. (i) Immunohistochemical analyses of reconstructed thymus organoids. Representative 7 µm cryosections of thymus organoid grafts, harvested from the kidneys of Tot.B6.nude mice (16 weeks postoperatively), were stained for EpCAM (left top panel, red), CD4 (left lower panel, red), and CD8 (right lower panel, red), and counterstained with Hoechst 33342 (blue). Areas of the reconstructed thymus organoid graft (Thy) and the kidney (Kid) were separated by white dotted lines. Right top panel, a representative cryosection of a control WT B6 thymus stained with EpCAM (red). All the experiments were repeated at least once with similar results.
Figure 4
Figure 4
Reconstructed thymus organoids can support T-cell-mediated immunity in athymic hosts in vivo. (a) Proliferation of T-cells in response to T-cell receptor (TCR) stimulation. T-cells harvested from the spleens of Tot.B6.nude (n = 4, right panels) and WT B6 mice (n = 4, left panels) were labeled with carboxyfluorescein diacetate succinimidyl ester (CFSE) and cultured for 7 days in the presence or absence of activating CD3 antibodies. Cells were stained for CD3 and B220, gated on the CD3+B220 populations were analyzed by FCM for CFSE levels. All assays were run in triplicate. (b) Proliferation of T-cells in response to alloantigens. T-cells enriched from Tot.B6.nude (n = 4) and WT B6 mice (n = 4) were labeled with CFSE and cultured for 7 days in the presence (lower panels) and absence (upper panels) of T-cell depleted allogeneic antigen presenting cells (APCs) isolated from CBA/J mice. All proliferation assays were run in triplicate. (c) Survival of allogeneic (CBA/J) skin grafts in WT B6 (n = 3), B6.nude (n = 3), and Tot.B6.nude (n = 3) mice, and syngeneic (B6) skin grafts in Tot.B6.nude (n = 3). (d) Representative photographic images of allogeneic skin grafts in B6, B6.nude, and Tot.B6.nude mice at day 15 post-transplantation. (e) Representative histological images (H&E) of paraffin sections of skin grafts harvested from Tot.B6.nude (n = 4), B6.nude (n = 3), and WT B6 (n = 3). Arrows indicate the infiltration of immune cells in the injected skin grafts. (f) Analyses of seroreactivities against ovalbumin (OVA) in naive B6 mice (n = 5, open bar), B6 mice immunized with OVA (n = 5, black bar), B6.nude immunized with OVA (n = 3, gray bar), and Tot.B6.nude immunized with OVA (n = 4, shaded bar). Levels of OVA-reactive immunoglobulins of various classes and subclasses were determined with ELISA-based, colorimetric assay. NS, not significant; * P < 0.05, nonparametric Mann–Whitney test. The assays were repeated twice with similar results. (g) Enzyme-Linked ImmunoSpot (ELISpot) analyses of interferon (IFN)-γ-expressing T-cells. Splenocytes harvested from immunized Tot.B6.nude mice (n = 4) were challenged with OVA peptides (AVHAAHAEINEAGSIINFEKL). Left panels, representative ELISpot images (in triplicate) of splenocytes cultured in presence (left columns) or absence (right columns) of OVA peptides: top rows, immunized Tot.B6.nude mice (n = 4); middle rows, naive Tot.B6.nude (n = 3); lower rows, immunized WT B6 control (n = 4). Right panels, numbers of IFN-γ-producing spots in the presence of medium (M, open bar) or OVA peptide (P, filled bar). Data were presented as mean ± SEM. The results were obtained from three independent experiments. All assays were run at least in triplicate.
Figure 5
Figure 5
Establishing donor-specific immune tolerance in mouse with reconstructed thymus organoids. (a) Schematic outline of strategies to induce immune tolerance of allografts with reconstructed thymus organoid transplantation. Thymus organoids were constructed with thymic stromal cells (TSCs) harvested from F1 offspring of B6 (H-2b) and congenic B6.H2g7 (H-2g7) mice and transplanted to athymic B6.nude mice to generate Tot.B6.nude recipients. Once successful T-lymphopoiesis was demonstrated through flow cytometric (FCM) analyses of peripheral lymphocytes (12–16 weeks post-thymus transplantation), tail skin grafts harvested from wild-type (WT) B6 (syngeneic), congenic B6.H2g7 (allogeneic) and CBA/J (H-2k, third party allogeneic) mice were transplanted to the recipients and were monitored for their survival. (b) Representative photographic images of syngeneic (B6) and allogeneic (CBA and B6.H2g7) skin grafts of Tot.B6.nude recipients (n = 4) at day 1 and day 26. Lower panels, higher magnified images of the skin grafts (dotted line) at day 26. Arrows indicate the rejected graft. (c) Representative histological images (H&E) of syngeneic (B6), allogeneic (B6. H2g7), and third-party allogeneic (CBA) skin grafts harvested from Tot.B6.nude recipients (n = 4) at 26 days postskin transfer. Higher magnified images of areas in the red boxes are shown in the lower panels. White arrows show areas with lymphocytic infiltration. (d) Proliferation of T-cells of Tot.B6.nude mice (n = 3) in response to alloantigens. T-cells enriched from Tot.B6.nude (n = 3) were labeled with carboxyfluorescein diacetate succinimidyl ester (CFSE) and cultured for 7 days in the presence of T-cell depleted syngeneic (B6), allogeneic (B6.H2g7), and third-party allogeneic (CBA) APCs. Representative FCM results of CD4+ (left panels) and CD8+ (right panels) T-cells are shown. N/A, no APCs were added to the culture. All proliferation assays were run in triplicate.
Figure 6
Figure 6
Induction of donor-specific immune tolerance with thymus organoids reconstructed of both donor and recipient thymic epithelial cells (TECs). (a) The schematic drawing shows the strategy of the experiment. TECs were isolated from B6 and CBA/J mice and mixed at 1 : 1 ratio. The thymus organoids were reconstructed with B6 Lin-bone marrow progenitors and TECs at 1 : 1 ratio (2 × 105 each), and transplanted underneath the kidney capsules of B6.nude mice. Ten weeks postoperatively, skin grafts harvested from CBA/J and Balb/C (third-party allografts) mice were transplanted to the Tot.B6.nude mice (n = 4). Graft survival was monitored for up to 4 weeks. (b) Representative photographic images of skin grafts (outlined) on Tot.B6.nude at 22 days postoperatively. While the third-party allograft (left panel, Balb/C) is largely rejected, the CBA/J allograft (right panel) is well tolerated. (c,d) Mixed lymphocyte reaction (MLR) experiments, showing the proliferation responses of CD3+ T-cells of the recipient Tot.B6.nude mice (n = 4) in the presence of syngeneic or allogeneic APCs. (c) Representative carboxyfluorescein diacetate succinimidyl ester (CFSE) dilution histogram: Left panel, syngeneic B6 APCs; middle panel, CBA/J allogeneic APCs; right panel, third-party allogeneic APCs. (d) Percentages of proliferating CD3+ T-cells. *P < 0.05, nonparametric Mann–Whitney test.

Similar articles

Cited by

References

    1. Fink, PJ (2013). The biology of recent thymic emigrants. Annu Rev Immunol 31: 31–50. - PubMed
    1. Boehm, T (2008). Thymus development and function. Curr Opin Immunol 20: 178–184. - PubMed
    1. Heng, TS, Chidgey, AP and Boyd, RL (2010). Getting back at nature: understanding thymic development and overcoming its atrophy. Curr Opin Pharmacol 10: 425–433. - PubMed
    1. Fletcher, AL, Calder, A, Hince, MN, Boyd, RL and Chidgey, AP (2011). The contribution of thymic stromal abnormalities to autoimmune disease. Crit Rev Immunol 31: 171–187. - PubMed
    1. Takada, K, Ohigashi, I, Kasai, M, Nakase, H and Takahama, Y (2014). Development and function of cortical thymic epithelial cells. Curr Top Microbiol Immunol 373: 1–17. - PubMed

Publication types